Written by: danny
The trading volume of cryptocurrency exchanges may be the biggest lie in the industry. This article uses on-chain data to reverse-engineer the actual monthly trading volume of the top 8 centralized exchanges (CEX), resulting in a conclusion that is counterintuitive. Are the market shares of Binance, OKX, and Bitget possibly underestimated?
Volume manipulation is almost zero cost — market makers are exempt from fees, API matching doesn't require on-chain settlement, and VIP rebates can even make you "earn more by trading more." As a result, when you open any trading exchange ranking site, you might find that half of the numbers are ghost trades.
However, decentralized exchanges on-chain are different. Every trade requires real margin and real gas fees, and everything is fully transparent. This gives us a measuring stick.
We collected the official reserve data and 30-day trading volume data from the top 8 CEXs, including Binance, OKX, Bybit, Bitget, Gate.io, MEXC, KuCoin, and HTX, and used the on-chain data of Hyperliquid as the "benchmark" to reverse-engineer how much of each exchange's monthly trading volume is actually real.
The conclusion is not unexpected: of a reported trading volume of $361 billion over the last 30 days by a certain exchange, it is estimated that over half is inflated; Binance’s real market share is not 39%, but may be close to 46%; the entire industry may have more than $300 billion of fictional trading volume each month.
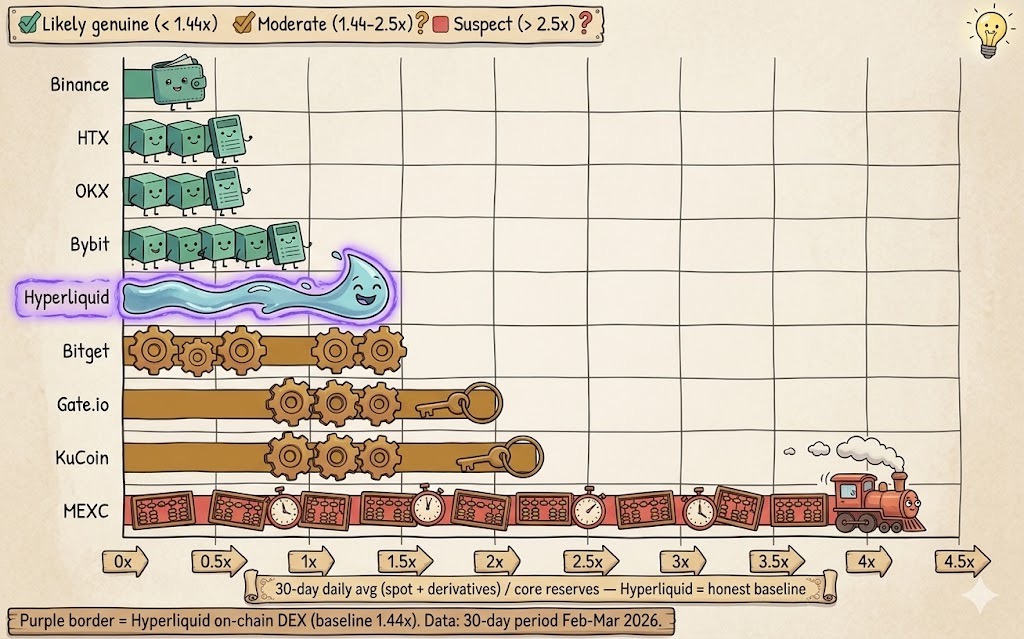
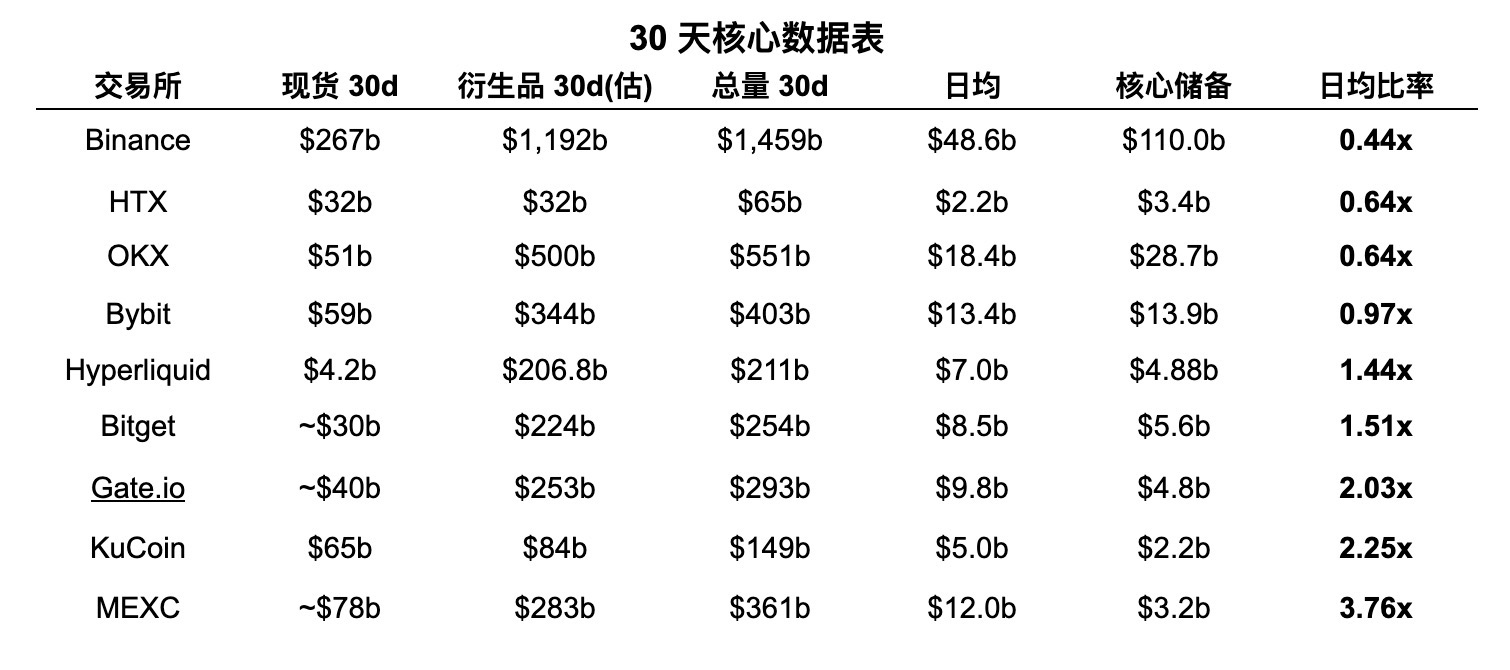
30-day average Vol/Reserve ratio ranking
Data period: February to March 2026 (30 days) | Source: Official Proof of Reserves from various exchanges, DefiLlama, CoinGlass, Newhedge
Note: This article only samples these eight exchanges and does not represent the market share of the entire market; actual conclusions will certainly have errors!
1. Benchmark: Why is Hyperliquid that measuring stick?
To determine if CEX trading volumes are real, first, a "benchmark" is needed. We chose Hyperliquid.
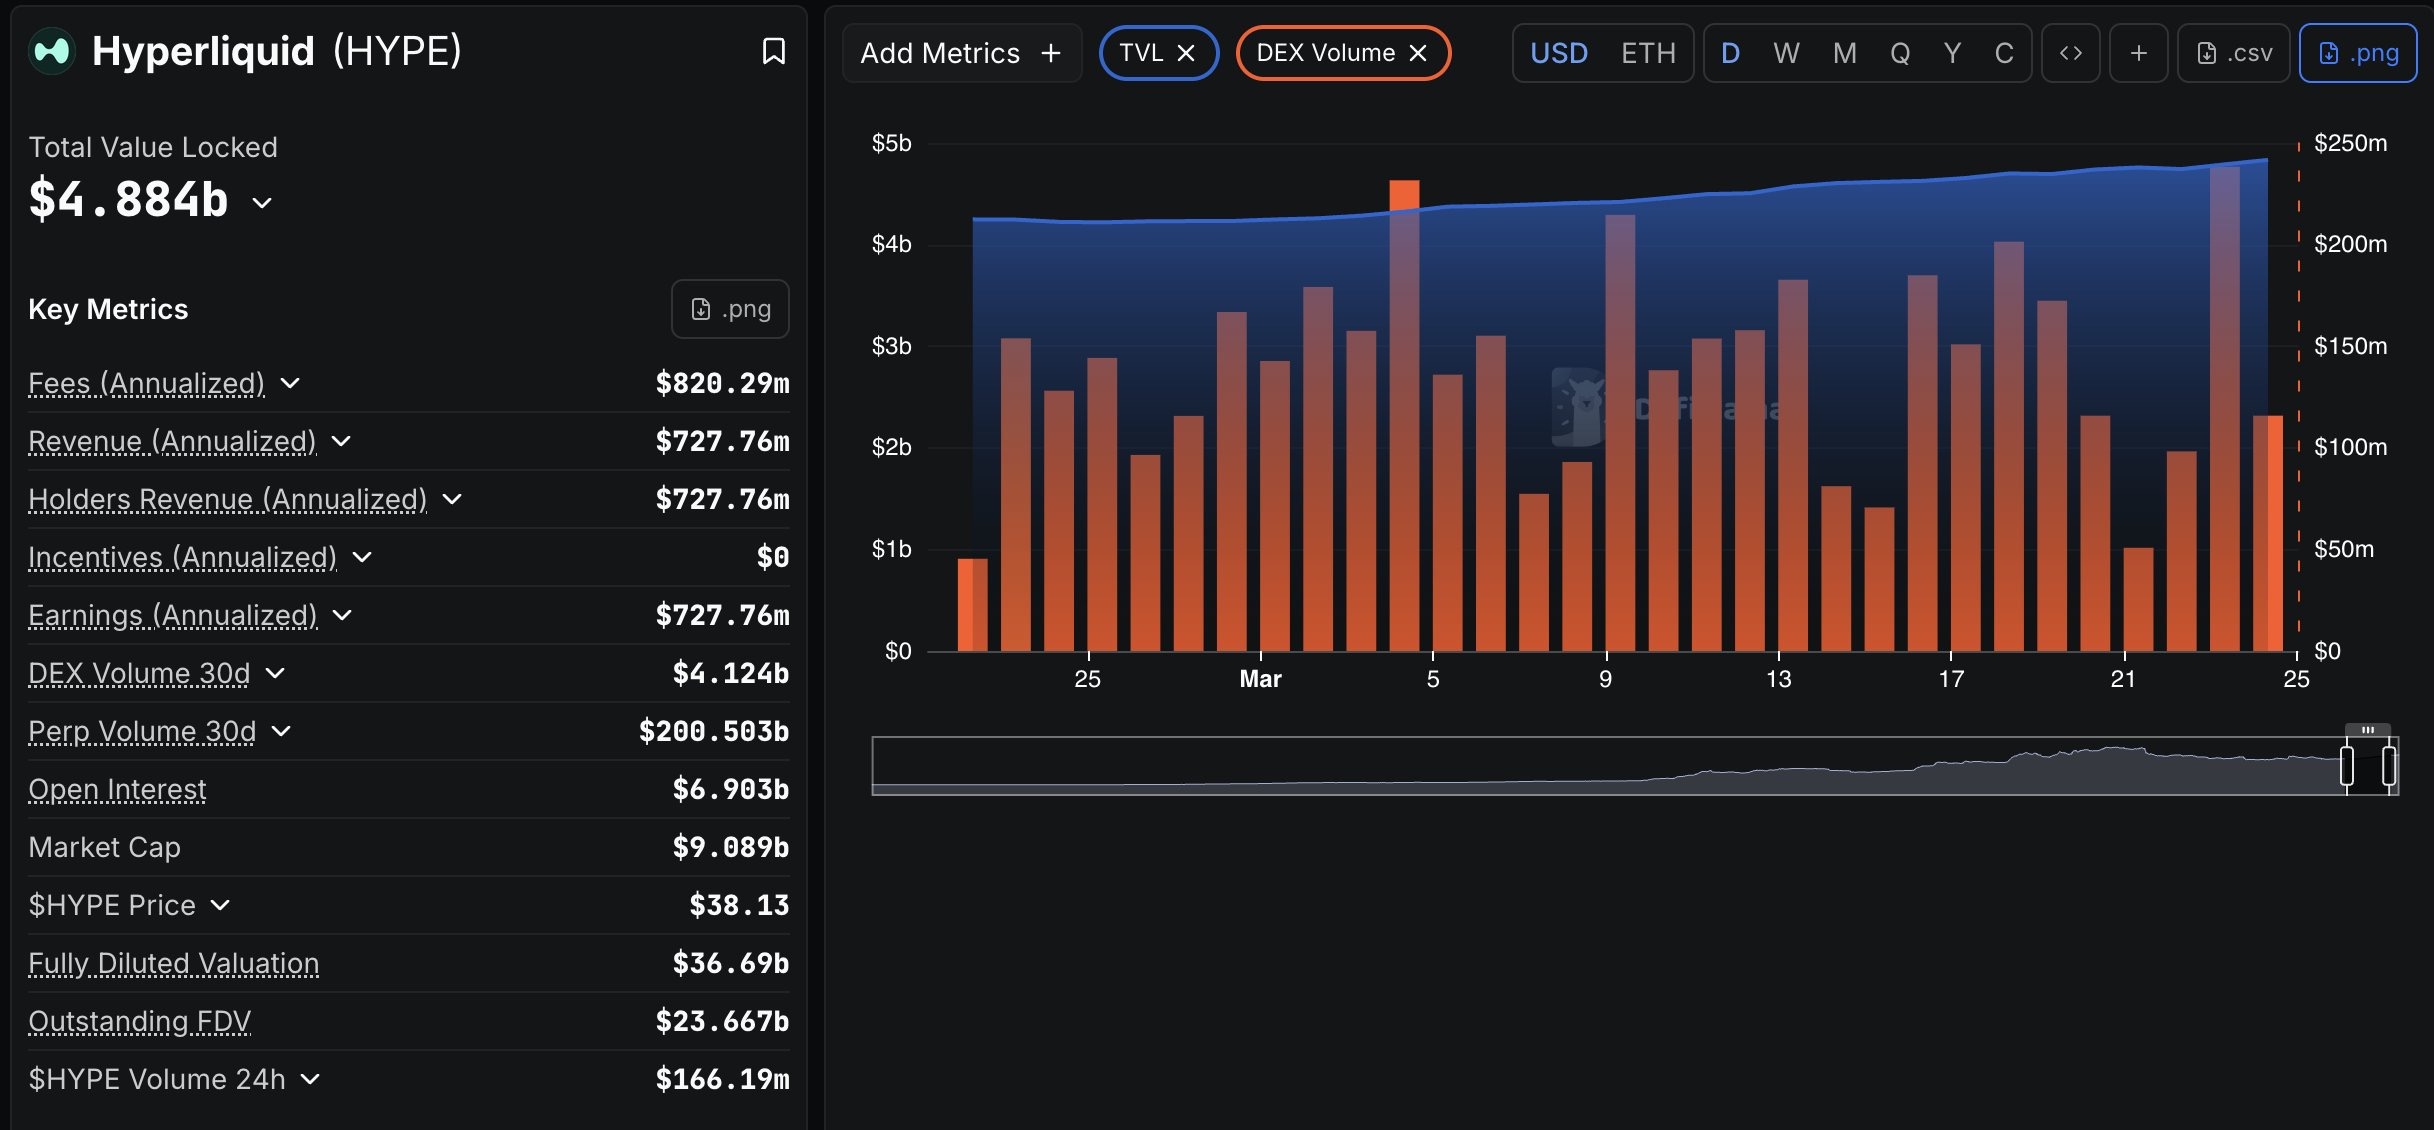
Hyperliquid is currently the largest on-chain perpetual contract DEX, with a TVL of $4.88 billion almost entirely in USDC. Its trading volume has a high cost of manipulation: every trade requires locking up USDC as margin, which has real capital costs; its open interest (OI) is also among the highest; gas and trading fees are unavoidable; everything is completely transparent on-chain, and every transaction can be audited.
After all, they are all exchanges, operating in the same field, trading similar assets, so user habits and capital efficiency should be similar as well. As Hyperliquid focuses on "contract trading," its capital utilization should be higher than that of CEX, hence Hyperliquid is used as the benchmark.
Our core method is to calculate the "daily trading volume / reserve ratio" for each exchange:
For specific theory see here:
Formula = 30-day total trading volume ÷ 30 ÷ core reserve assets (BTC+ETH+USDT+USDC)
Hyperliquid's total contract trading volume for the past 30 days is $206.8 billion (accurate data from DefiLlama API), with an average of $6.89 billion per day, corresponding to a TVL of $4.88 billion, resulting in a daily ratio of 1.44x.
This 1.44x represents the "ceiling of honest trading." Considering that CEXs have a more diverse use of funds than pure contract DEXs (including spot trading, wealth management, lending, etc.), we give CEXs a 15% margin of tolerance, raising the threshold to 1.66x.
2. Data Foundation: Calibration of Reserve Proofs from Various CEXs
Before reverse-engineering the trading volume, the reserve data must first be accurate—this is the denominator of the formula.
The following analysis uses official PoR data; the reserve ratios are as follows:
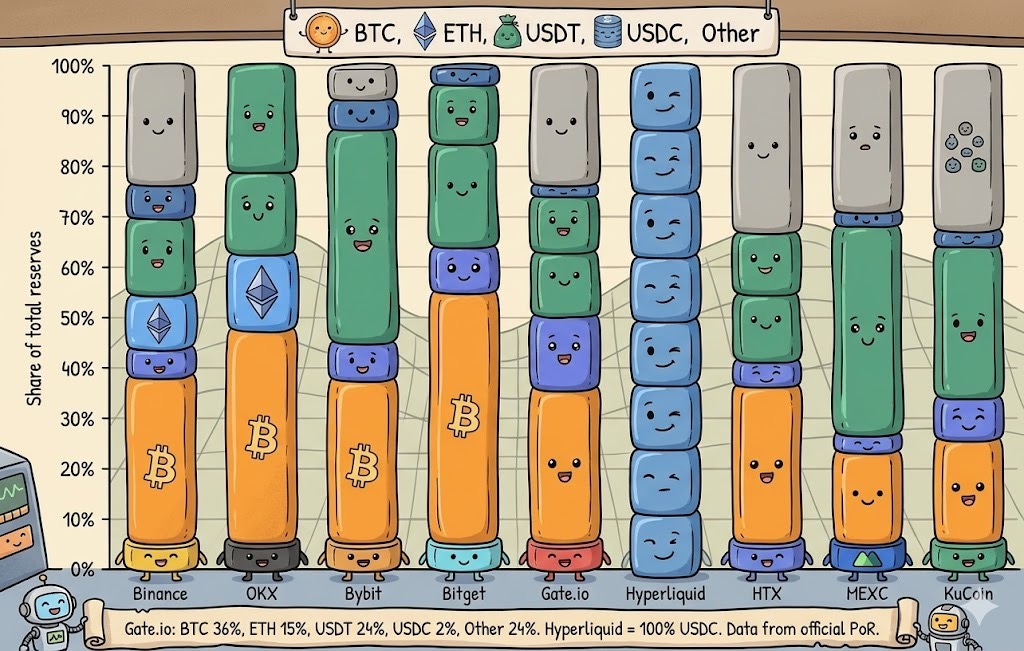
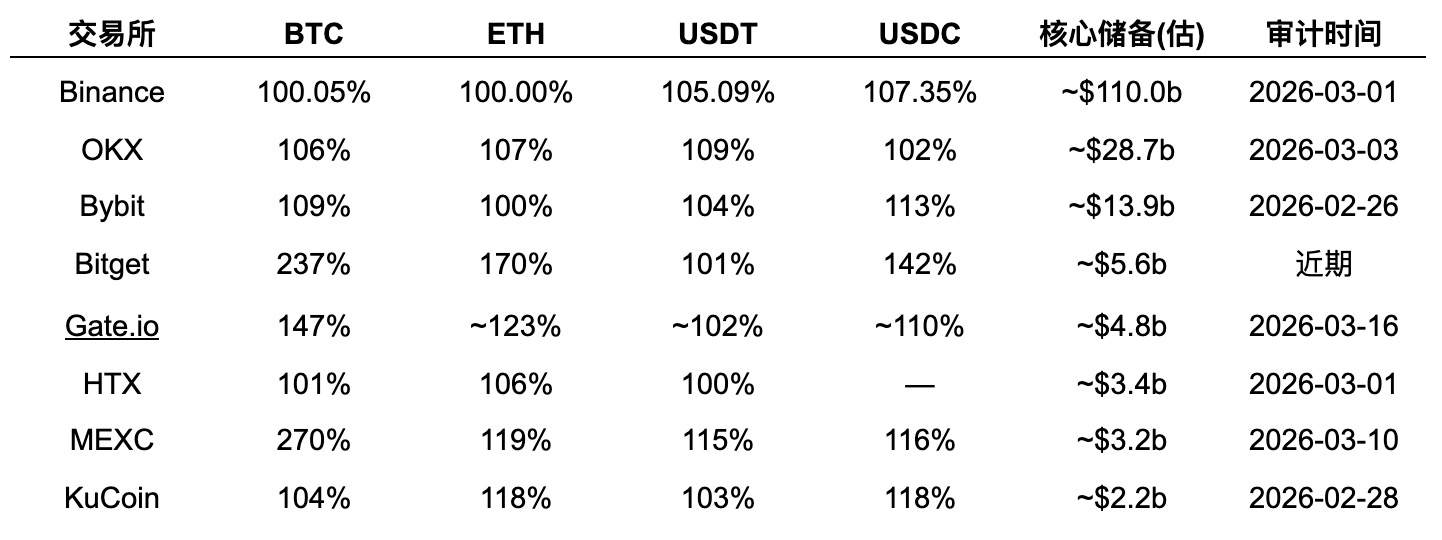
It is worth noting that Bitget (BTC 237%), MEXC (BTC 270%), and Gate.io (BTC 147%) hold far more BTC than user deposits. This is caused by the platform's own funds inflating the denominator, thus our analysis is actually more lenient towards them.
3. 30-Day Trading Volume Overview
Data sources
- Spot monthly trading volume: Newhedge (March 2026 data)
- Derivative monthly trading volume: Average of multiple snapshots from CoinGlass × 30 (marked as estimated)
- Hyperliquid: DefiLlama API 30-day data
- Hyperliquid: DefiLlama API 30-day data

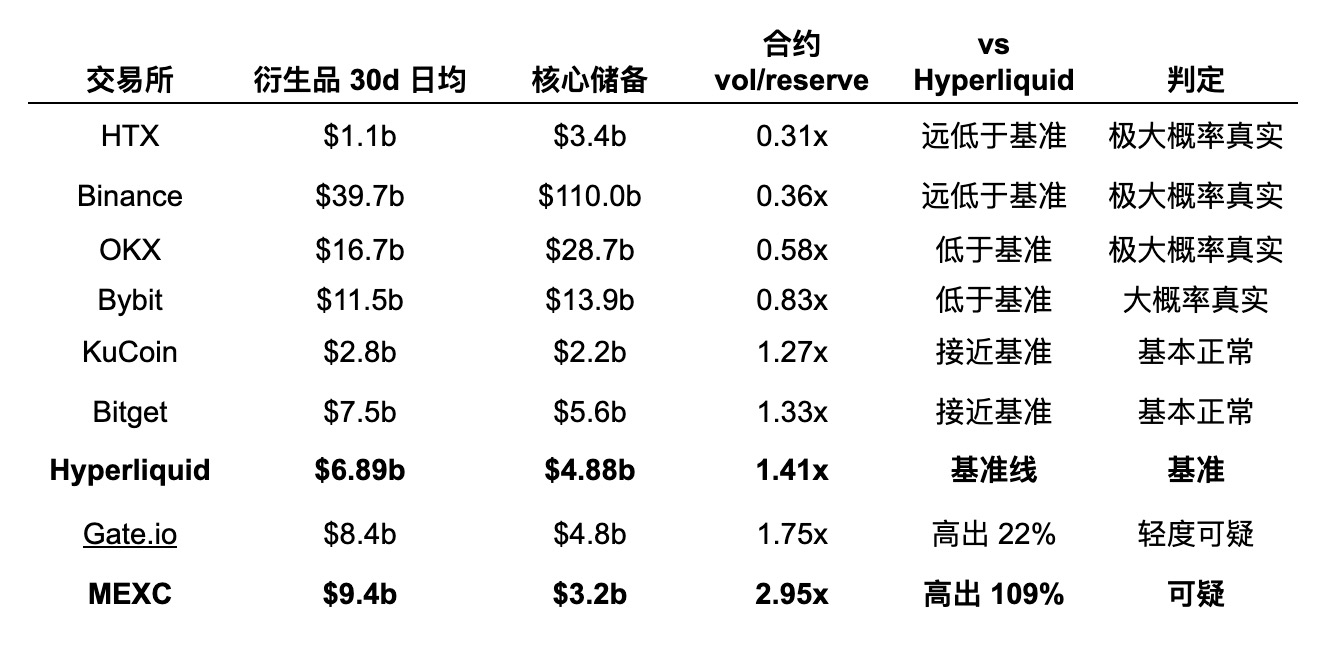
4. Breakdown of Contract Trading Volume
Contracts are the absolute main force behind CEX trading volume, and their authenticity directly determines the credibility of the total volume.
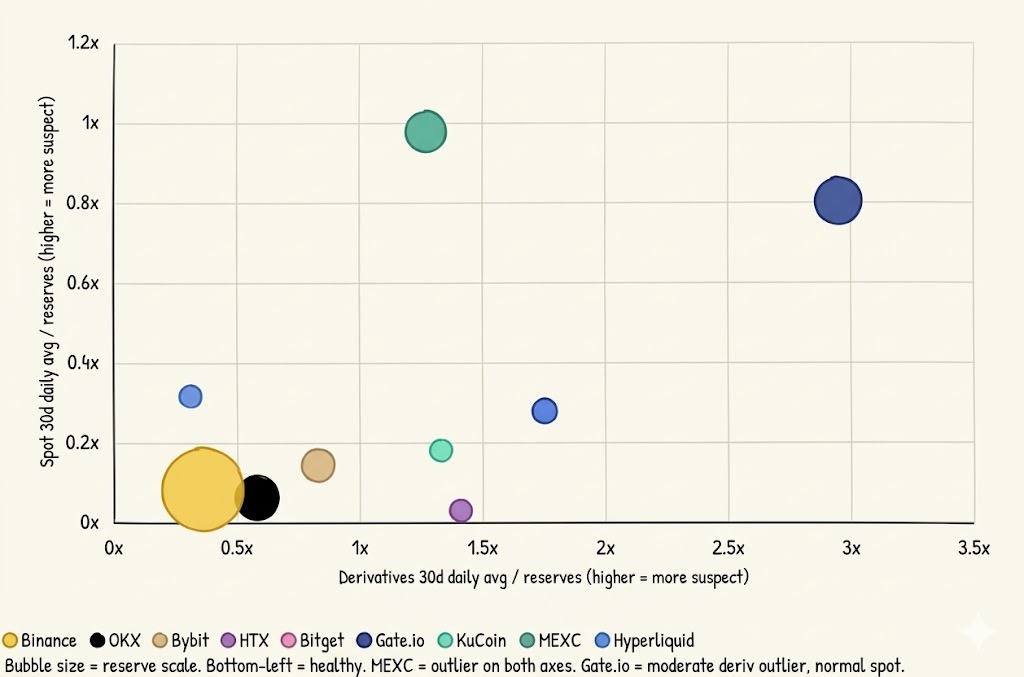
Contract vs Spot Two-Dimensional Anomaly Detection (Bubble Chart)
The contract trading volume at Binance is likely to be real. 0.36x is far below the on-chain benchmark—each $1 of reserves corresponds to only $0.36 of average daily contract trading volume. There are a large amount of "silent funds" on the platform, which is a typical sign of a healthy ecosystem.
Bitget and KuCoin are generally normal in terms of contracts. Both have contract ratios (1.33x and 1.27x) below the Hyperliquid benchmark.
Gate.io is in a gray area. The contract ratio of 1.75x exceeds the benchmark by 22%. Considering the 15% margin of tolerance (threshold of 1.66x), Gate.io is just over the line. However, Gate.io holds an excess reserve of 147% BTC, and proprietary trading may partially explain the elevated contract volume.
MEXC shows the strongest signals. A contract ratio of 2.95x is 2.1 times the Hyperliquid benchmark. (Later research indicates this may be due to MEXC's trading incentive activities)
5. Independent Signals of Spot Trading Volume
The 30-day spot data (from Newhedge) provides an independent verification dimension distinct from derivatives:
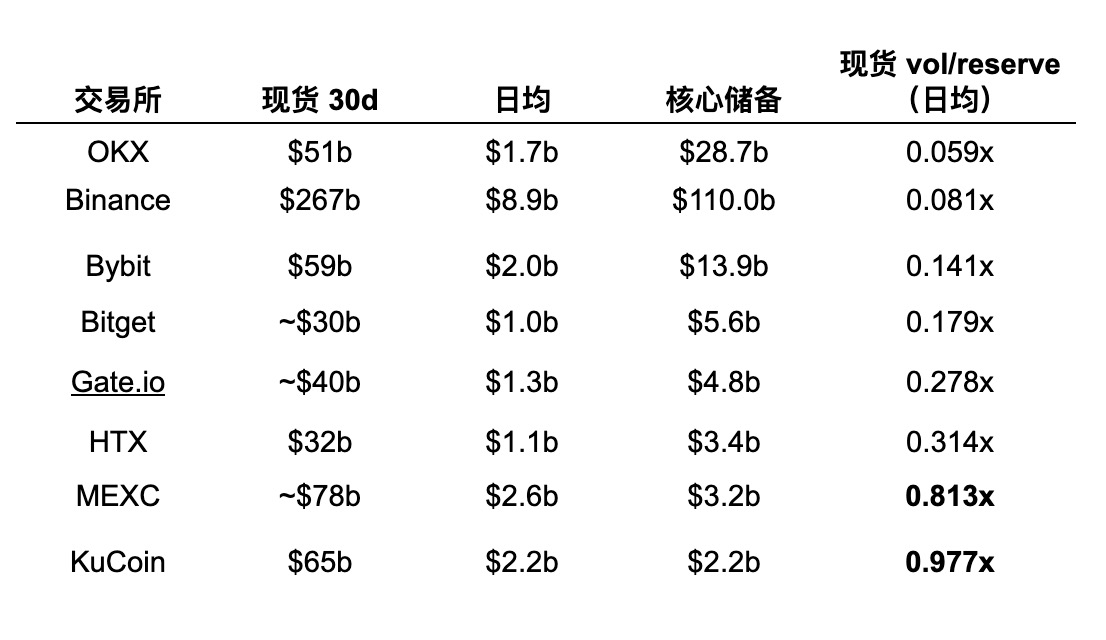
MEXC and KuCoin's average spot ratios (0.81x and 0.98x) are significantly higher than those of other exchanges.
Gate.io (0.278x) is within a reasonable range.
In comparison, Binance (0.081x) and OKX (0.059x)—the vast majority of funds are in a "precipitous" state, with users holding them for long-term or wealth management. This is precisely the form that large, mature exchanges should have.
6. Reverse-Engineering Real Trading Volume
For exchanges with a total average ratio exceeding the tolerance threshold (1.66x), we regard the excess part as "suspicious trading volume":
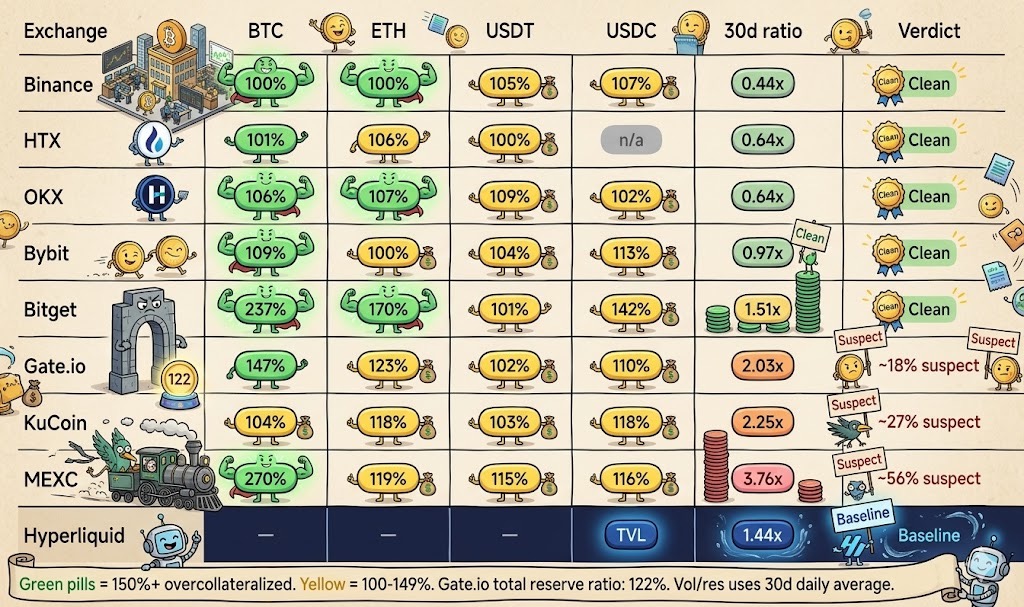
Reserve rate heat map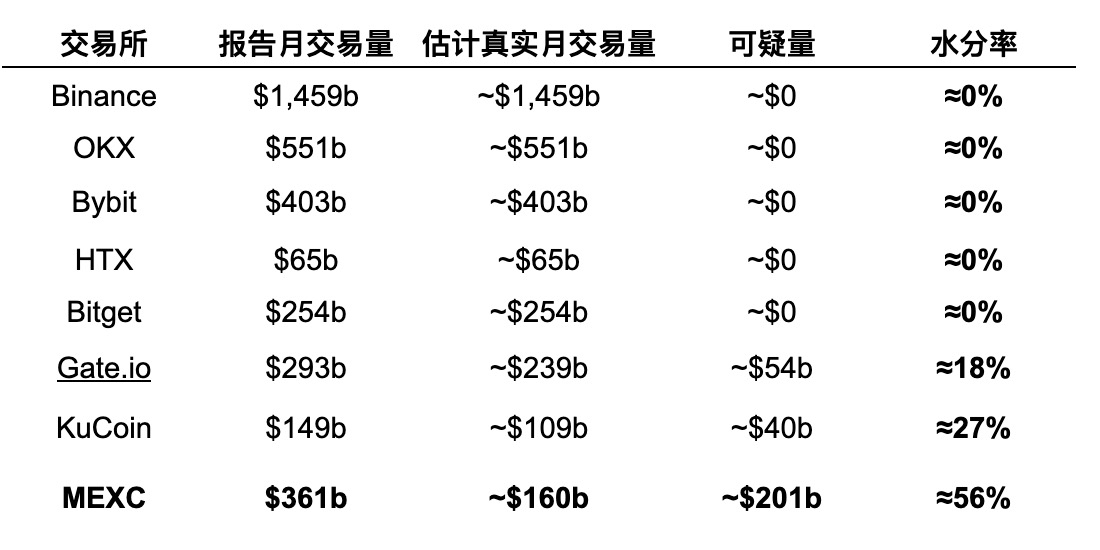
MEXC's monthly suspicious trading volume is approximately $201 billion. This means MEXC has about $6.7 billion of suspicious trading daily. (Later research indicates this may be due to MEXC's trading incentive activities)
KuCoin's inflation is concentrated in spot. The contract dimension is normal, but the monthly spot volume of $65 billion against a reserve of $2.2 billion is clearly high.
Gate.io has some mild suspicion of inflation. The contract ratio of 1.75x barely passes the threshold, while the total ratio of 2.03x is in the "attention zone." It is estimated that about $54 billion of monthly trading volume (approximately 18%) may be high.
Nevertheless, Gate.io's excess BTC reserve (147%) and 122% overall reserve rate indicate a healthy foundation—suspicion of inflation is more likely arising from market maker incentives rather than systematic fraud.
The trading volumes of Binance, OKX, Bybit, HTX, and Bitget are basically credible. All five have contract ratios below the Hyperliquid benchmark.
7. The Truth About CEX Market Share
Among the eight major CEXs, Binance's monthly market share is 39.1% ($1.459 trillion / $3.725 trillion). In recent years, there has been considerable talk about Binance "losing market share"—trading platforms like MEXC and Gate.io are quickly eating into it.
Note: This percentage does not represent the entire market's percentage, but rather the percentage in this report, which only samples these eight exchanges; actual conclusions will inevitably have errors!
However, if we exclude the suspicious trading volumes and recalculate:
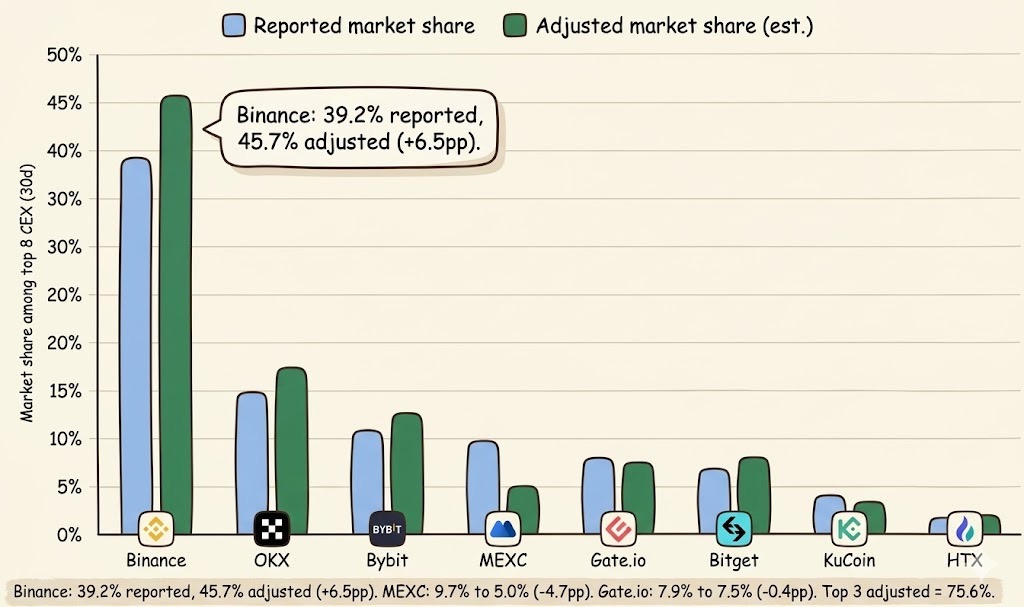
Market Share—Reported Value vs Adjusted
Binance’s true monthly market share is close to 46%. It is not that Binance is losing share, but that some competitors are creating the illusion of "catching up" with fictitious trading volume.
The top three together account for 76% of the real market. Binance (45.7%) + OKX (17.3%) + Bybit (12.6%) = 75.6%. The concentration of cryptocurrency trading is far higher than reported—head effects have been "diluted" by fictitious trading volumes.
MEXC's true share may be only 5%. The reported 9.7% has been cut almost in half.
Gate.io's adjustment is moderate (7.9% → 7.5%), indicating a relatively healthy performance among mid-sized exchanges.
8. Industry Impact
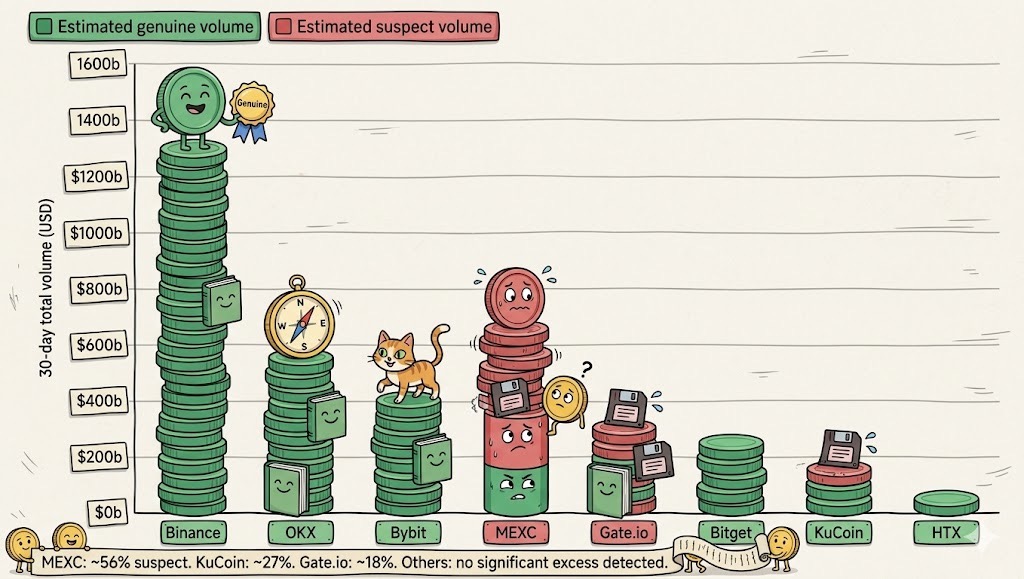
Real Trading Volume vs Suspicious Trading Volume (Monthly)
MEXC ~$201 billion + Gate.io ~$54 billion + KuCoin ~$40 billion = $295 billion/month of suspicious trading volume. If hundreds of small and mid-sized exchanges are also factored in, the overall monthly fictitious trading volume in the industry may be in the range of $350 billion to $450 billion.
For ordinary users: Do not be misled by "trading volume rankings." An exchange reporting a trading volume of $361 billion may have a real trading volume of only $160 billion. When choosing an exchange, look at the vol/reserve ratio, not absolute trading volume.
For project parties: When listing coins on exchanges, look at the actual order book depth rather than reported trading volume. More than half of the numbers in monthly reports may represent non-existent trades.
For regulatory agencies: The Hyperliquid benchmark method provides a reproducible quantitative detection tool. As on-chain exchange data accumulates, analysis over 30 days and 90 days will make fraud increasingly hard to hide.
9. Methodology and Limitations
The Hyperliquid benchmark may be relatively high. Pure contract platform user funds are entirely used for trading, so capital efficiency is naturally higher than CEX. 1.44x is likely a high benchmark for CEX, suggesting our estimates may be conservative.
Excess reserves blur the boundaries. The own funds of Bitget (BTC 237%), MEXC (BTC 270%), and Gate.io (BTC 147%) inflate ratios but do not equal volume manipulation.
Derivatives for 30 days are estimates. The 30-day derivative trading volume for CEX is derived from multiple snapshots by CoinGlass and is not precise historical data. The 30-day spot data comes from accurate monthly figures from Newhedge.
Reserve data comes from self-disclosure. If reserves are falsely reported, our ratios will be low, and suspicious trading volumes will be underestimated.
Conclusion: Four Numbers
0.44x — Binance's 30-day average trading volume / reserve ratio. Almost a "certificate of innocence." When the industry is plagued by false prosperity, Binance is the one who can stay firmly in first place without needing to inflate volumes.
56% — The possible inflated ratio in MEXC's reported monthly trading volume. A monthly trading volume of $361 billion against a reserve of $3.2 billion, with an average ratio of 3.76x, is 2.6 times the benchmark. About $201 billion of the monthly trading volume may be fictitious.
46% — Binance's adjusted true monthly market share. Superficially, it is only 39%, but stripping away the competitors' inflation shows that Binance's true dominance is nearly half of the market. Those exchanges claiming to be catching up with Binance are, in part, just chasing their own shadows.
76% — The total adjusted real monthly market share of the top three. This market is more oligopolistic than retail investors imagine—the false trading volume has long concealed this fact.
Postscript
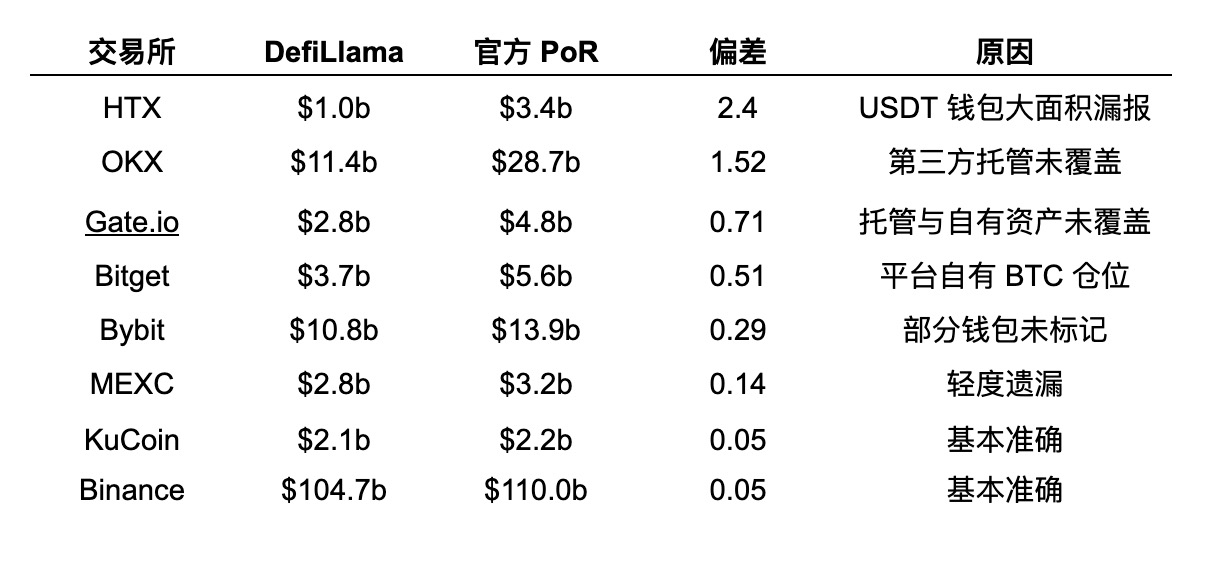
We initially used on-chain tracking data from DefiLlama, but after cross-validating with each exchange's official Proof of Reserves, we found significant deviations—DefiLlama generally underestimated reserves, with discrepancies ranging from 5% to 240%.
免责声明:本文章仅代表作者个人观点,不代表本平台的立场和观点。本文章仅供信息分享,不构成对任何人的任何投资建议。用户与作者之间的任何争议,与本平台无关。如网页中刊载的文章或图片涉及侵权,请提供相关的权利证明和身份证明发送邮件到support@aicoin.com,本平台相关工作人员将会进行核查。


