Hello everyone, I am Sister Qinglan! Welcome to Qinglan's Crypto Classroom. Today, we will use the TPV three-point verification trading system that I have polished for a long time to take a detailed look at the current Bitcoin market situation, packed with practical insights!
Step 1: First, look at the big picture (overview of multiple time frame trends)
Let's reveal the fundamentals across four time frames:
1-day line (long time frame): The closing price is 67109.09. The moving averages are in a bearish arrangement, MA5 is 66540.34, MA10 is 68218.07, MA30 is 69590.83. The price is struggling near MA5, with a distance from MA10 and MA30, the overall trend is relatively weak. The key resistance is the previous high at 67303.33, and support is the recent low at 66544.51. The on-chain sentiment is "extreme fear," with an index of only 11, this panic sentiment casts a shadow over the long time frame.
4-hour line (medium time frame): The closing price is 67109.09. The moving averages are intertwined, MA5 is 67153.27, MA10 is 66944.71, MA30 is 67254.94. The price is fluctuating between several moving averages, with an unclear direction. Resistance is at the previous high of 67303.33, and support is at the recent low of 66544.51. The news stating "Bitcoin breaks below the crucial support level of 67000 USD" refers to this level.
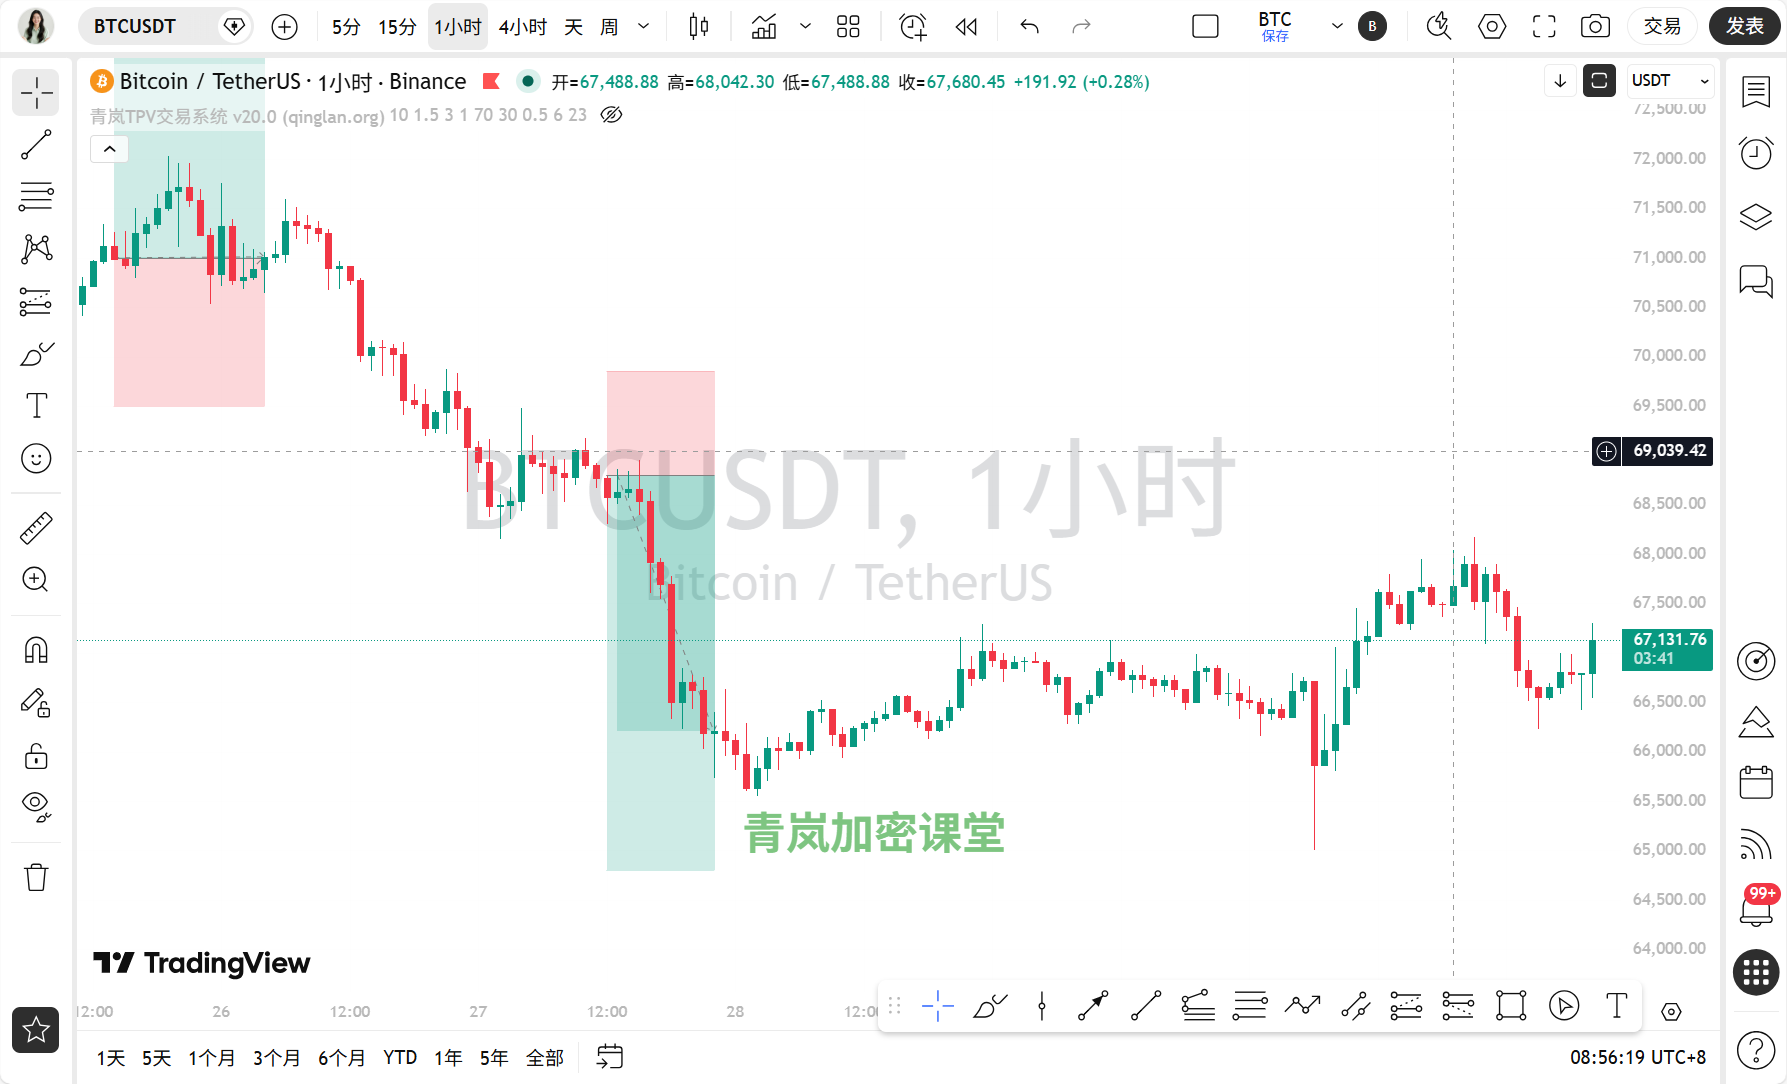
1-hour line (short time frame): The closing price is 67109.09. The moving averages are in a bearish arrangement, MA5 is 66830.43, MA10 is 66918.12, MA30 is 67051.73. The price just stands above MA5 and MA10, but is still below MA30. Resistance is at the previous high of 67303.33, and support is at 66653.46. Market sentiment is sluggish, but there are signs of a rebound.
15-minute line (ultra-short time frame): The closing price is 67109.09. The moving averages are in a bullish arrangement, MA5 is 66863.62, MA10 is 66795.86, MA30 is 66727.84. The price is above all moving averages, currently the strongest in the short term. Resistance is at the previous high of 67303.33, and support is at 66809.3.
To summarize: The long time frame daily line is still struggling in fear, but the short time frame 15-minute line has already shown strength, creating a situation where multiple time frames are conflicting, which requires careful distinction.
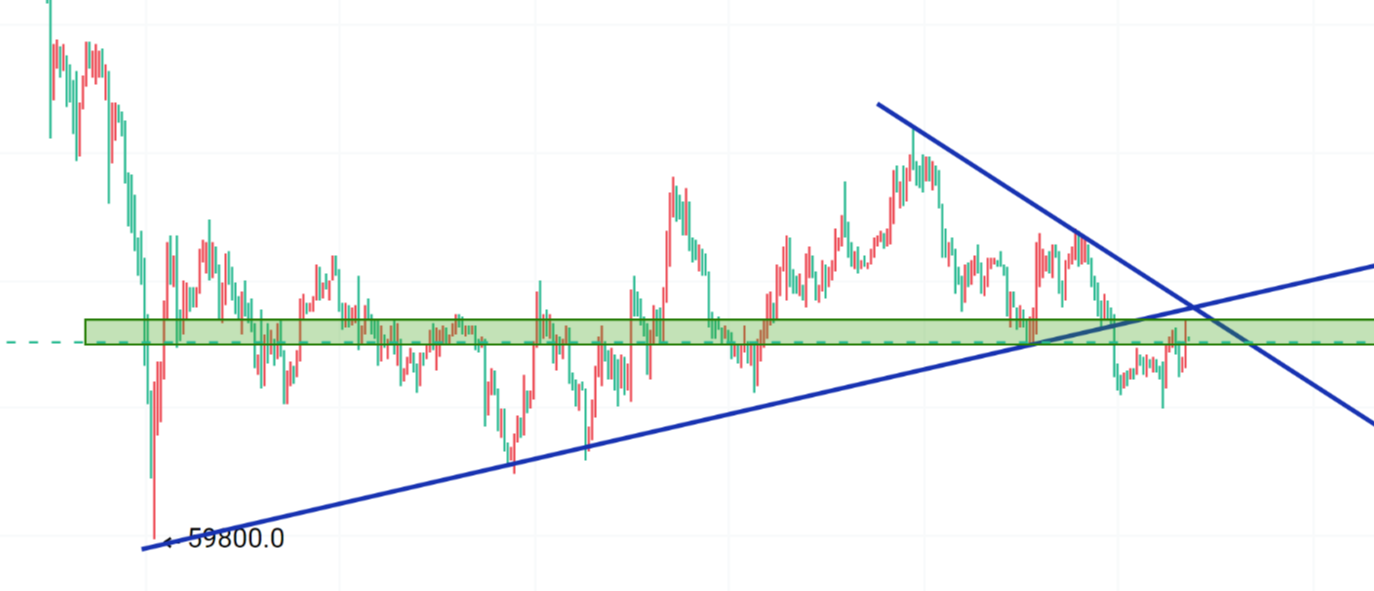
Step 2: Find the pivot point, draw key lines (valid highs and lows + trend lines)
Let's find the key turning points for each time frame:
1-day line: The valid high is 67303.33 (the highest price from the latest data), and the valid low is 66544.51 (the lowest price from the latest data). This low has just formed and needs confirmation from subsequent candles.
4-hour line: The valid high is also 67303.33, and the valid low is also 66544.51. A short-term support line can be drawn upwards from the low point, which has been touched only once so far.
1-hour line: Valid high is 67303.33, valid low is 66653.46. This low has been tested multiple times, providing some support.
15-minute line: Valid high is 67303.33, valid low is 66809.3. This low is also a position that has been tested recently.
The news repeatedly mentions "breaking below the crucial support of 67000 USD," this 67000 is right near the key pivot point area of our 1-hour and 4-hour cycles, indicating the real impact of news on technical levels.
Step 3: Indicators for assistance (technical indicators verification)
Let's see what the indicators say:
15-minute: The MACD histogram is 54.73, DIF is -13.82, DEA is -68.55, no golden or dead cross, but green bars indicate short-term momentum is upwards. RSI is 58.78, neutral to strong, confirming the short-term rebound.
1-hour: MACD histogram is -72.74, DIF is -37.11, DEA is 35.63, no cross, green bars are turning red but still below the zero axis, indicating weak momentum. RSI is 43.48, neutral to weak, slightly diverging from the weakness of the price rebound, casting doubt on the rebound strength.
4-hour: MACD histogram is 160.67, DIF is -354.50, DEA is -515.18, no crossover, but green bars are expanding, showing that the downward momentum may be weakening. RSI is 51.71, neutral, with no clear direction.
1-day line: MACD histogram is -474.14, DIF is -796.10, DEA is -321.96, in a dead cross state and long green bars indicate strong bearish momentum. RSI is 30.91, close to the oversold zone, indicating the drop has been quite severe.
Indicator summary: Small time frame indicators support a rebound, but large time frame indicators remain very weak, this divergence needs to be taken seriously.
Step 4: Comparing bulls and bears (news + on-chain)
News aspect:
Bearish factors: Many headlines state "Bitcoin breaks below the key support level of 67000 USD," "Crypto Fear Index over 70 days warning signal," "U.S. stocks and crypto-related stocks in widespread decline," and discussions by Federal Reserve officials on balance sheet reduction, inflation, energy shocks, and other uncertainties are dampening the market.
Bullish factors: There are also potentially good news such as "Market sentiment shifts suddenly: Fed interest rate hike bets withdrawn, rate cut expectations rise," and "BlackRock deposits over 270 million USD in BTC and ETH to Coinbase."
Core factors: The most important fact is the statement of "Bitcoin breaking below key support," and the distant hope of "Fed rate cuts." The technical and news aspects seem to be conflicting here: the technical aspect is that the small time frame is rebounding, but the news aspect is leaning bearish.On-chain data:
The Fear and Greed Index is only 11, positioned in the "extreme fear" category, indicating very pessimistic market sentiment. The dominance of BTC is 56.18%, showing that funds remain in Bitcoin and haven’t flowed out much. The total market capitalization is 2.387 trillion USD, with a 24-hour change of 0.8%, slightly up. On-chain data (extreme fear) and the large time frame technical setup (bearish arrangement) are resonating, both pointing to weakness. However, it diverges from the small time frame (15-minute rebound).
Step 5: The path of least resistance (trading strategy)
In summary, the large time frame is downward, while the small time frame is rebounding, but the rebound faces strong pressure from the large time frame moving averages and the previous high of 67303.33. Market sentiment is extremely fearful, which will limit the height of the rebound. Therefore, the current path of least resistance may not be a one-sided upward trend but a situation where the rebound meets resistance and falls again.
Key entry area: If shorting, consider looking for signals in the 67200-67300 zone (near the previous high of 67303.33). If going long, the price needs to strongly break through 67303.33 and remain stable.
Stop-loss basis: Short positions should have stop losses slightly above 67303.33; long positions should have stop losses below the key support of 66544.51.
Target area: If it declines, the primary target is 66600-66700 (1-hour support area), further looking at 66544.51.
Step 6: How will today go (market prediction)
Current (within the next few hours): The ultra-short term may fluctuate between 67000-67300, attempting to test the pressure at the previous high of 67303.33.
Key today and in the near future: The most important resistance level today is 67303.33, this is the watershed for bulls and bears. The most important support levels are 66653.46 (1-hour low) and 66544.51 (daily and 4-hour low).
Trading thought process: Given the weak large time frame and the extreme fear sentiment, the more appropriate approach currently is to "short on strength." This means considering light positions for shorting when the price rebounds near the resistance level of 67303.33 and shows signs of stagnation, aiming for a potential return. The rationale is that the overall environment is too weak, and the rebound may just be a "dead cat bounce."
Summary: The core contradiction in the current market is: can an oversold rebound, under extreme fear sentiment, reverse the downward trend of the large time frame.
Trading motto: While searching for the faint light of a rebound under the shadow of "extreme fear," do not forget that once the "key support" is broken, it will turn into the heaviest "resistance shackles" on the rebound path.
[Qinglan TPV trading system backtest data]
Based on nearly 462 historical backtests (sample size 484), the accuracy rate is 70.8% (last backtest time 03-30 21:52:36). The backtest results are for strategic confidence reference only; past performance does not represent future returns.
[Qinglan's personal opinion]
Oh, looking at this data, I feel quite emotional. The current market sentiment is as cold as an ice cellar, but on the surface, the smaller levels are secretly rebounding. My feeling is that this rebound is more like a technical correction, giving those who haven't escaped a second chance, rather than the beginning of a trend reversal. Until the fear index returns to neutrality, any upswing requires extra caution. When we trade, we cannot just focus on the rise and fall of the past few minutes, but must pay more attention to the face of the large time frame and the market. Remember, in a downward trend, catching a rebound is like licking blood on a knife's edge, it requires quick entry and exit, with discipline as the priority!
This TPV system is something I have honed over the years by watching the market, reviewing trades, and practical experience. I can't say it's 100% accurate, but at least it can give us more confidence at critical positions. If you want to get the latest entry opportunities captured by my TPV system immediately, welcome to visit the Qinglan Crypto Classroom official website www.qinglan.org
免责声明:本文章仅代表作者个人观点,不代表本平台的立场和观点。本文章仅供信息分享,不构成对任何人的任何投资建议。用户与作者之间的任何争议,与本平台无关。如网页中刊载的文章或图片涉及侵权,请提供相关的权利证明和身份证明发送邮件到support@aicoin.com,本平台相关工作人员将会进行核查。