Wave Riding in the Currency Sea: 4.2 Cryptocurrency Market Bitcoin (BTC), Ethereum (ETH) Latest Market Analysis Reference and News Interpretation for Tonight
Wave Riding in the Currency Sea: 4.2 Bitcoin (BTC) Market Analysis Reference:
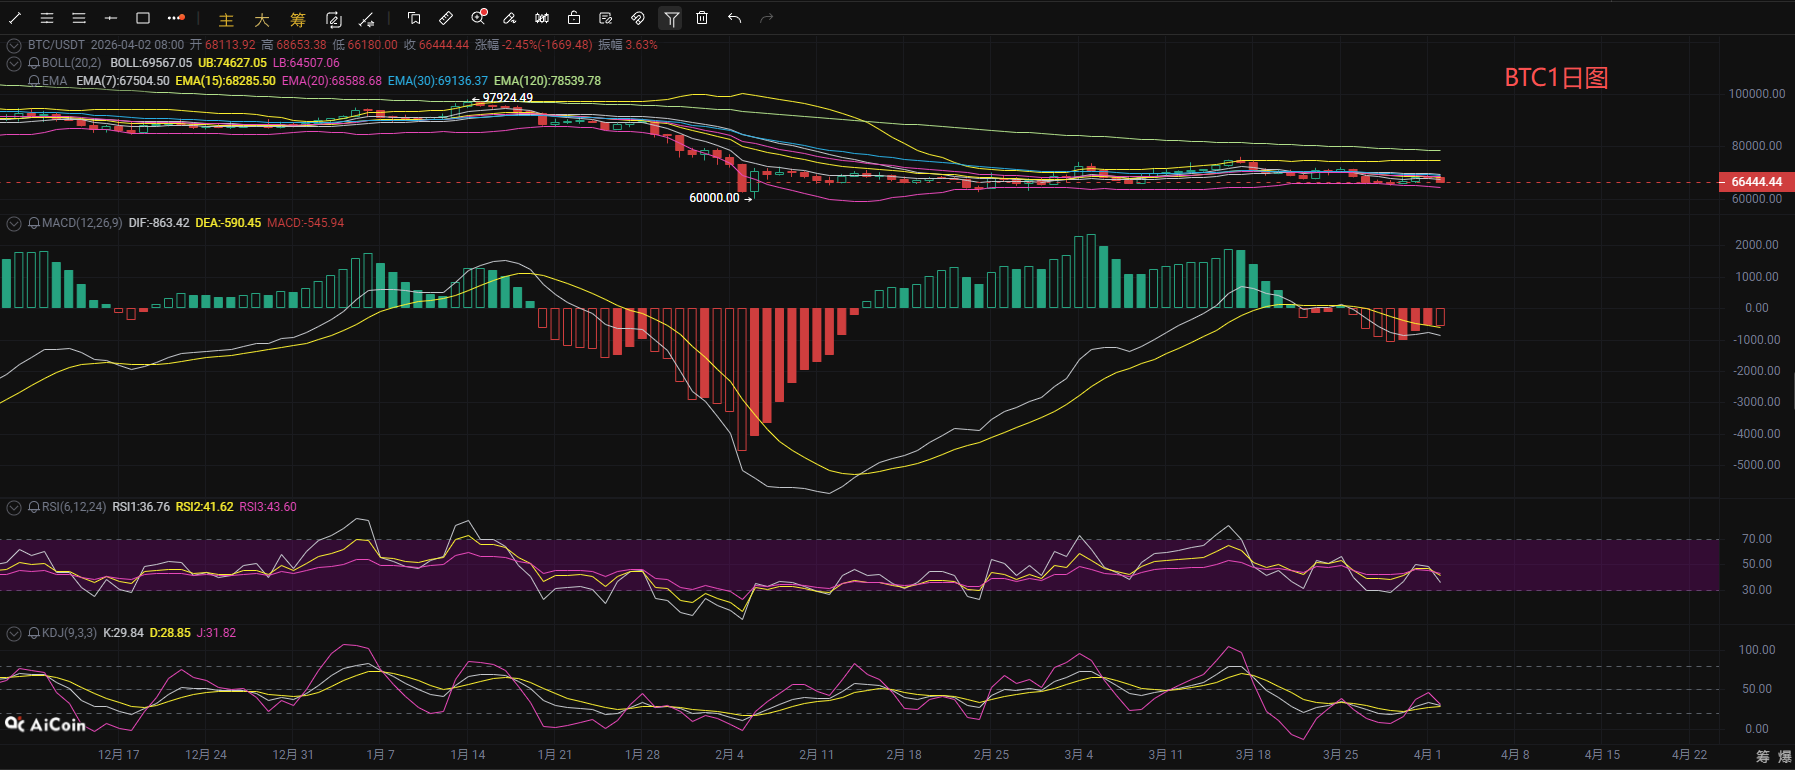
Bitcoin tested the upper strong pressure zone but failed to achieve an effective breakout, with bullish momentum gradually diminishing, and the market subsequently shifted into a period of consolidation; this morning, the price weakened again, continuously retreating from the previous highs. From the daily chart perspective, the current price is running around 66500, having broken below the EMA moving average. The Bollinger Bands are gradually narrowing, with the price running close to the lower band, and the MACD indicator shows both lines below the zero axis, with bearish momentum evident in the histogram, reflecting insufficient rebound support; the RSI indicator is reading in the weak area around 40, not yet entering the oversold zone, indicating limited potential for short-term rebound repair; in the KDJ indicator, the J-value is about to cross below the KD line, gathering short-term bearish momentum. Overall, the downward risk remains, and it is recommended to maintain short-term trading, taking short positions at high levels, while implementing defensive measures and patiently waiting to enter long positions at lower levels.
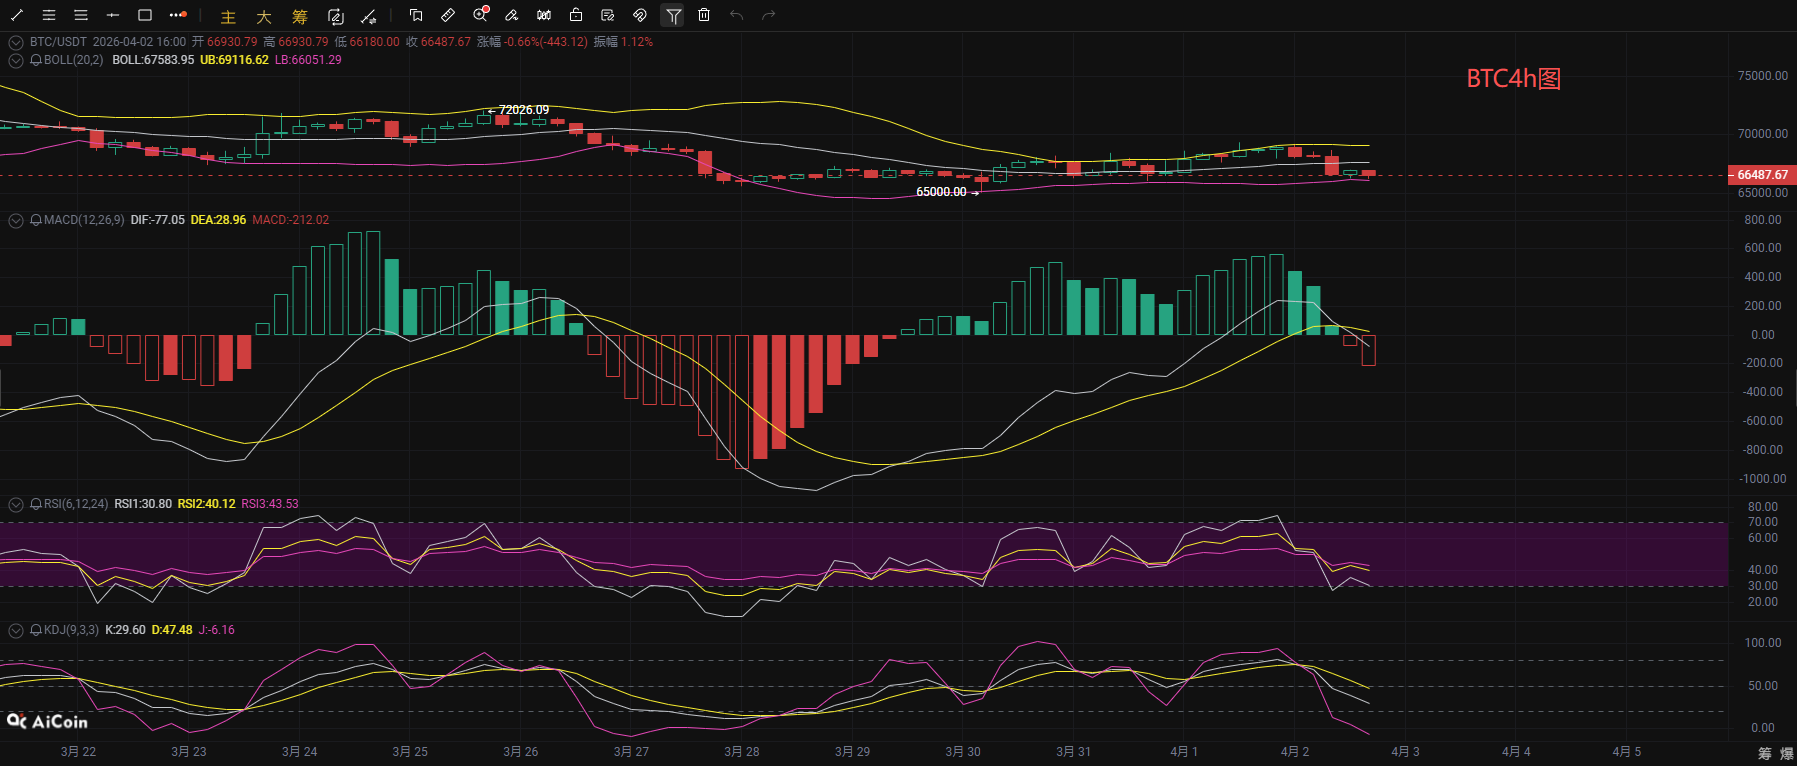
From the BTC 4-hour chart, the current price is fluctuating around 66500, facing short-term pressure below the 67500 mark, overall in a weak consolidation pattern. The moving average system is showing a bearish arrangement, with short-term moving averages such as EMA7 and EMA15 obviously suppressive from above, and the price continuously running below the moving averages, with the long-term EMA120 setting up mid-term pressure and a lack of counterattack momentum from the short-term bulls. The MACD indicator shows a death cross with a downward divergence, and the bullish histogram's momentum is waning. Both the RSI and KDJ have significantly declined into the low range, and the indicator repair pace is slow, leading to only slight technical rebound space in the short term; however, the moving averages and indicators show weak resonance, making it difficult to trigger a sustained rebound. The overall market structure remains under bearish control with substantial downward risks ahead, focusing on the support strength at the 66000 level; if effectively breached, it will further probe into the 65000 level. All currency friends are advised to prepare for risk management in advance.
Wave Riding in the Currency Sea: 4.2 Bitcoin Short-term Reference:
Long Position: Buy in the range of 64500-65500, stop loss at 500 points, target at 66000-67500,
Short Position: Sell in the range of 78500-77500, stop loss at 500 points, target at 66500-65500,
Wave Riding in the Currency Sea: 4.2 Ethereum (ETH) Market Analysis Reference:
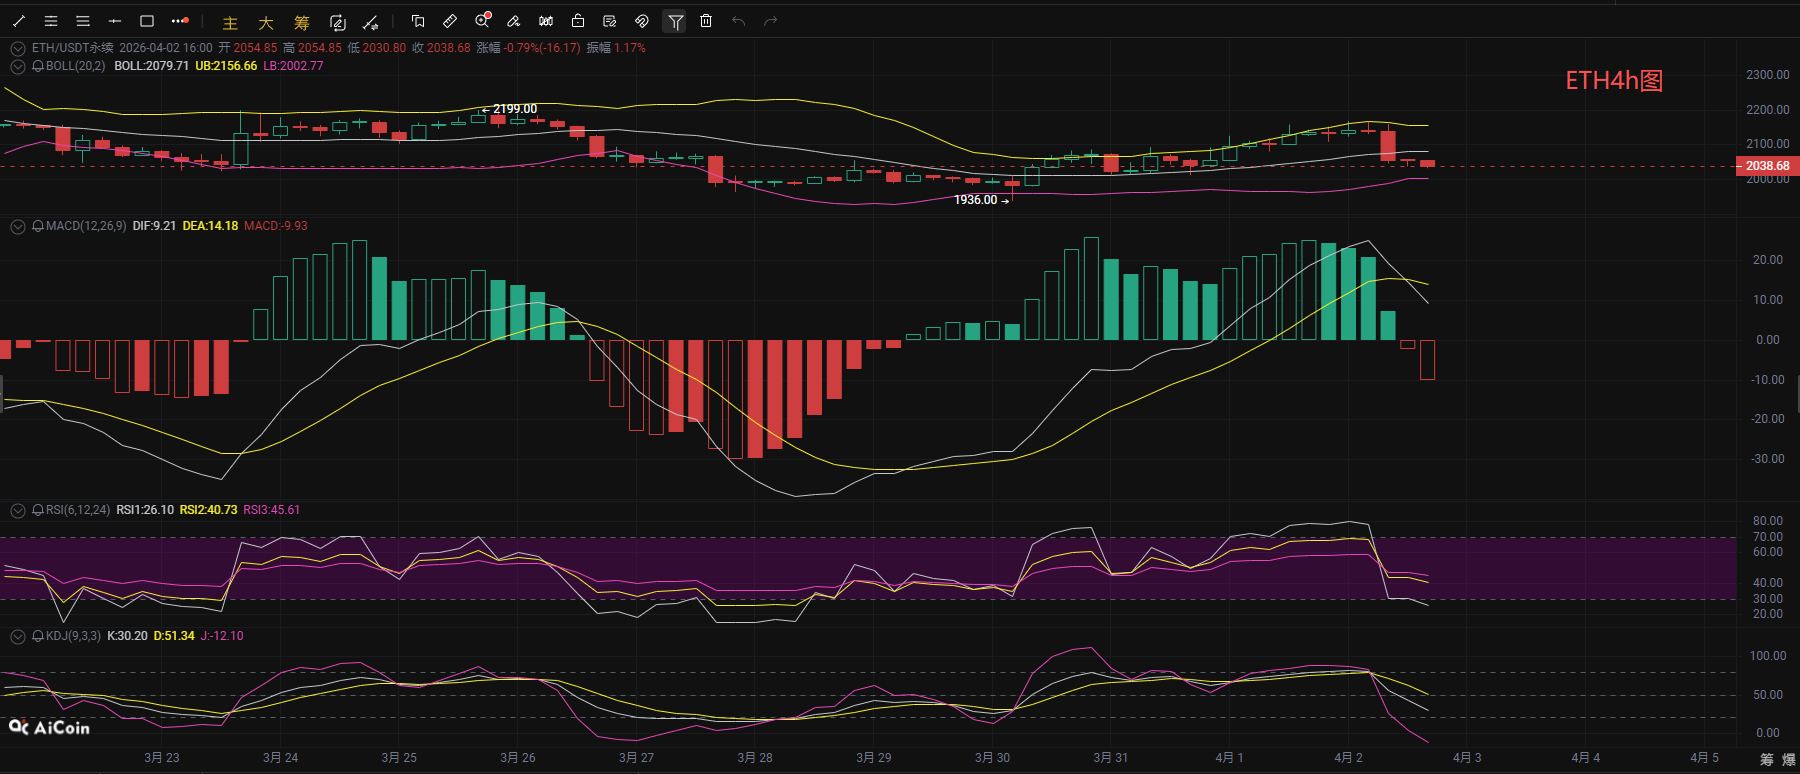
Observing Ethereum from the 4-hour cycle, the Bollinger Bands are opening downward, with the price breaking below the middle band and approaching the lower band, indicating a mid-term bearish trend; the MACD shows a death cross, KDJ is deeply oversold, and the RSI's three lines are quickly dropping, continuing to release bearish momentum with clear mid-term downward pressure. In the 1-hour cycle, the Bollinger Bands are also opening downward, with MACD's two lines diverging sharply downward and the volume gradually reducing. The RSI's three lines have all dropped below 40, while KDJ indicator lines K, D, and J are concurrently diverging downward, with the J value having dropped to 1.22, maintaining an oversold state, indicating short-term technical rebound demand, but no reversal signals are present. The two major cycles create a resonance of bearish sentiment, placing Ethereum overall in a downward channel, with core support at the 2000 mark and the previous low at 1936; trading should primarily focus on short positions, remaining vigilant against breaking downward risks.
Wave Riding in the Currency Sea: 4.2 Ethereum Short-term Reference:
Short Position: Sell in the range of 2120-2080, stop loss at 30 points, target at 2050-1980,
Long Position: Buy in the range of 1960-2010, stop loss at 30 points, target at 2030-2090,
[The above analysis and strategies are for reference only. Risks are to be borne by yourself. The article may have delayed publication or lack timely strategies, so do not operate blindly.]

This article is originally shared by [Wave Riding in the Currency Sea] and represents only personal opinions. The article may have delays in sending and is for reference only; do not operate blindly! Want to get more daily real-time trades? Then follow my public account! Here, you can engage in online technical learning and understand exit strategies related to release. I have many years of research experience in the market, focusing on the major trends in the cryptocurrency space. Mainly responsible for analyzing and guiding investment operations for BTC, ETH, SOL, BCH, and other coins. Welcome to study and research together.
免责声明:本文章仅代表作者个人观点,不代表本平台的立场和观点。本文章仅供信息分享,不构成对任何人的任何投资建议。用户与作者之间的任何争议,与本平台无关。如网页中刊载的文章或图片涉及侵权,请提供相关的权利证明和身份证明发送邮件到support@aicoin.com,本平台相关工作人员将会进行核查。