What to know : Long term holders now control around 80% of bitcoin supply, approaching the 85% level historically seen at bear market bottoms. Even if a price floor is forming, past cycles suggest months of sideways, range bound trading are likely before a sustained recovery begins
The two things most cryptocurrency investors are pondering are how much lower can bitcoin go and how much longer this bear market could last.
The price pain aspect has been discussed widely, but the time-based dimension is another question in itself.
Price pain refers to sharp drawdowns or volatility that force participants out of positions, while time pain reflects slow, range-bound conditions that exhaust both bulls and bears through lack of direction.
Bitcoin is currently trading below $66,000, down over 3% in the past 24 hours and roughly 45% below its October all-time high, an almost six-month bear market.
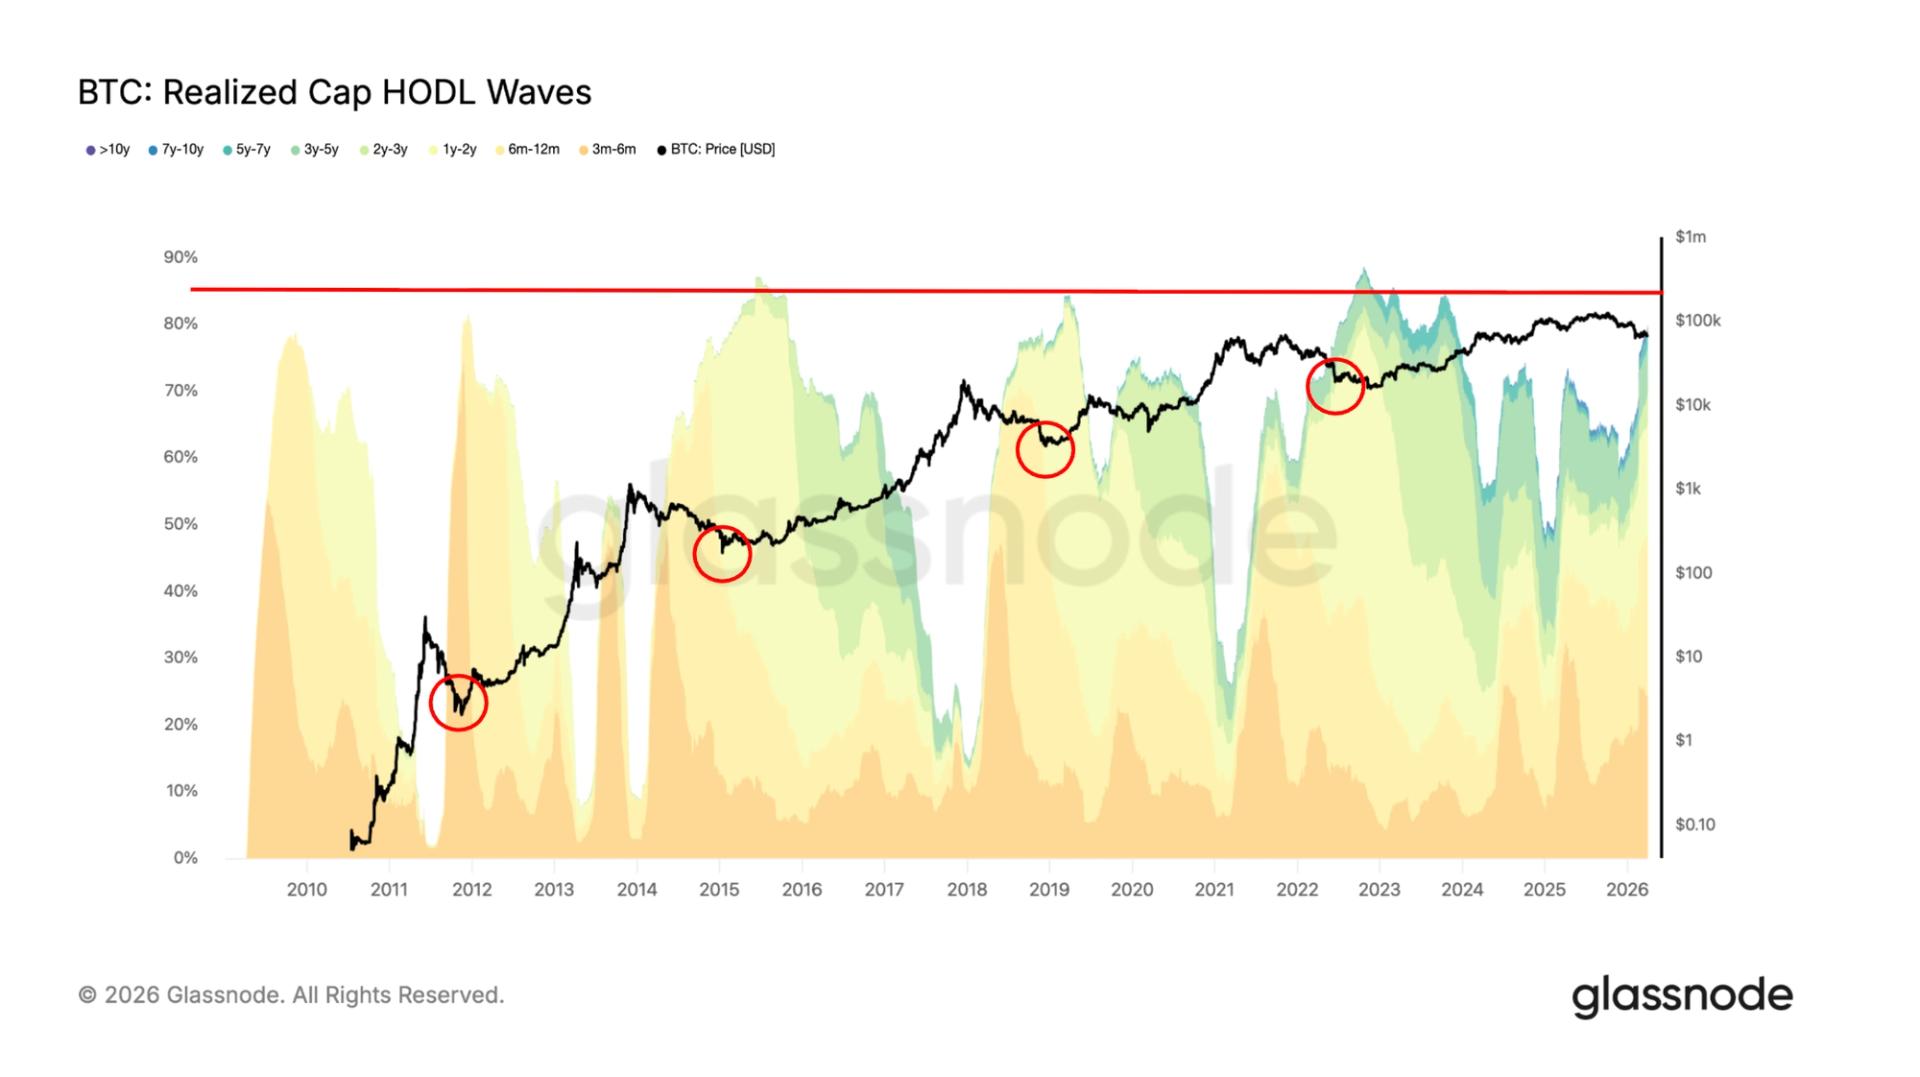
One indicator pointing toward continued time pain is the Realized Cap HODL Waves from Glassnode. This metric groups bitcoin supply by the last time coins moved, with each band representing different holding periods, and weights them by realized price, the average price at which coins last transacted on chain.
Historically, bear market bottoms have coincided with long-term holders, those holding for six months or more, controlling at least 85% of supply. Typically, price bottoms form first, and only several months later does long-term holder supply approach these high levels, indicating these investors bought at depressed prices and held through the bear market.
Currently, long term holders account for about 80% of supply. If this trend continues, the market may be nearing a bottoming phase, though several months of consolidation are likely still ahead.
免责声明:本文章仅代表作者个人观点,不代表本平台的立场和观点。本文章仅供信息分享,不构成对任何人的任何投资建议。用户与作者之间的任何争议,与本平台无关。如网页中刊载的文章或图片涉及侵权,请提供相关的权利证明和身份证明发送邮件到support@aicoin.com,本平台相关工作人员将会进行核查。


