Original Source: CoinGlass
1. Summary and Key Findings
In the first quarter of 2026, the cryptocurrency market as a whole maintained a high level of activity, but the trading volume gradually retreated from the January peak. The overall market spot trading volume was approximately $1.94 trillion, and the derivatives trading volume was about $18.63 trillion, totaling around $20.57 trillion, with a derivatives-to-spot trading ratio of about 9.6 times. Structurally, market activity was still mainly concentrated in the derivatives market, with a relatively larger contraction in spot trading.
In terms of core indicators, Binance continued to maintain its industry leadership. Derivatives trading volume was about $4.90 trillion, corresponding to a market share of about 34.9% under the Top 10 exchanges criteria; average daily open interest was about $23.9 billion, with a corresponding share of about 29.9%; user asset deposits were approximately $152.9 billion, accounting for about 73.5% under the main CEX criteria. Compared with the second place, Binance's derivatives trading volume was about 2.2 times that of OKX, average open interest was about 2.2 times that of Bybit, and user asset scale was about 9.6 times that of OKX. The data reflects that Binance's lead is not concentrated in a single dimension but is simultaneously reflected in trading volume, open interest, liquidity, and fund retention across four dimensions.
From the perspective of the Top 5 competitive landscape, the market has formed a relatively clear hierarchical structure. In terms of derivatives trading volume, Binance, OKX, Bybit, Gate, and Bitget ranked in the top five respectively, with Bybit and Gate being close in size, and OKX remaining the centralized platform closest to Binance; in terms of open interest, the order of the second tier changed to Bybit, Gate, OKX, and Bitget. In terms of user asset deposits, only OKX maintained a level above $10 billion after Binance, while Gate, Bitget, and Bybit were in the $5 billion to $7 billion range. Overall, competition within the Top 5 is relatively intense, but there is still a considerable gap between leading platforms and subsequent tiers.
2. Spot and Derivatives Trading Volume
2.1 Overview of Monthly Trading Volume in the Entire Market
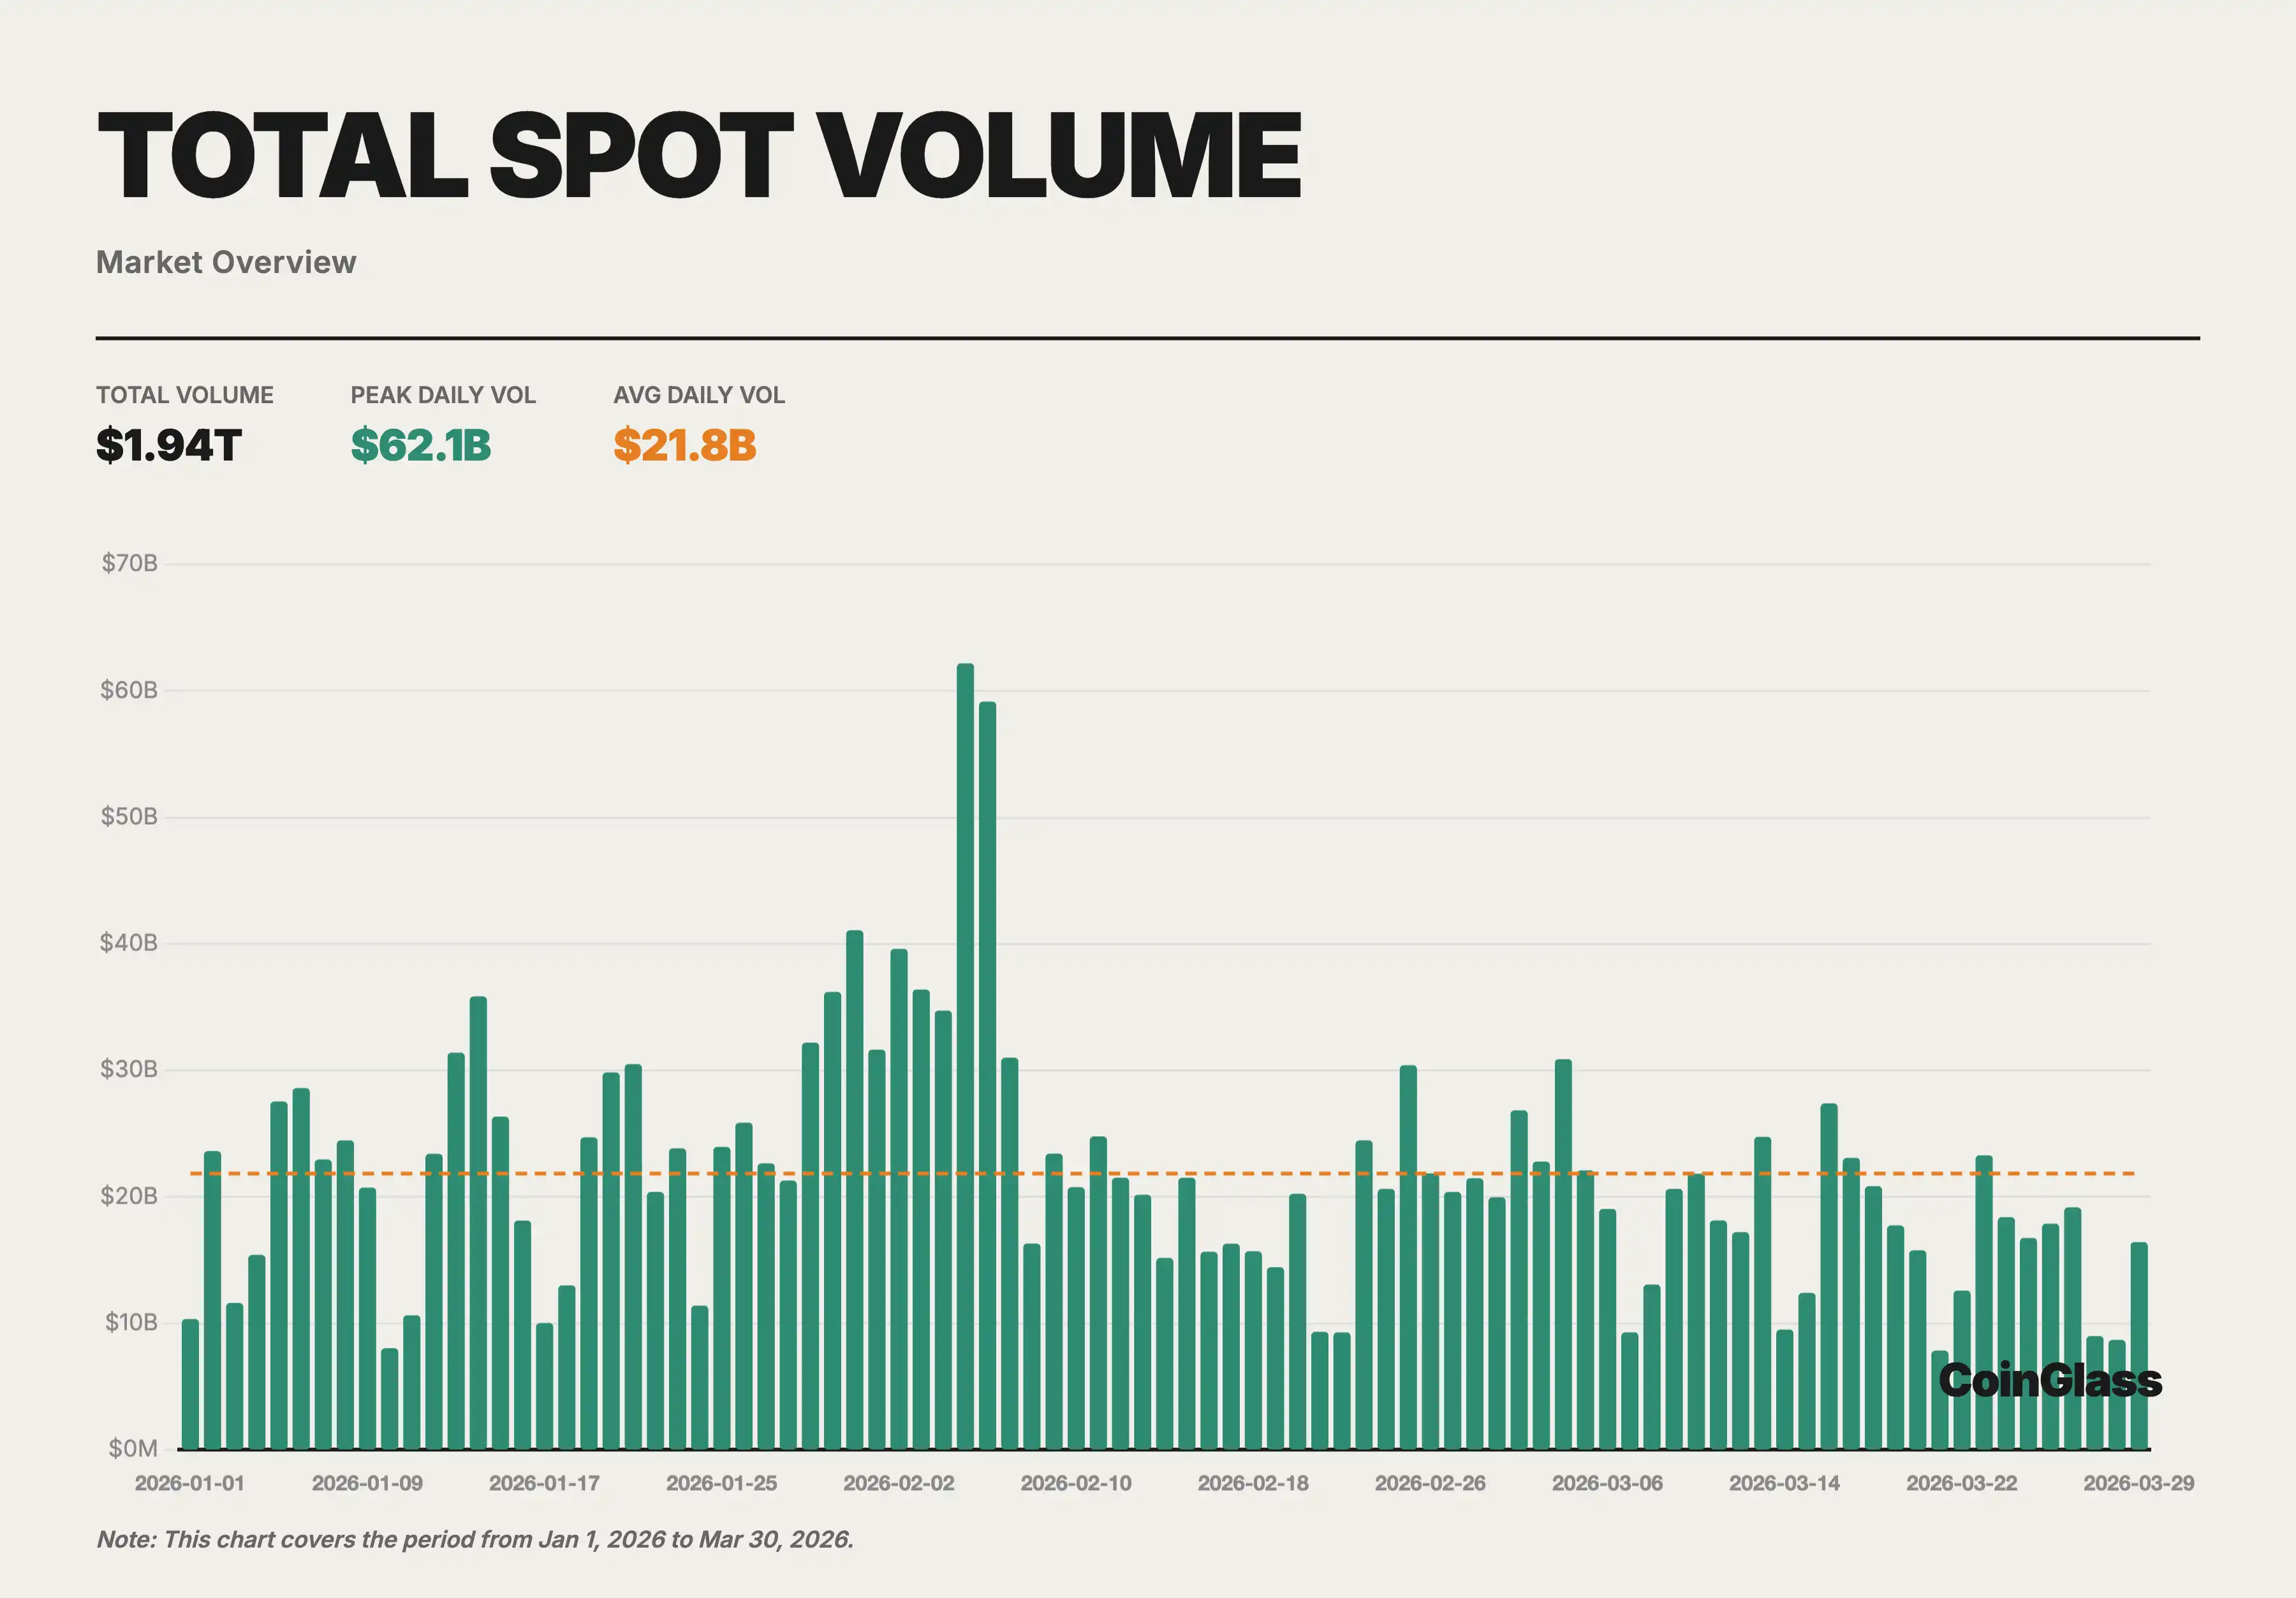
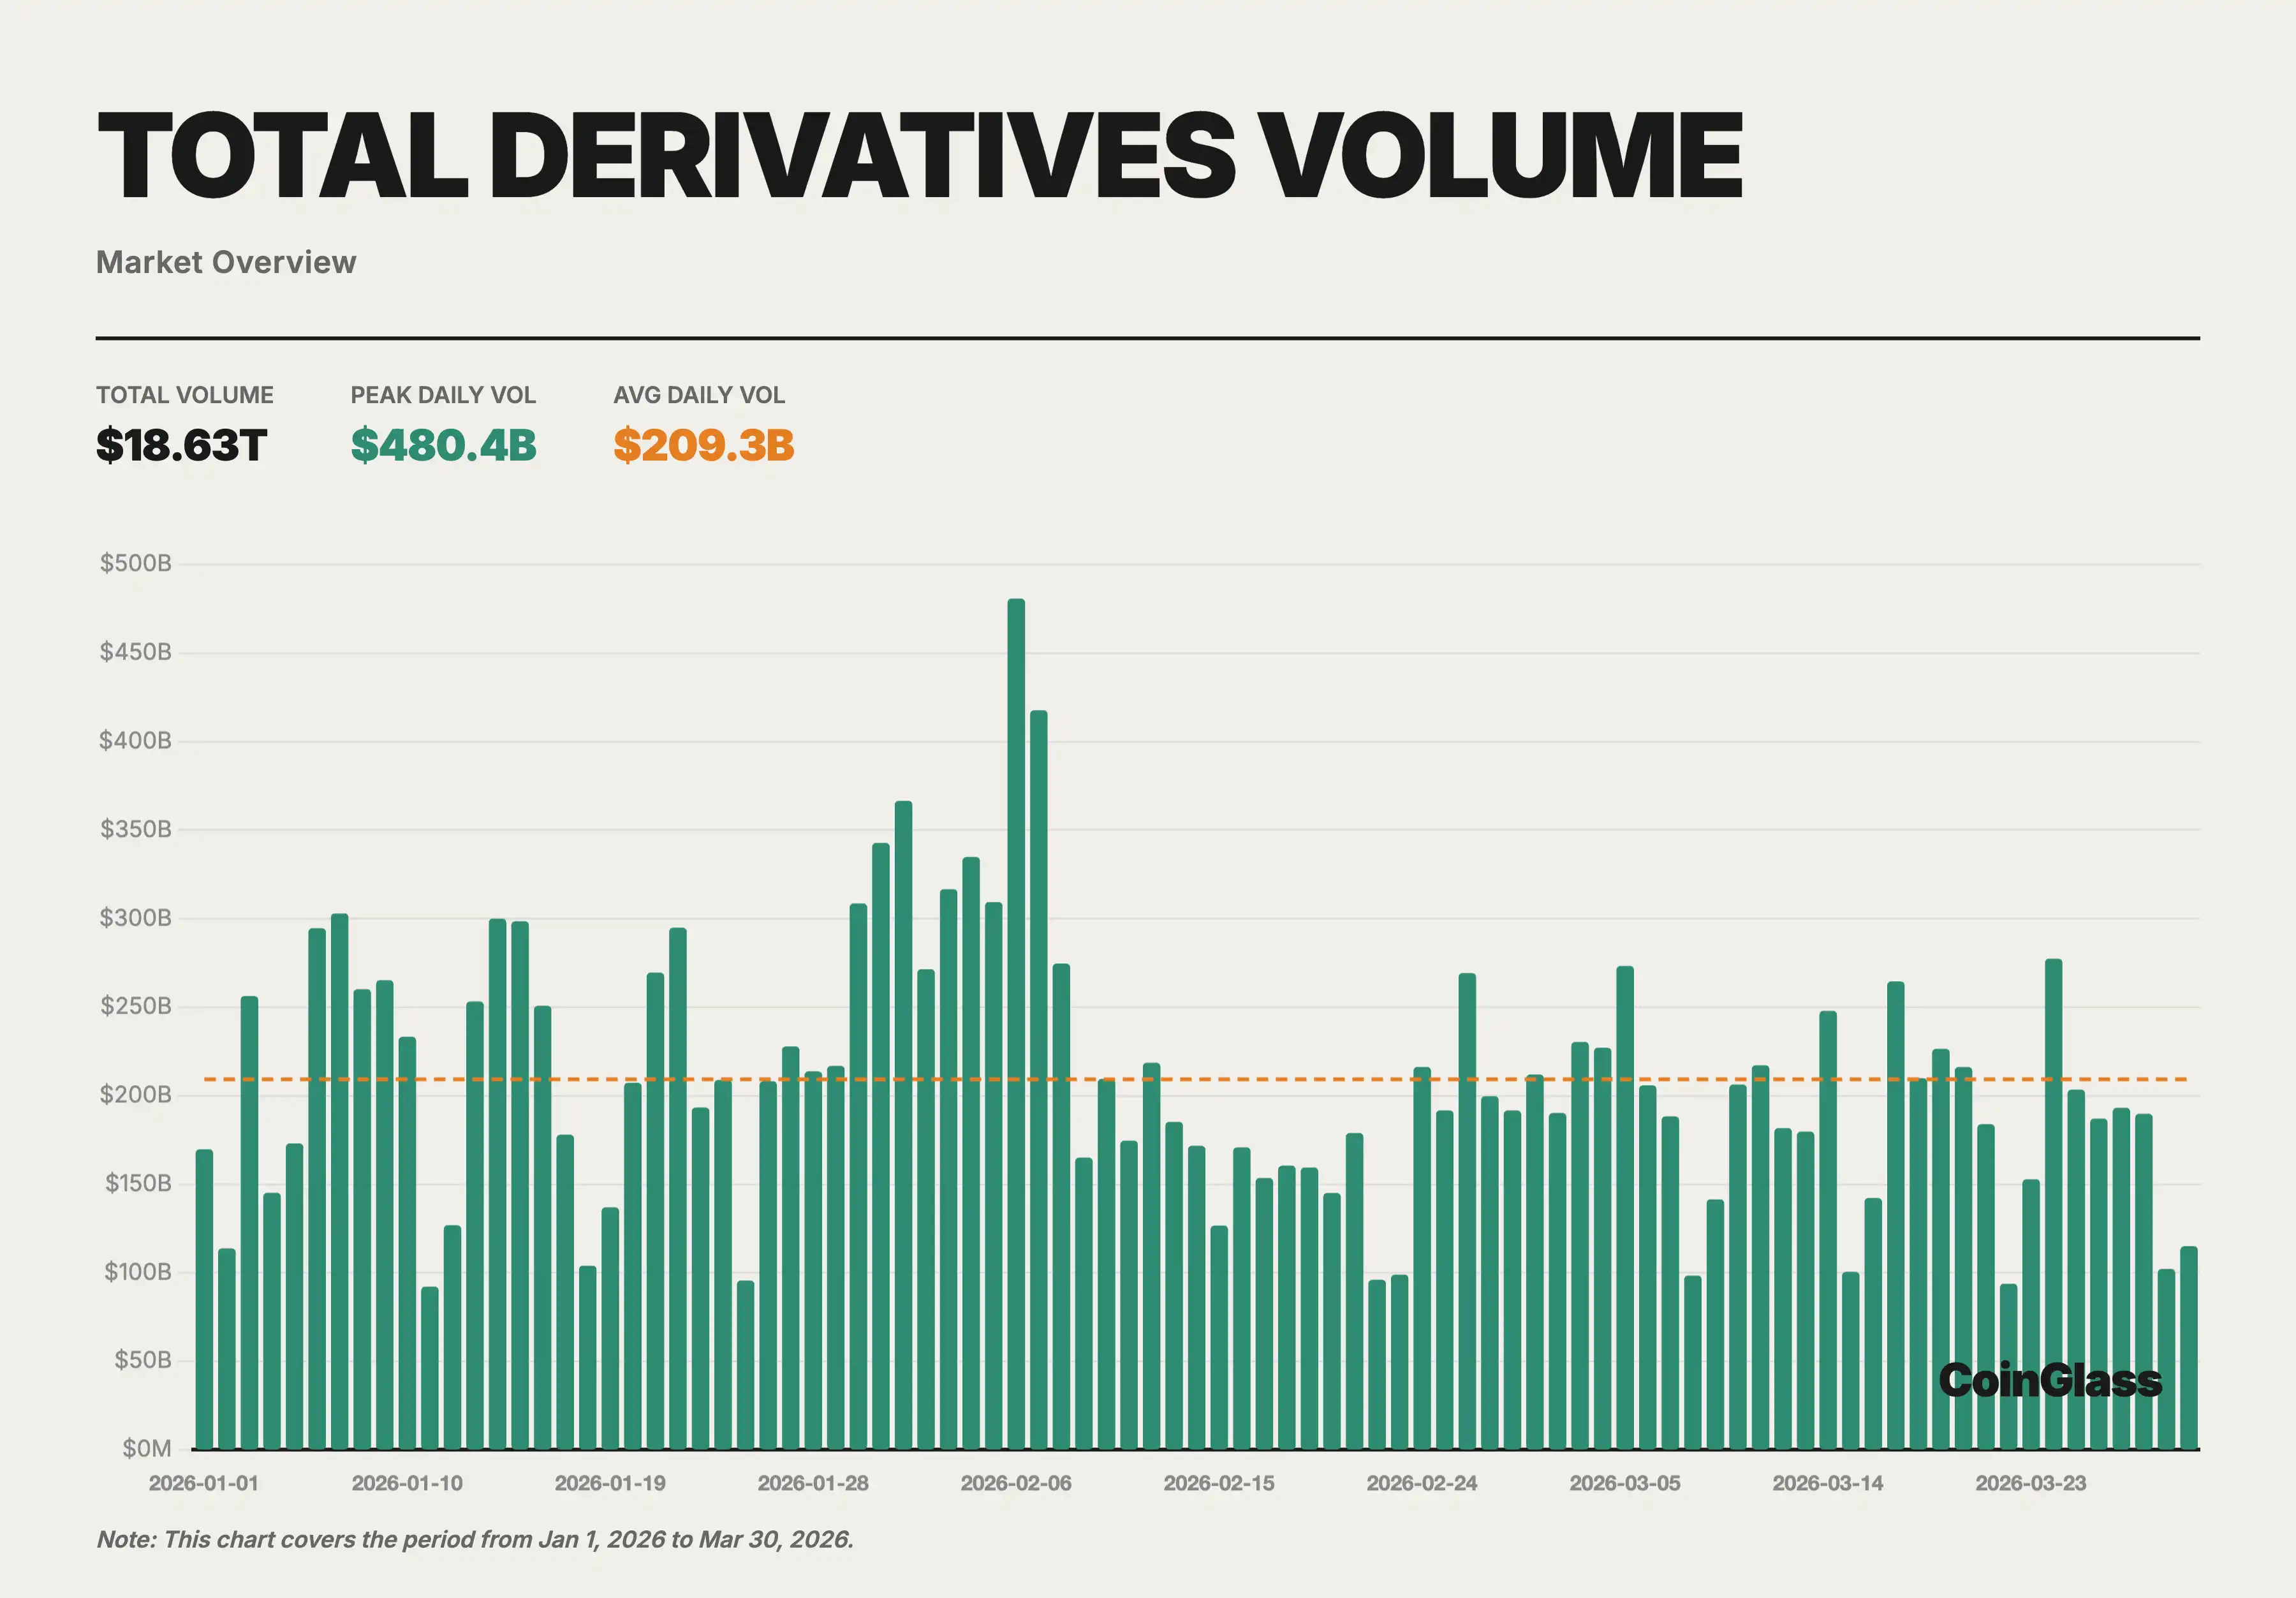
In Q1 2026, the total trading volume in the entire cryptocurrency market (spot + derivatives) was approximately $20.57 trillion, with spot trading at around $1.94 trillion and derivatives trading at about $18.63 trillion. From the monthly distribution, January saw the highest total trading volume (spot $704.7 billion + derivatives $6.73 trillion), February slightly retreated, and March further contracted to a quarterly low. This trend echoes the cautious sentiment in the global macro environment during the same period, as the market's risk appetite has not fully recovered after the sharp deleveraging in Q4 2025.
The average daily trading volume in the spot market was about $21.8 billion, and in the derivatives market, it was approximately $209.3 billion. The ratio of derivatives to spot remained stable at about 9.6 times during Q1, slightly higher than the average level for the entire year of 2025. This indicates that in the market adjustment phase, traders are more inclined to hedge and engage in short-term speculation through derivatives rather than directional allocation in the spot market.
2.2 Spot Trading Volume and Market Share
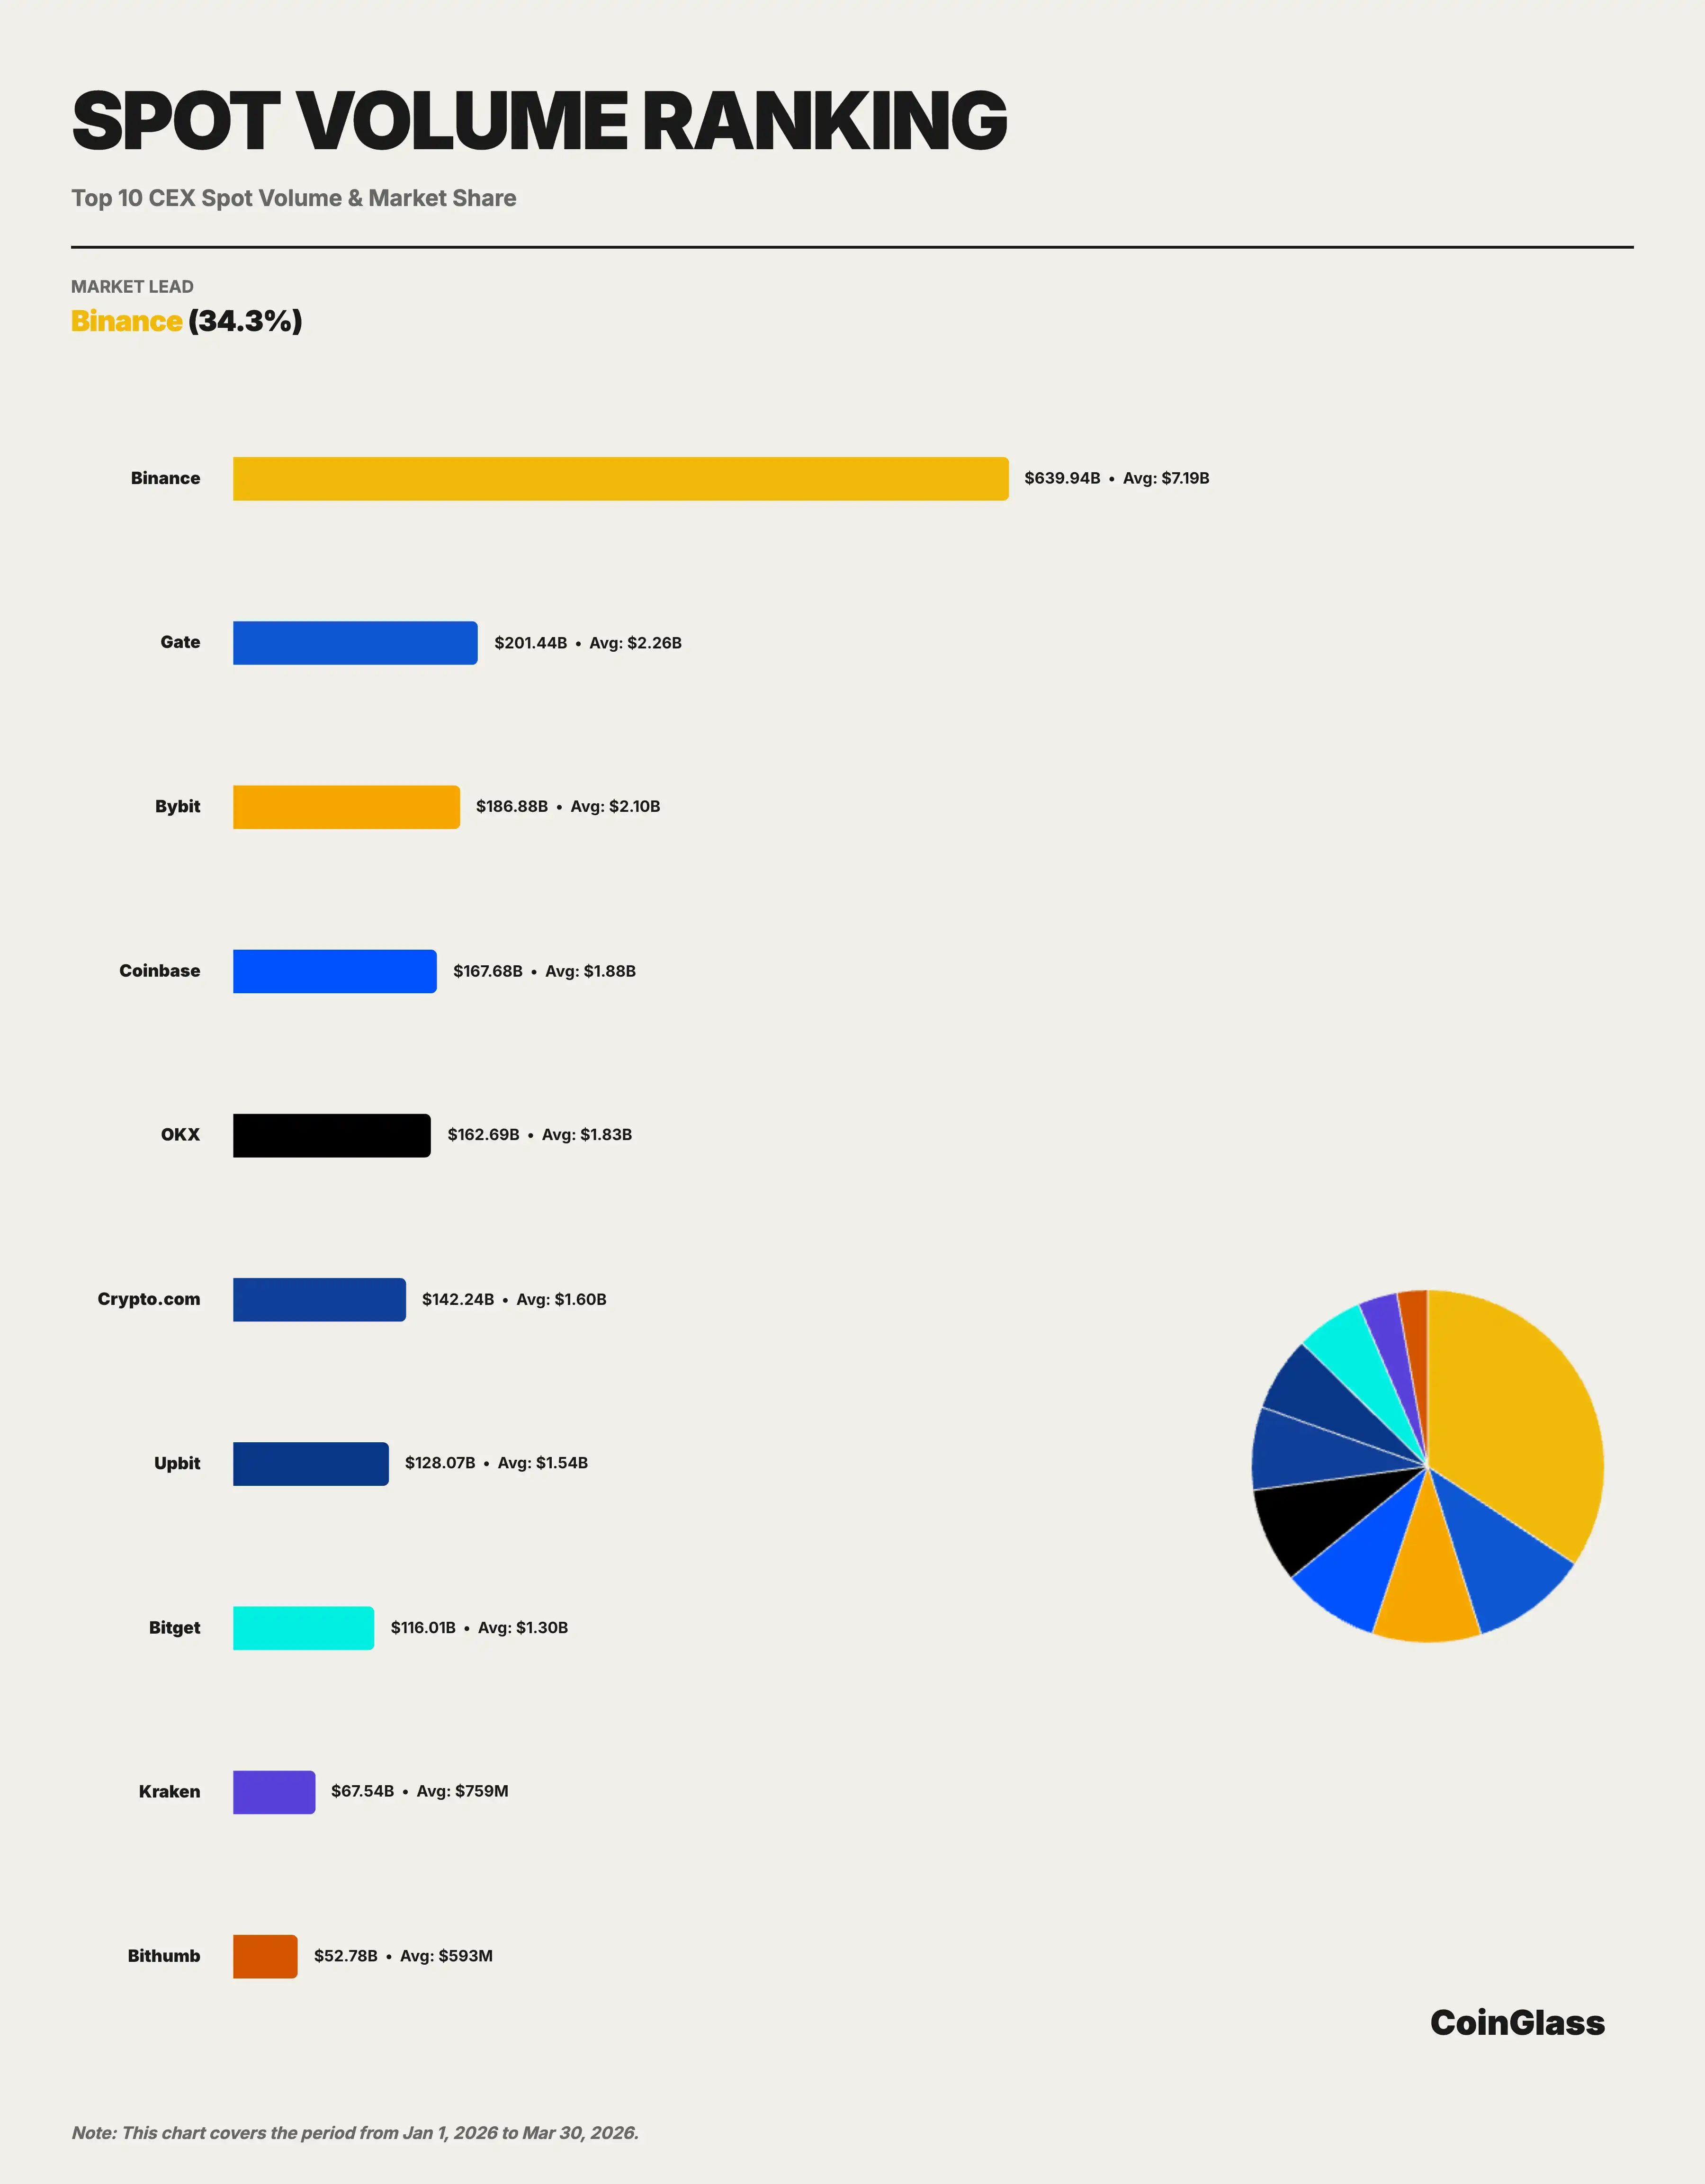
Binance achieved a cumulative transaction volume of about $639.9 billion in the Q1 spot market, corresponding to an average daily trading volume of about $7.19 billion, with a market share of approximately 34.3% under the Top 10 statistical criteria. From the monthly trend, Binance's share in the spot Top 10 exchanges remained stable overall: 34.0% in January, 33.7% in February, and rebounding to 35.4% in March. Although the total market volume shrank from $704.7 billion in January to $542.0 billion in March, a decrease of 23%, Binance's share actually increased slightly. This indicates that although the overall spot market has declined, the leading liquidity continues to concentrate among a few platforms.
If we expand the competitive landscape to the Top 5, the distribution of the spot market appears to be significantly more dispersed than that of the derivatives market. In Q1, the cumulative trading volume of the top five platforms in the spot market were Binance, Gate, Bybit, Coinbase, and OKX, corresponding to transaction amounts of approximately $639.9 billion, $201.4 billion, $186.9 billion, $167.7 billion, and $162.7 billion respectively. When measured against the overall market, the shares of the remaining four platforms, besides Binance, were roughly distributed in the 8% to 10% range. In other words, Binance's leadership in the spot market is clear, but compared to the derivatives market, the distribution of the second tier in the spot market is more balanced, and competition is more dispersed.
2.3 Derivatives Trading Volume and Market Share
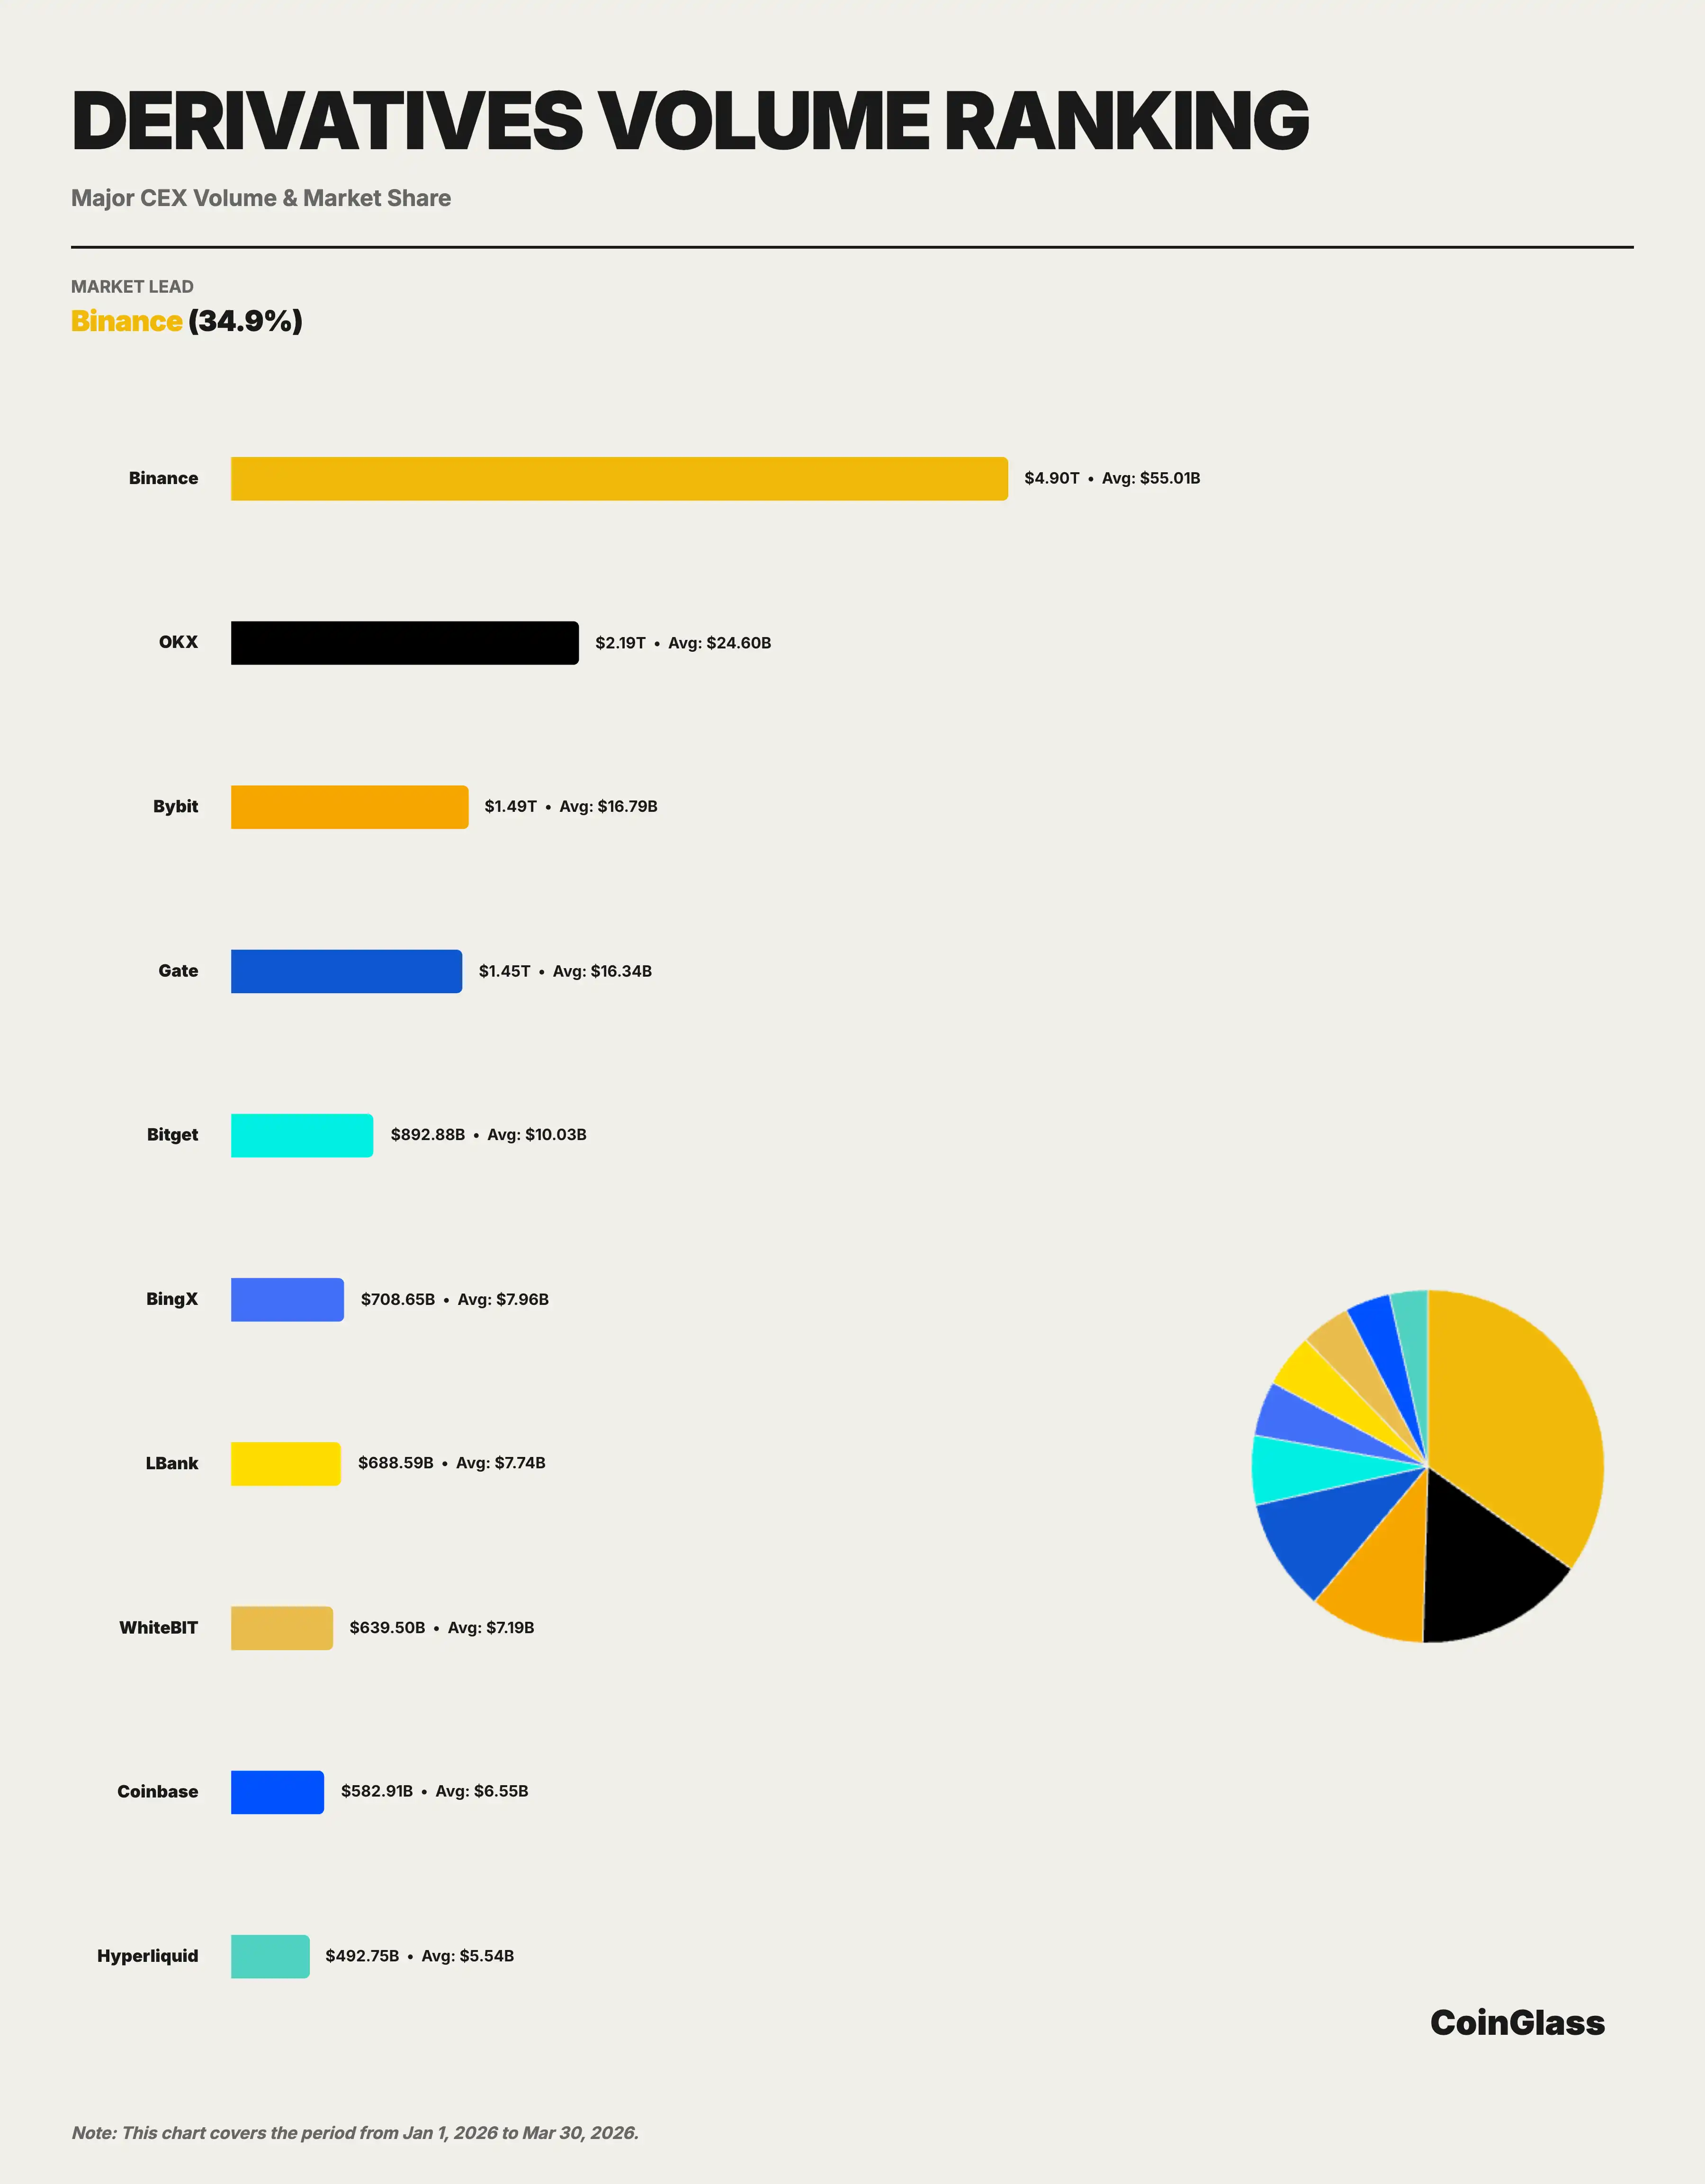
In Q1, Binance had a cumulative trading volume in the derivatives market of approximately $4.90 trillion, with an average daily trading volume of about $55 billion. Under the statistical criteria of the Top 10 exchanges, Binance firmly held the first position with a market share of 34.9%, surpassing the sum of the second-place OKX ($2.19 trillion) and the third-place Bybit ($1.49 trillion).
From the monthly trend, Binance’s trading share in the Top 10 derivatives exchanges remained relatively stable overall: 33.2% in January, rising to 35.8% in February, and maintaining at 35.7% in March. This downward recovery trajectory aligns with the process of market liquidity rebounding back to leading platforms after the deleveraging shock in Q4 2025. In other words, trading volume among platforms had briefly dispersed at the beginning of the quarter, but as the market gradually stabilized, liquidity continued to flow back to platforms with deeper liquidity and better execution efficiency, with Binance demonstrating stronger absorption capacity in this round of recovery.
OKX is currently the centralized platform closest to Binance, but its trading volume is still only about 45% that of Binance; Bybit and Gate are similar in size, constituting the middle of the second tier; Bitget remains among the top five but has created a significant gap with the top four platforms. In relative terms, Binance's derivatives trading volume is about 3.3 times that of Bybit, 3.4 times that of Gate, and 5.5 times that of Bitget.
2.4 Comparative Analysis of Competitive Landscape
When observing the spot and derivatives within the same framework, it is clear that there are significant differences in the competitive landscape of the two types of markets. In the spot market, Binance retains the first position, but the second tier is composed collectively by Gate, Bybit, Coinbase, and OKX, with shares relatively close; in the derivatives market, the lead of Binance is much larger, and a certain hierarchy has begun to form between second-place OKX and the third and fourth places. It can be seen that Binance's lead in the derivatives market is more centralized, while the spot market presents a structure of “top first, and second tier dispersed.”
From the platform positioning perspective, OKX consistently ranks second in derivatives trading scale and is the closest challenger to Binance; Bybit and Gate are closer in competition within the same tier, with the former having a strong presence among global active traders and the latter maintaining a high presence in terms of trading volume and open interest. BingX, LBank, WhiteBIT, Coinbase, and Hyperliquid follow after the Top 5, maintaining considerable trading activity, but still showing an overall magnitude gap compared to the top five platforms.
It is noteworthy that decentralized derivatives platforms have entered the mainstream comparative view. Hyperliquid had a derivatives trading volume of approximately $49.27 billion in Q1, ranking within the top ten, and achieving an average open interest of about $6 billion. This indicates that on-chain derivatives are no longer just marginal supplements but are beginning to form actual competition within specific markets. However, based on current scale, its overall size is still significantly lower than that of leading centralized platforms like Binance, OKX, Bybit, and Gate.
3. Derivatives Open Interest
3.1 Overall Market Contract Open Interest Trends
In Q1 2026, the average daily open interest across the entire market was approximately $117.2 billion, with a peak in the quarter occurring on January 15, reaching about $152.5 billion. From the monthly trend, January had an average open interest of about $141.1 billion, which significantly dropped to $102.6 billion in February (a decrease of about 27%), and slightly rose to $106.0 billion in March.
3.2 Changes in Open Interest Proportion and Ranking
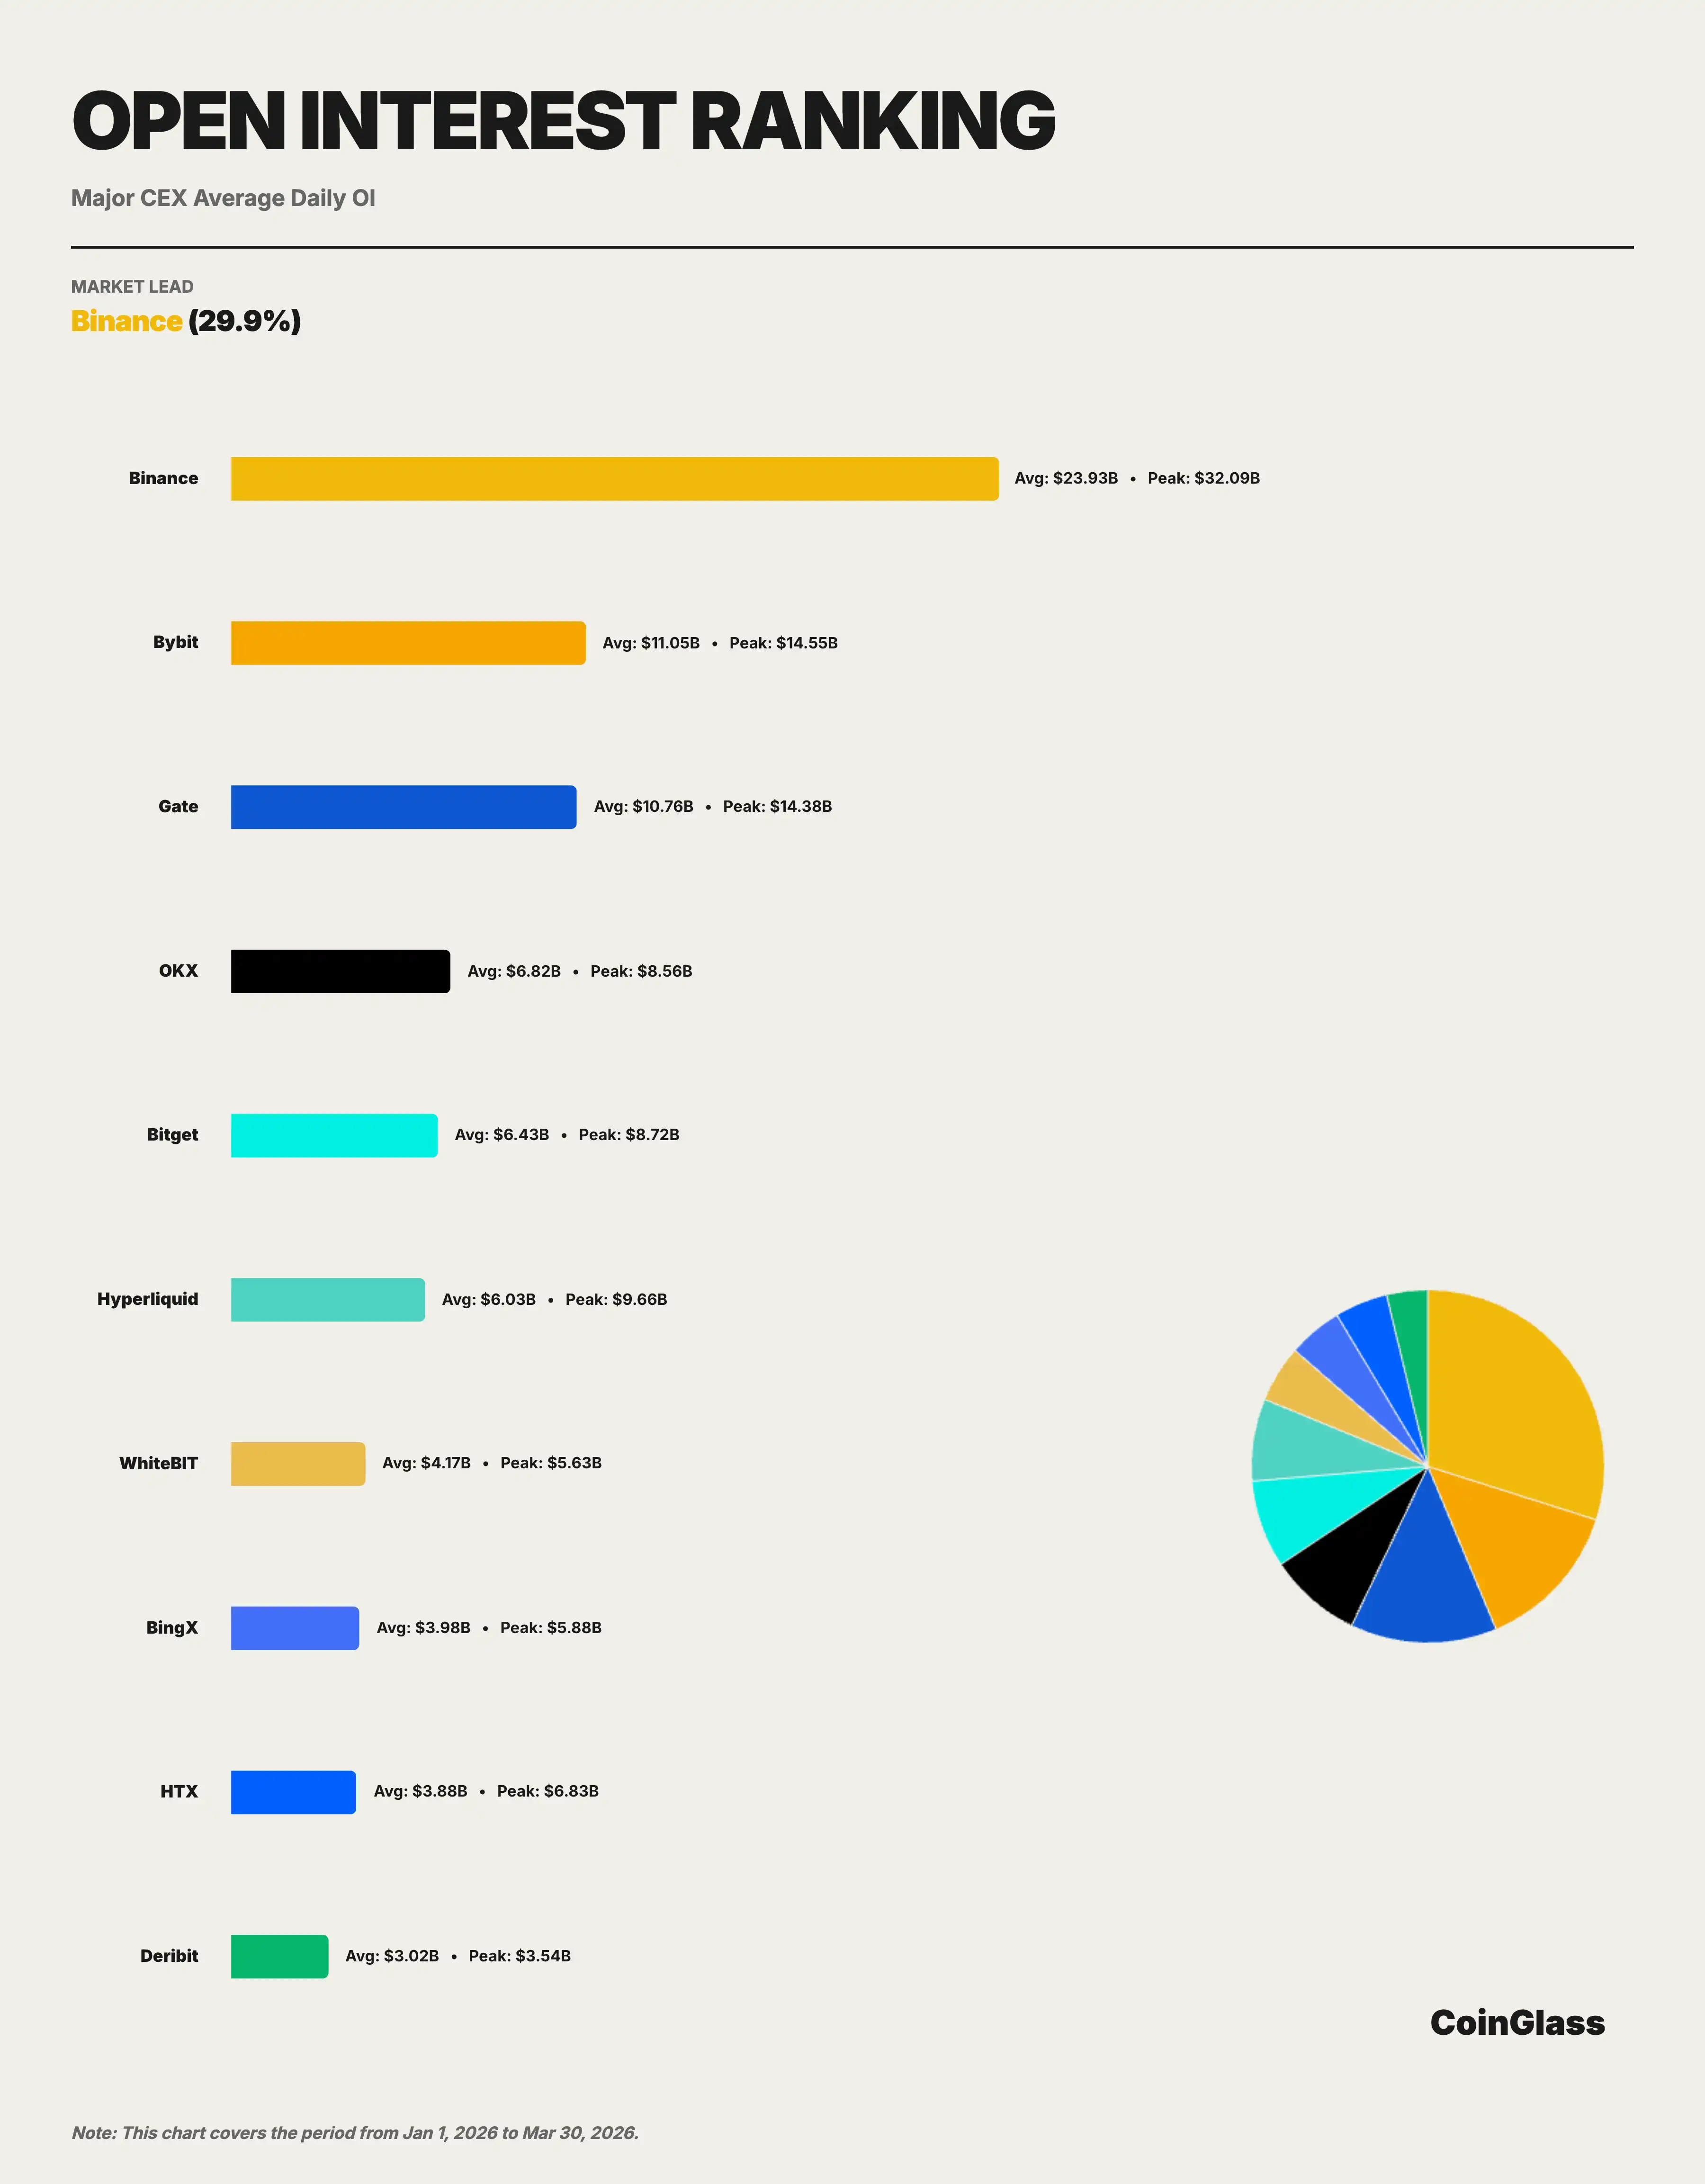
Binance's average open interest in Q1 was about $23.9 billion, with a corresponding share of approximately 29.9%, ranking first among the Top 10 exchanges. The second to fifth places were Bybit, Gate, OKX, and Bitget, with average open interests of approximately $11 billion, $10.8 billion, $6.8 billion, and $6.4 billion respectively. Binance's average open interest is about 2.2 times that of Bybit, 2.2 times that of Gate, 3.5 times that of OKX, and 3.7 times that of Bitget, showing a clear lead.
Binance's open interest share remained in the range of 20%-21% through the quarter (across the entire market), with limited fluctuations, indicating that its market position in terms of open interest is basically stable. Moreover, Binance's peak open interest reached approximately $32.1 billion, about 2.2 times that of the second-place Bybit ($14.5 billion), demonstrating Binance's capacity to absorb more positions during intensified market fluctuations.
3.3 Market Structure Analysis
The structure of the open interest market presents characteristics different from those of trading volume. In terms of trading volume, Binance leads the second place by over 19 percentage points; however, in terms of open interest, the gap between Binance (29.9%), Bybit (13.8%), Gate (13.4%), and OKX (8.5%) has narrowed. This reflects that different platforms have their own competitive advantages in attracting long-term open interest.
Hyperliquid's open interest scale is particularly noteworthy. Its average open interest is about $6 billion, with a peak approaching $9.7 billion, nearing Bitget and exceeding platforms like WhiteBIT and BingX. The improvement of on-chain platforms in terms of open interest indicates that their attractiveness in high-leverage and strategy trading continues to increase. In the short term, this trend is still insufficient to shake Binance's leading position, but for second-tier platforms, the entry of on-chain competitors is increasing the complexity of future share competition. As an on-chain derivatives protocol, its rapid growth in open interest further validates the judgment in the 2025 report regarding the shift of decentralized derivatives from concept validation to actual market share competition.
4. Liquidity Depth
This chapter's data are based on order book snapshot data, comparing the ±1% bidirectional depth of major platforms in the BTC and ETH spot and contract markets. Compared to trading volume and open interest, depth more directly reflects a platform's true capacity to execute large trades, making it an important basis for assessing whether leading platforms are genuinely "quality leading."
4.1 BTC Market Depth
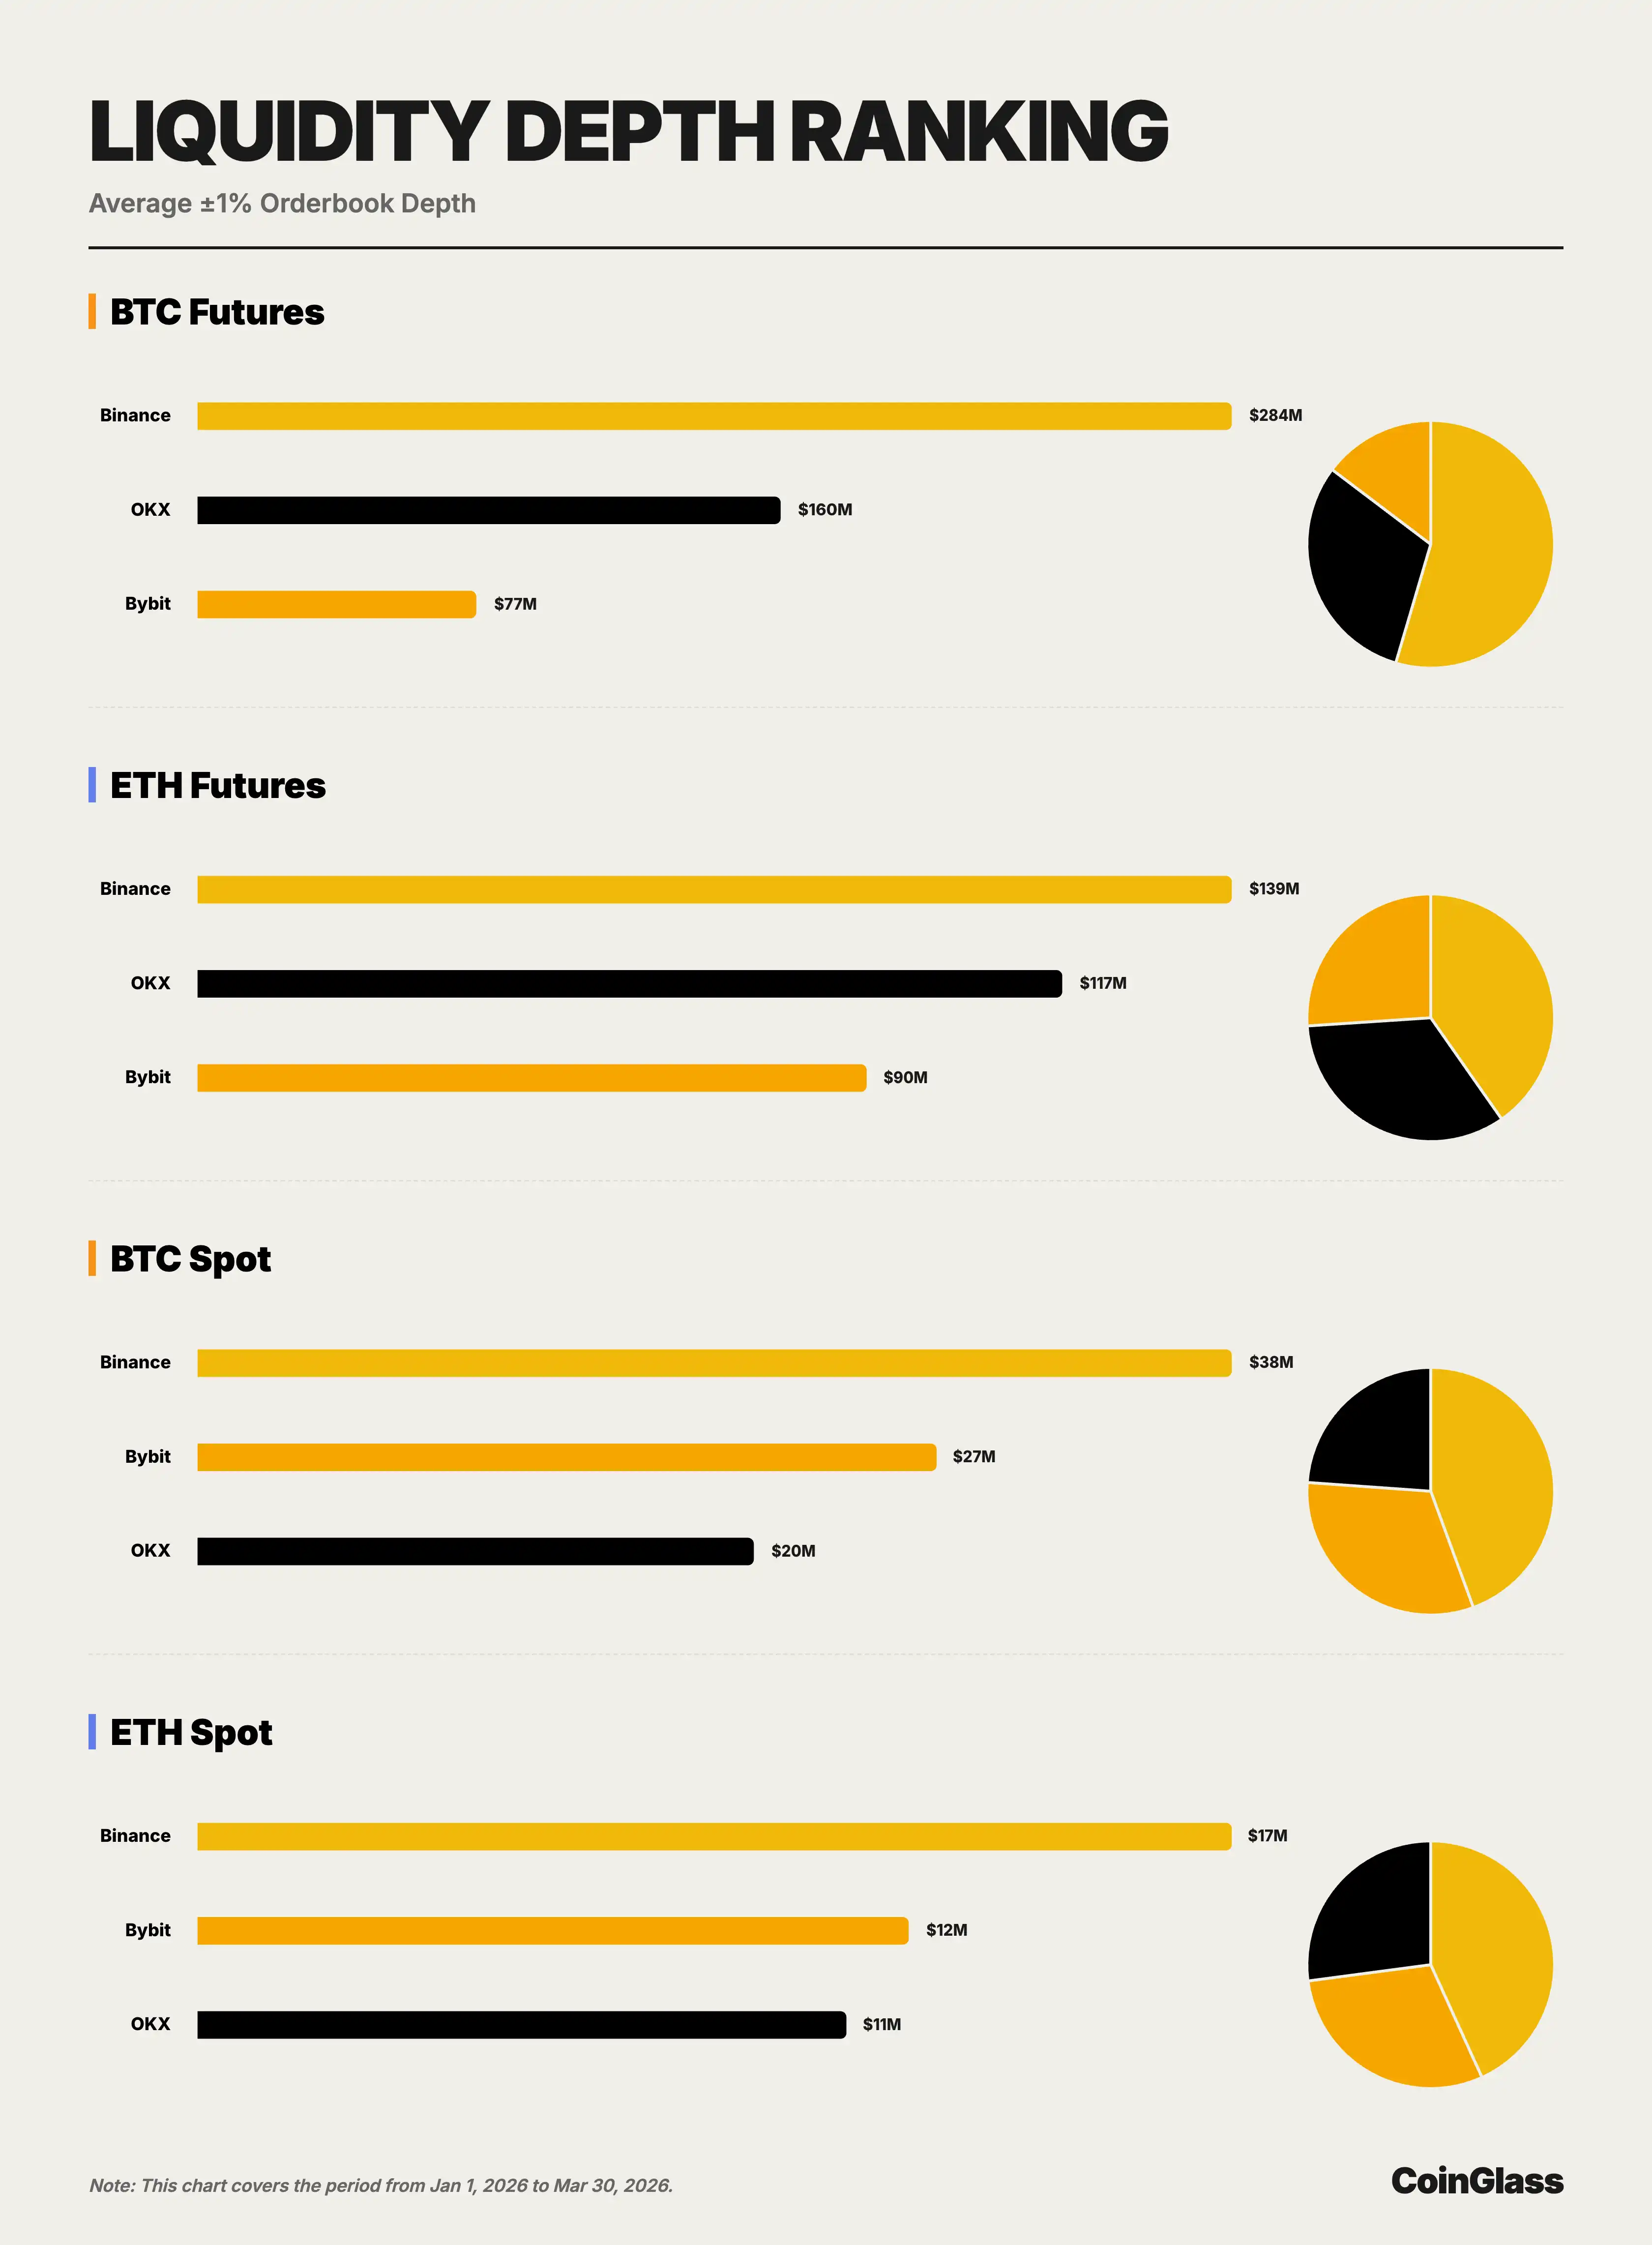
In the BTC contract market, the average ±1% bidirectional depth of Binance, OKX, and Bybit was approximately $284 million, $160 million, and $76.55 million, respectively. Binance is about 1.8 times that of OKX and 3.7 times that of Bybit, maintaining a significant lead. From an institutional trading perspective, this means Binance can accommodate larger order sizes in the BTC contract market without excessively amplifying impact costs, and its liquidity advantage has direct execution value.
In the BTC spot market, the average ±1% bidirectional depth of Binance, Bybit, and OKX was approximately $37.54 million, $26.82 million, and $20.18 million, respectively. Unlike the contract market, the second place in BTC spot is occupied by Bybit rather than OKX, but Binance is still about 40% higher than Bybit and about 86% higher than OKX. This indicates that Binance holds the first position in both the BTC spot and contract markets, while the second-place platforms rotate between different sub-markets.
4.2 ETH Market Depth
In the ETH contract market, Binance, OKX, and Bybit's average ±1% bidirectional depth was approximately $139 million, $117 million, and $90.15 million, respectively. Compared to BTC contracts, the head-to-head competition in the ETH contract market is closer, with the gap between OKX and Binance narrowing to about 16% and the gap between Bybit and Binance approximately 35%. Nevertheless, Binance still maintains the first position, indicating its lead exists not only in BTC single assets but also in the ETH contract market.
In the ETH spot market, Binance, Bybit, and OKX's average ±1% bidirectional depth was approximately $16.84 million, $11.58 million, and $10.57 million, respectively. Similar to the BTC spot market, the second place is still held by Bybit, but Binance is approximately 45% higher than Bybit and about 59% higher than OKX. The results show that Binance ranks first in all four core sub-markets, while the second place rotates between OKX and Bybit, further suggesting that Binance's advantage is broader and not concentrated in any specific asset or market.
4.3 Relationship Between Depth and Trading Volume
From the perspective of execution capability, depth usually measures the true liquidity quality of a platform better than trading volume. Q1 data shows that Binance not only leads in spot and derivatives trading scales but also possesses the best depth in the major trading scenarios of BTC and ETH. OKX is more competitive in contract depth, while Bybit comes closer in spot depth, but currently no platform is able to exert full pressure on Binance across all four core sub-markets, indicating that Binance's lead has strong structural stability.
5. User Asset Retention
5.1 Asset Reserve Scale and Change Trends
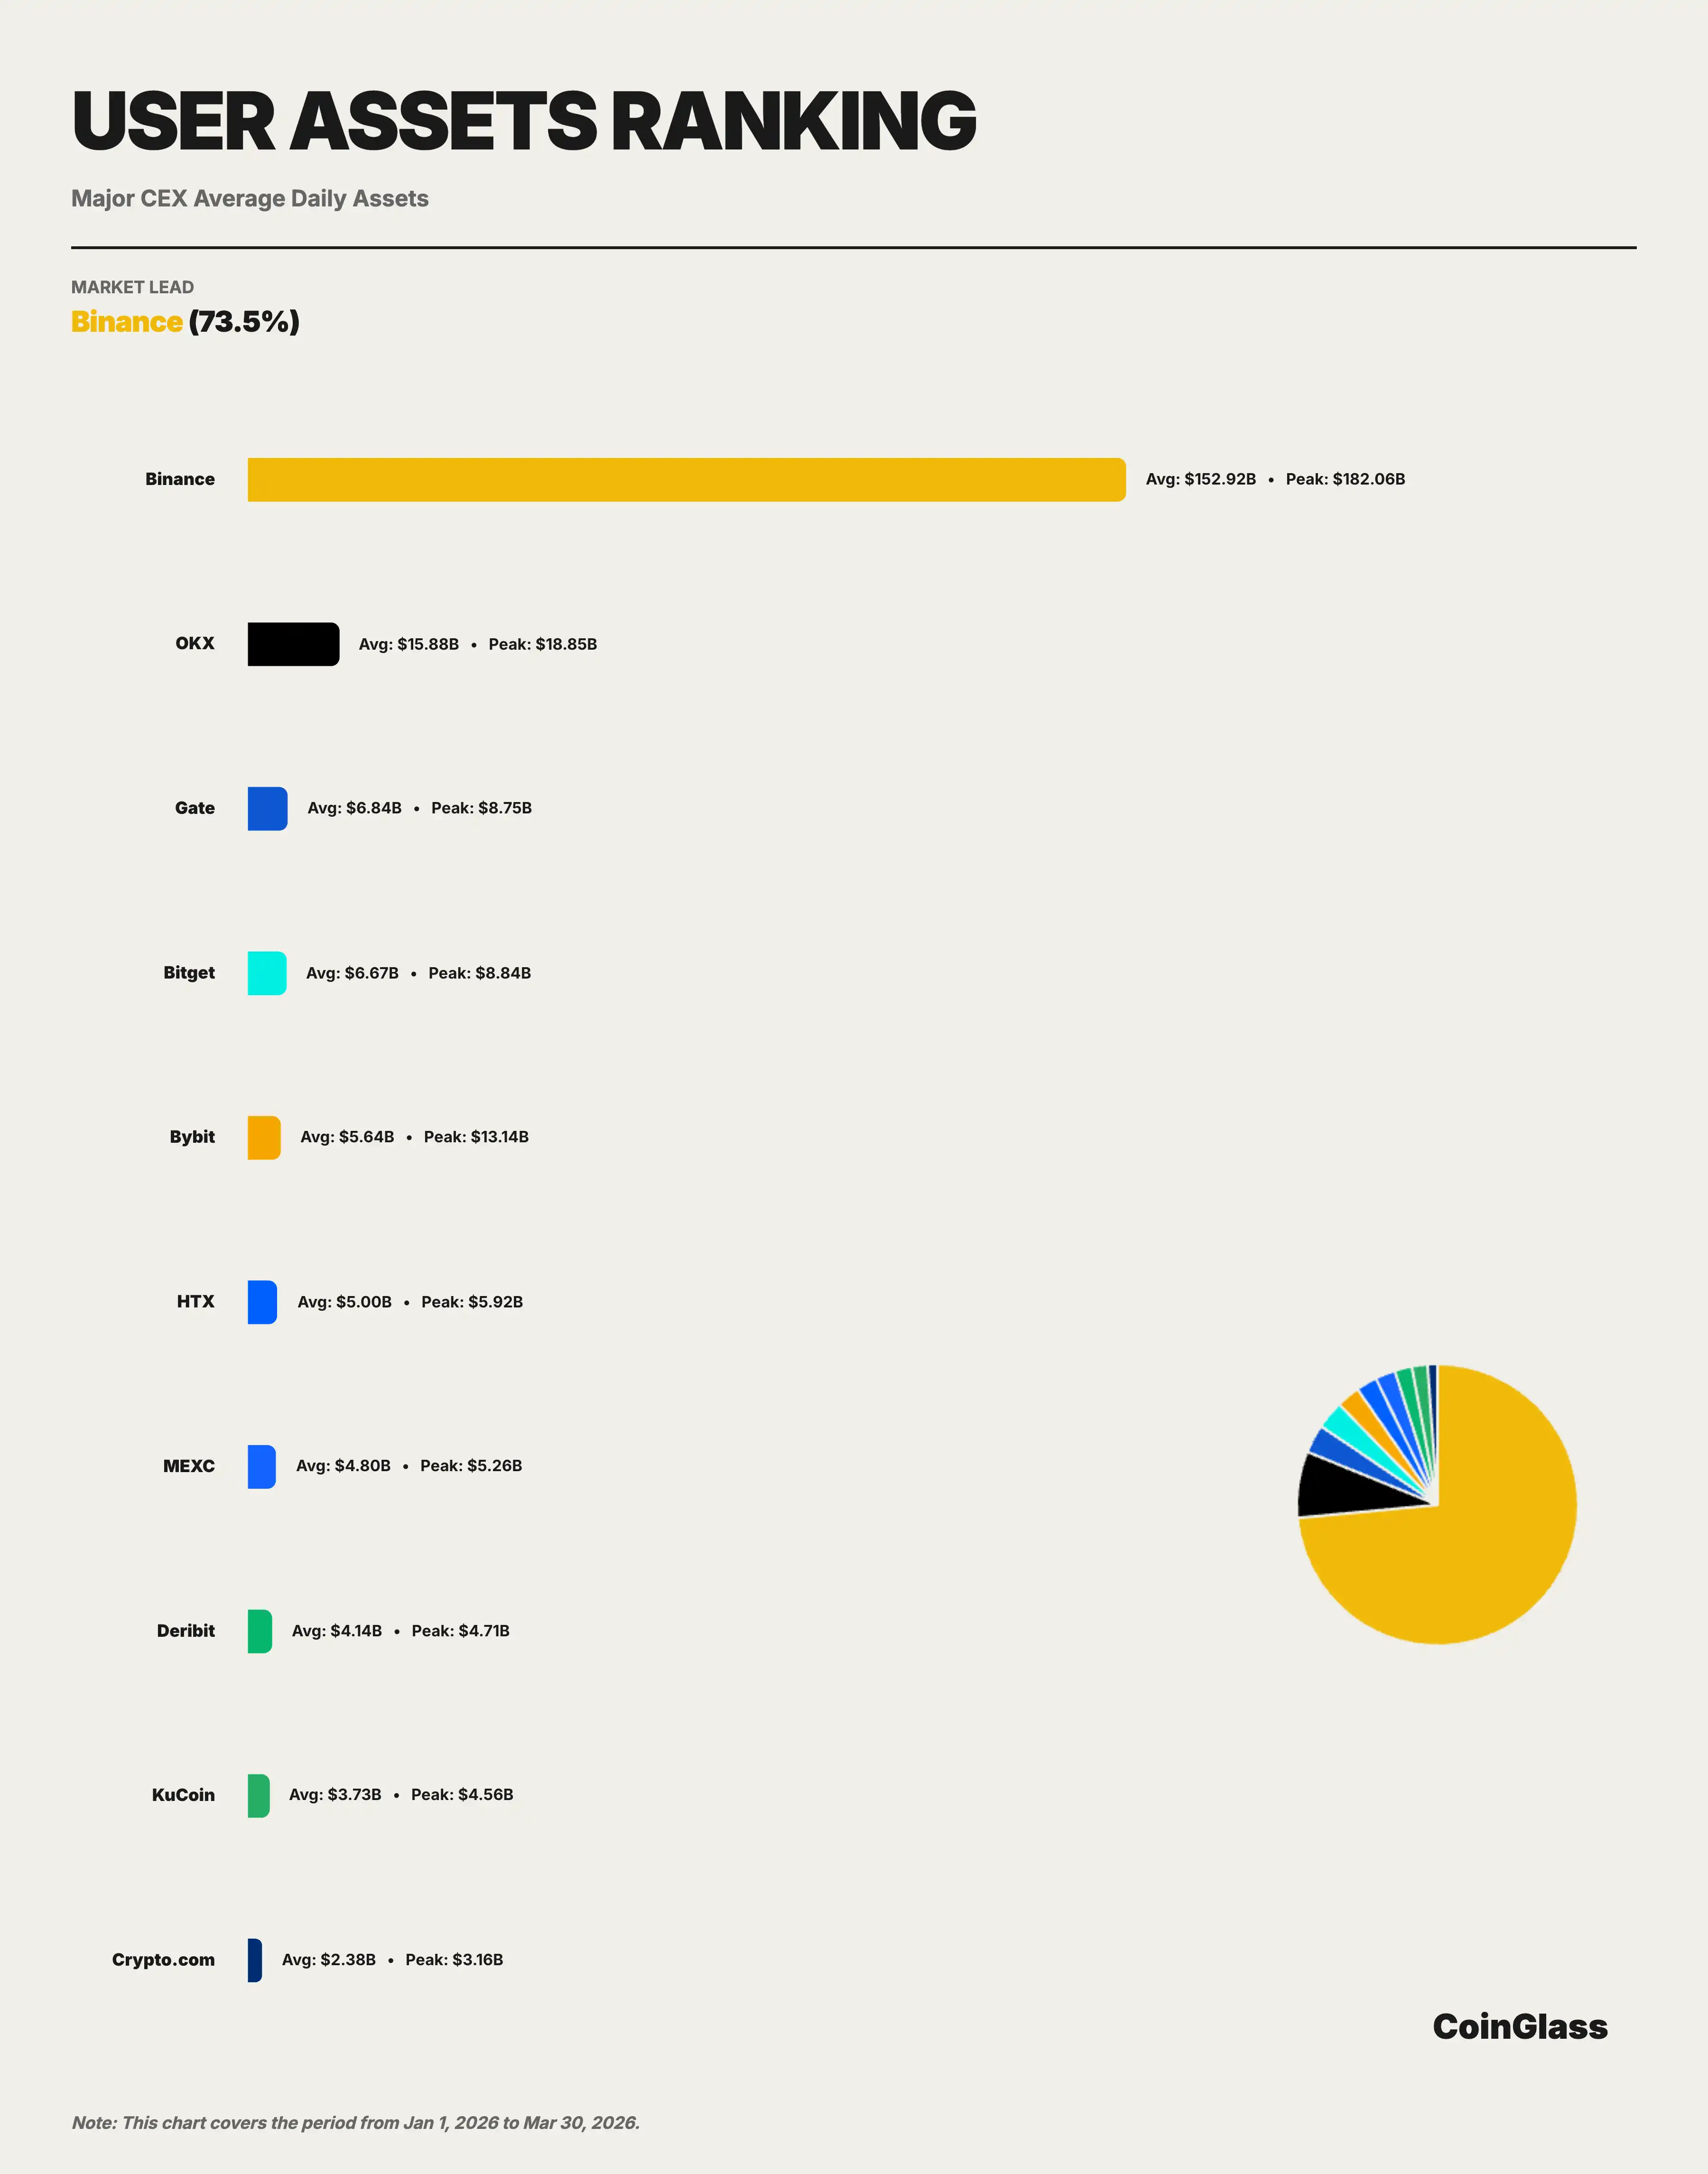
In Q1 2026, Binance's average custodial assets were approximately $152.9 billion, accounting for about 73.5% of the Top 10 exchanges. This ratio is far higher than Binance's market shares in trading volume (about 34.9%) and open interest (about 29.9%), indicating that Binance's concentration at the asset custody level is significantly higher than at the trading activity level. For exchanges, user asset retention is often related to brand trust, product ecosystem, the convenience of on-chain and off-chain fund inflows and outflows, and cross-business usage scenarios; thus, this indicator can more accurately reflect the platform's comprehensive competitive position in the medium to long term.
From the monthly trend, Binance's custodial assets experienced a process of initial decline followed by stabilization in Q1. In January, the average was about $172.7 billion, the quarterly high, reflecting the influx of funds amid optimistic market sentiment at the beginning of the year; in February, it fell to about $136.4 billion, a decrease of approximately 21%, consistent with the downward trend of open interest during the same period; in March, it slightly rebounded to about $147.8 billion, indicating that the trend of fund outflow has basically stabilized. The peak during the quarter occurred on January 15, at about $182.1 billion.
The Top 5 platforms are Binance, OKX, Gate, Bitget, and Bybit, corresponding to average user assets of approximately $152.9 billion, $15.9 billion, $6.8 billion, $6.7 billion, and $5.6 billion respectively. In other words, under major CEX criteria, only OKX maintains above the $10 billion level, while the third to fifth platforms are concentrated in the $5 billion to $7 billion range, presenting a structure of "significant lead for the first, second follows, and the rest platforms relatively close."
5.2 Comparison of Mainstream CEX Asset Retention
The market concentration in terms of user asset retention is much higher than in trading volume and open interest. Among the Top 10 exchanges, Binance leads with $152.9 billion, while the second place OKX has an average of about $15.9 billion, only one-tenth of Binance. The third to fifth places are Gate ($6.8 billion), Bitget ($6.7 billion), and Bybit ($5.6 billion), all comparable in size but with a substantial disparity from Binance, whose asset scale is about eight times that of the sum of the three. Binance's average user assets are approximately 9.6 times that of OKX, 22.4 times that of Gate, 22.9 times that of Bitget, and 27.1 times that of Bybit. Compared to its leads in derivatives trading volume and open interest, Binance's lead in asset retention dimensions is even greater. This means that Binance's market position is not only reflected in trading activity but also in the long-term preference for platforms where funds stay. For industry competitive patterns, this type of lead typically has a higher stability and is more difficult to replicate in the short term. Such an extremely concentrated distribution pattern indicates that Binance effectively assumes a role similar to that of a "systemic infrastructure" in user fund custody, and its operational and compliance status has an amplifying effect on the overall crypto market's robustness.
In the second tier, HTX ($5 billion), MEXC ($4.8 billion), Deribit ($4.1 billion), KuCoin ($3.7 billion), and Crypto.com ($2.4 billion) form a long tail.
6. Comprehensive Analysis and Outlook
Based on the data from trading volume, open interest, liquidity depth, and user asset retention, the following core judgments can be made:
Firstly, Binance's market leadership is comprehensive and solid. Binance ranks first in all core dimensions: derivatives trading volume of about $4.90 trillion (Top 10 share of 34.9%), average open interest of $23.9 billion (share of 29.9%), BTC contract depth of $284 million (share of 54.6%), and user assets of $152.9 billion (share of 73.5%). More importantly, Binance's lead in liquidity depth and asset custody dimensions is far greater than that in trading volume, indicating that its position as a core infrastructure of the cryptocurrency market is more robust than suggested by simple trading volume rankings.
Secondly, the competitive landscape of the derivatives market is being reshaped. OKX is the currently closest centralized platform to Binance, primarily in terms of derivatives trading volume and contract depth; Bybit features a relatively balanced performance in trading volume, open interest, and spot liquidity; Gate maintains a high presence in derivatives trading and open interest but is relatively weak in asset retention; Bitget is noted as an important platform in the second tier, maintaining positions in the top five in both derivatives trading volume and open interest. At the same time, the traditionally CEX-dominated derivatives market is being impacted by two forces: one side represented by regulatory institutions like CME attracting hedging and basis trading demand, and the other side represented by decentralized protocols like Hyperliquid attracting some high-frequency and strategy traders with their anti-censorship, composability, and 24/7 uninterrupted features.
Thirdly, the market is cautiously recovering as a whole. The trading volume in Q1 contracted month by month, and open interest stabilized after falling from high positions, reflecting the characteristics of market repair after the extreme events of Q4 2025. Entering Q2, key variables to watch include: clarification of the Federal Reserve's monetary policy path, changes in capital flows for BTC spot ETFs, and the progress of regulatory frameworks in various major jurisdictions.
This article comes from submissions and does not represent the views of BlockBeats.
免责声明:本文章仅代表作者个人观点,不代表本平台的立场和观点。本文章仅供信息分享,不构成对任何人的任何投资建议。用户与作者之间的任何争议,与本平台无关。如网页中刊载的文章或图片涉及侵权,请提供相关的权利证明和身份证明发送邮件到support@aicoin.com,本平台相关工作人员将会进行核查。


