Source: CoinGlass
I. Summary and Key Findings
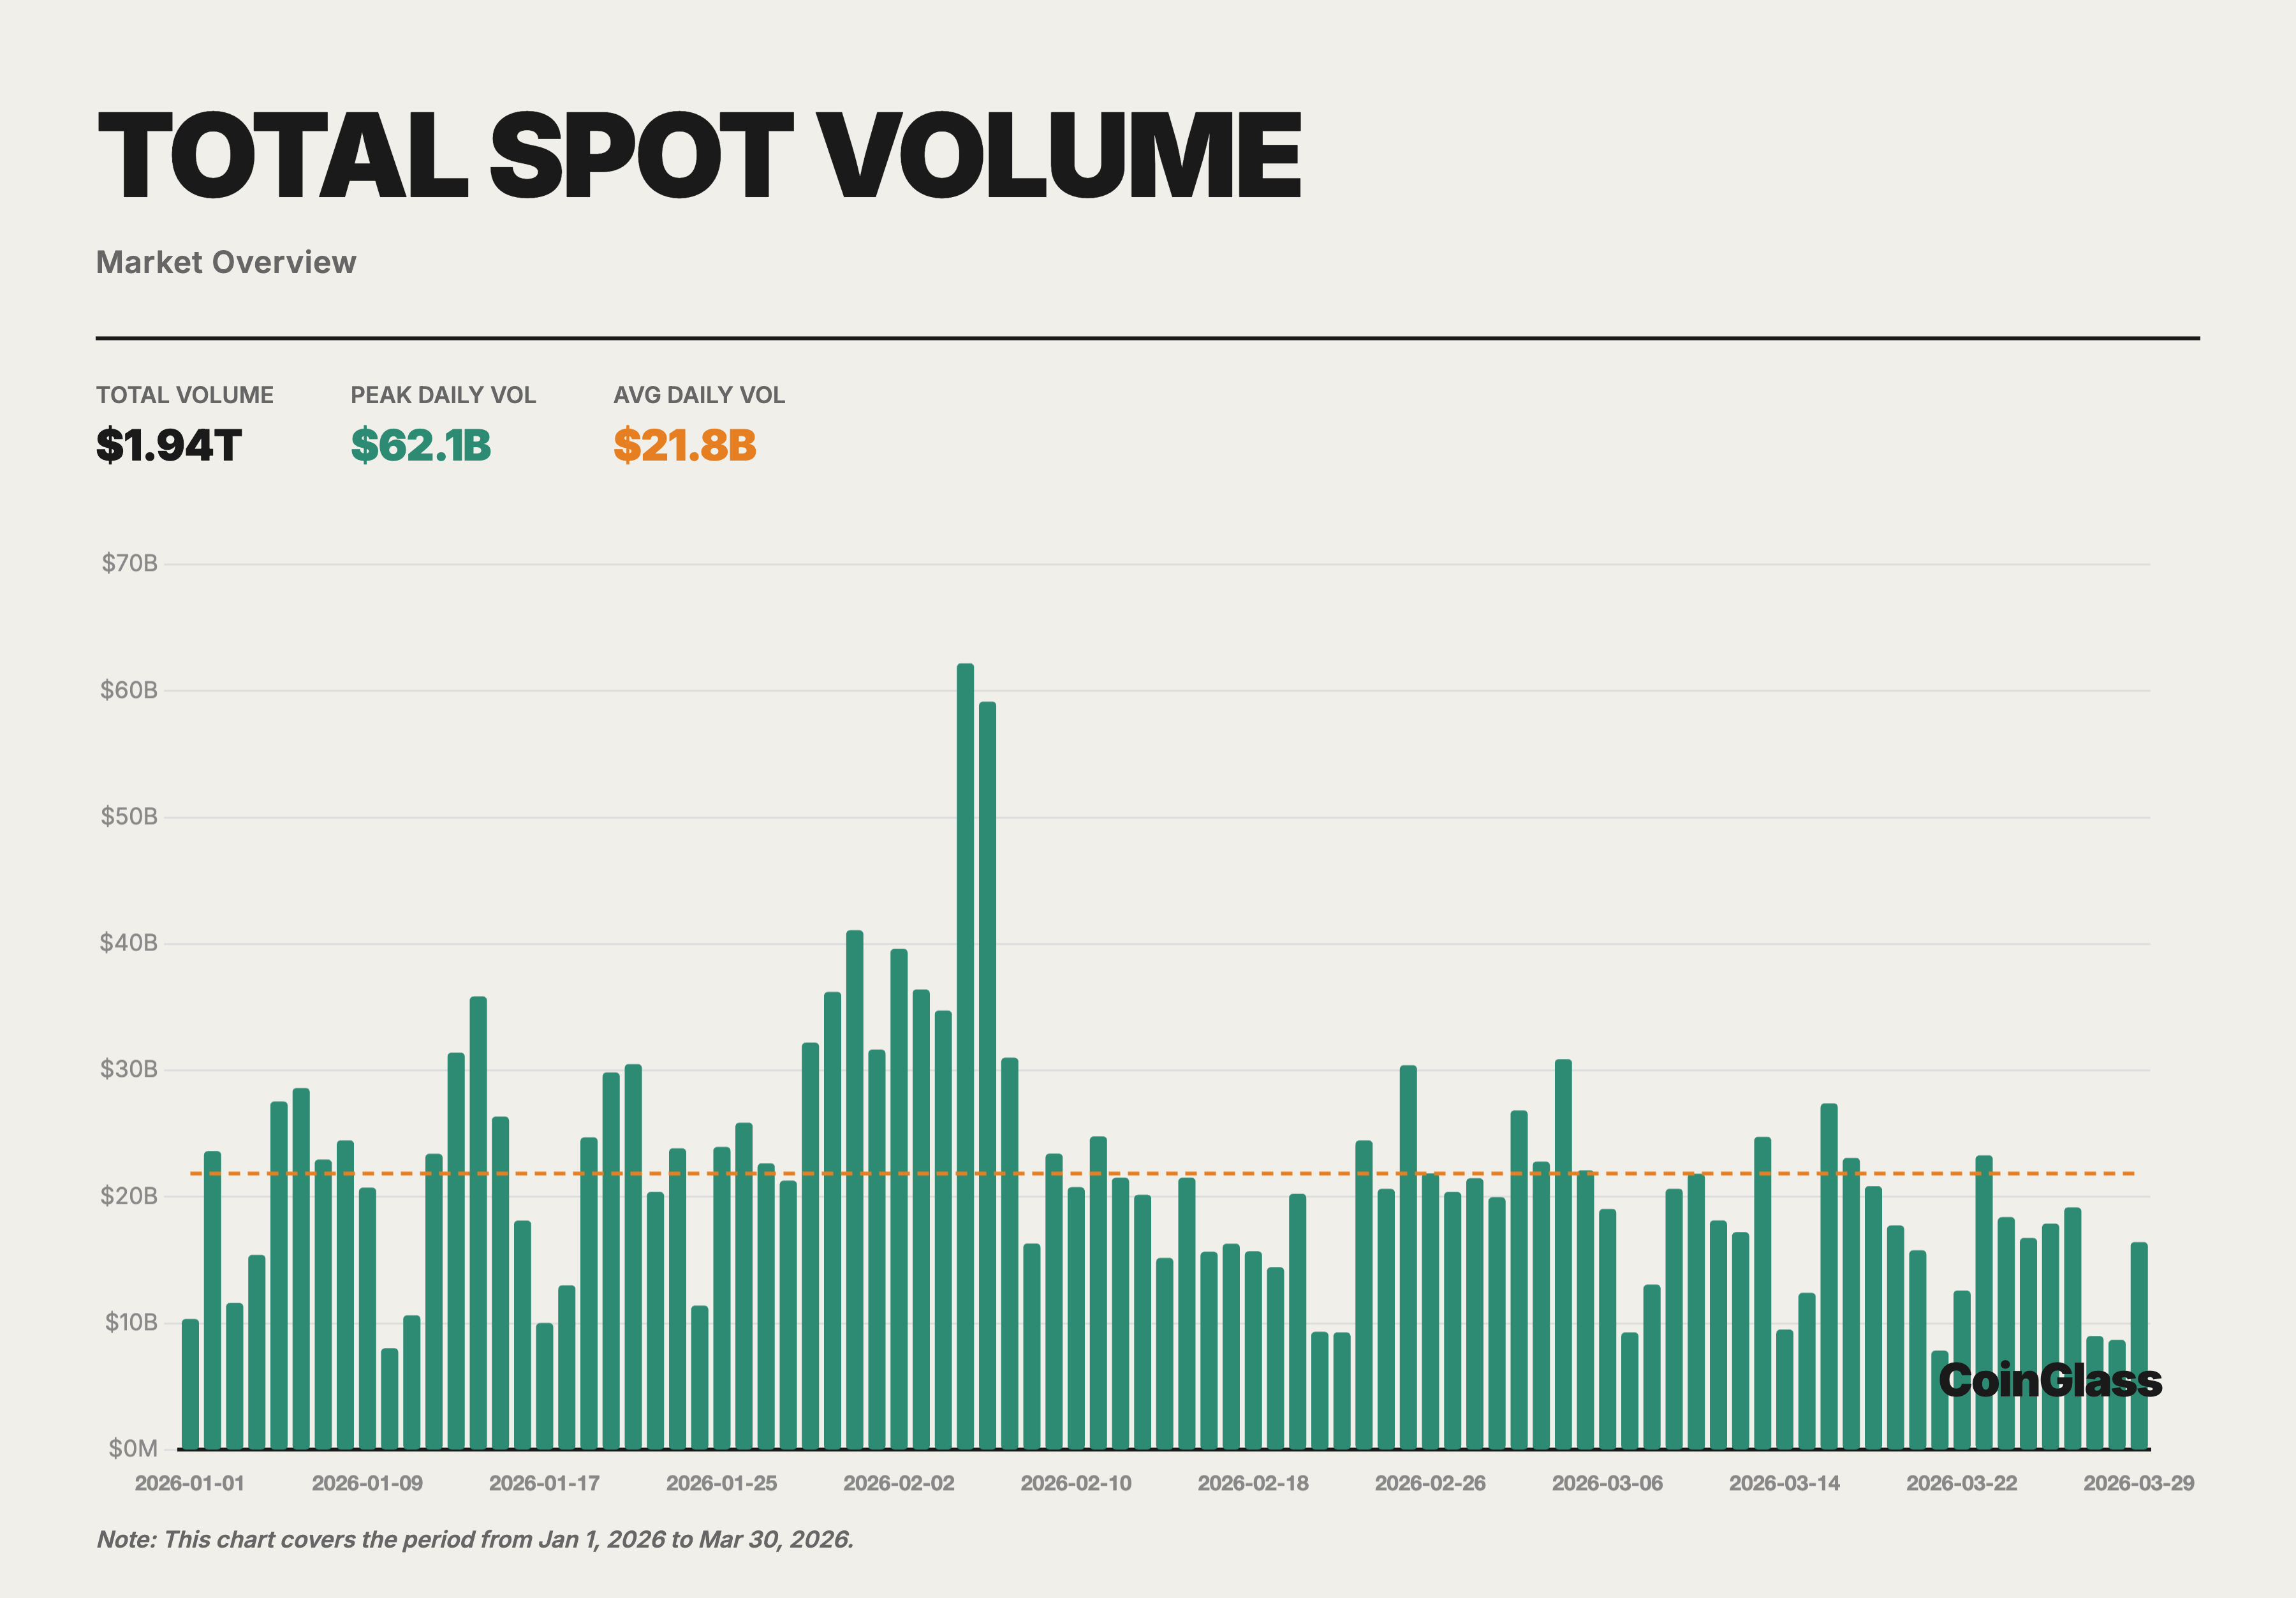
In the first quarter of 2026, the cryptocurrency market maintained a high level of activity overall, but the trading volume gradually retreated from its peak in January. The total spot trading volume for the entire market in Q1 was about 1.94 trillion USD, while the derivatives trading volume was about 18.63 trillion USD, totaling approximately 20.57 trillion USD, with a ratio of derivatives to spot trading of about 9.6 times. Structurally, the market activity remains primarily concentrated in the derivatives market, with a relatively larger shrinkage in spot trading.
In terms of core indicators, Binance continues to lead the industry. The derivatives trading volume was about 4.90 trillion USD, corresponding to a market share of about 34.9% among the Top 10 exchanges; the average daily open interest was about 23.9 billion USD, corresponding to a share of about 29.9%; and user asset accumulation was about 152.9 billion USD, accounting for approximately 73.5% of the major CEX perspective. Compared to the second place, Binance's derivatives trading volume is about 2.2 times that of OKX, with an average open interest about 2.2 times that of Bybit, and the user asset scale is about 9.6 times that of OKX. The data reflects that Binance's leadership is not concentrated in a single dimension, but is manifested in trading, open interest, liquidity, and fund retention across four aspects.
From the Top 5 competitive landscape, the market has formed a relatively clear hierarchical structure. In terms of derivatives trading volume, Binance, OKX, Bybit, Gate, and Bitget rank as the top five, with Bybit and Gate being close in size, and OKX still being the centralized platform closest to Binance; in terms of open interest, the second tier is ranked as Bybit, Gate, OKX, and Bitget. In terms of user asset accumulation, only OKX maintains a level above 10 billion USD after Binance, while Gate, Bitget, and Bybit are all in the range of 5 to 7 billion USD. Overall, competition within the Top 5 is relatively robust, but there remains a considerable gap between the leading platform and the subsequent tiers.
II. Spot and Derivatives Trading Volume
2.1 Overview of Overall Market Monthly Trading Volume
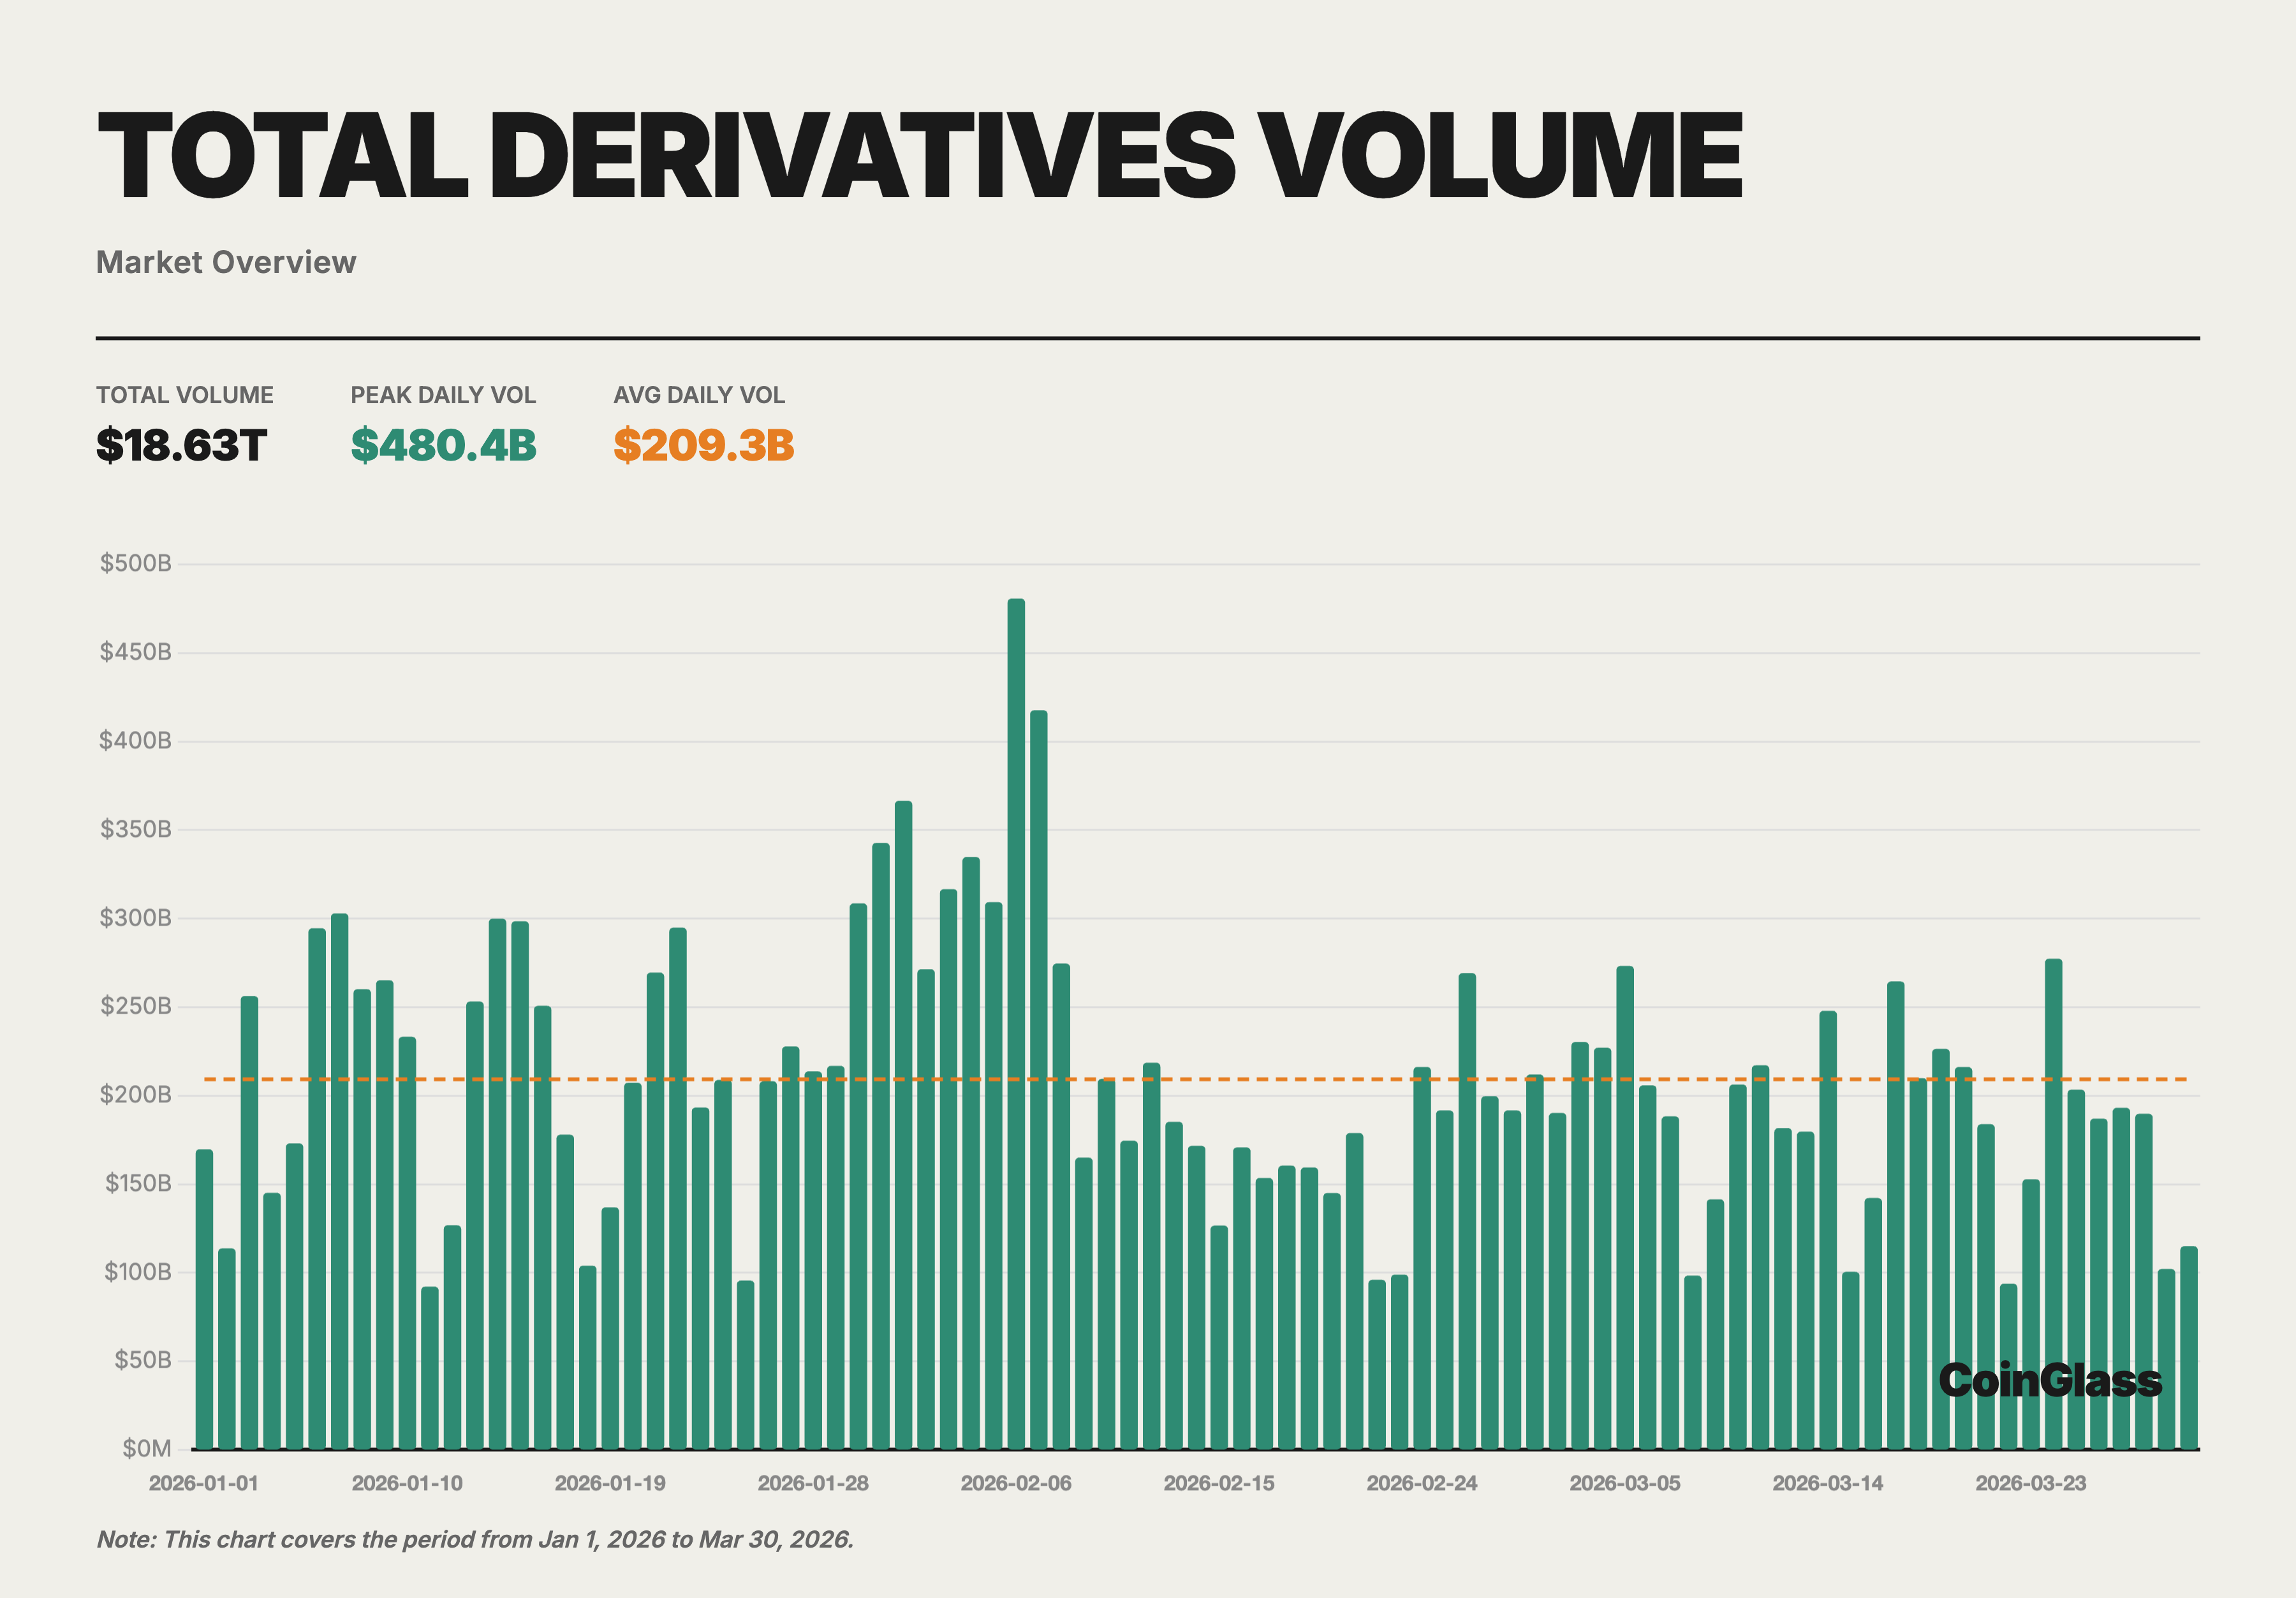
In Q1 2026, the total trading volume of cryptocurrencies in the entire market (spot + derivatives) was about 20.57 trillion USD, with spot trading around 1.94 trillion USD and derivatives trading around 18.63 trillion USD. From the monthly distribution, January had the highest total trading volume (spot 704.7 billion + derivatives 6.73 trillion), with a slight decline in February and further contraction to a quarterly low in March. This trend corresponds to the cautious sentiment in the global macro environment at the same time, as the market, after experiencing severe deleveraging in Q4 2025, has not fully restored its risk appetite.
The average daily trading volume in the spot market was about 21.8 billion USD, while the average daily trading volume in the derivatives market was about 209.3 billion USD. The ratio of derivatives to spot remained stable at approximately 9.6 times in Q1, slightly higher than the average level for the whole of 2025. This indicates that during the market adjustment phase, traders tend to hedge and engage in short-term speculation through derivatives rather than making directional allocations in the spot market.
2.2 Spot Trading Volume and Market Share
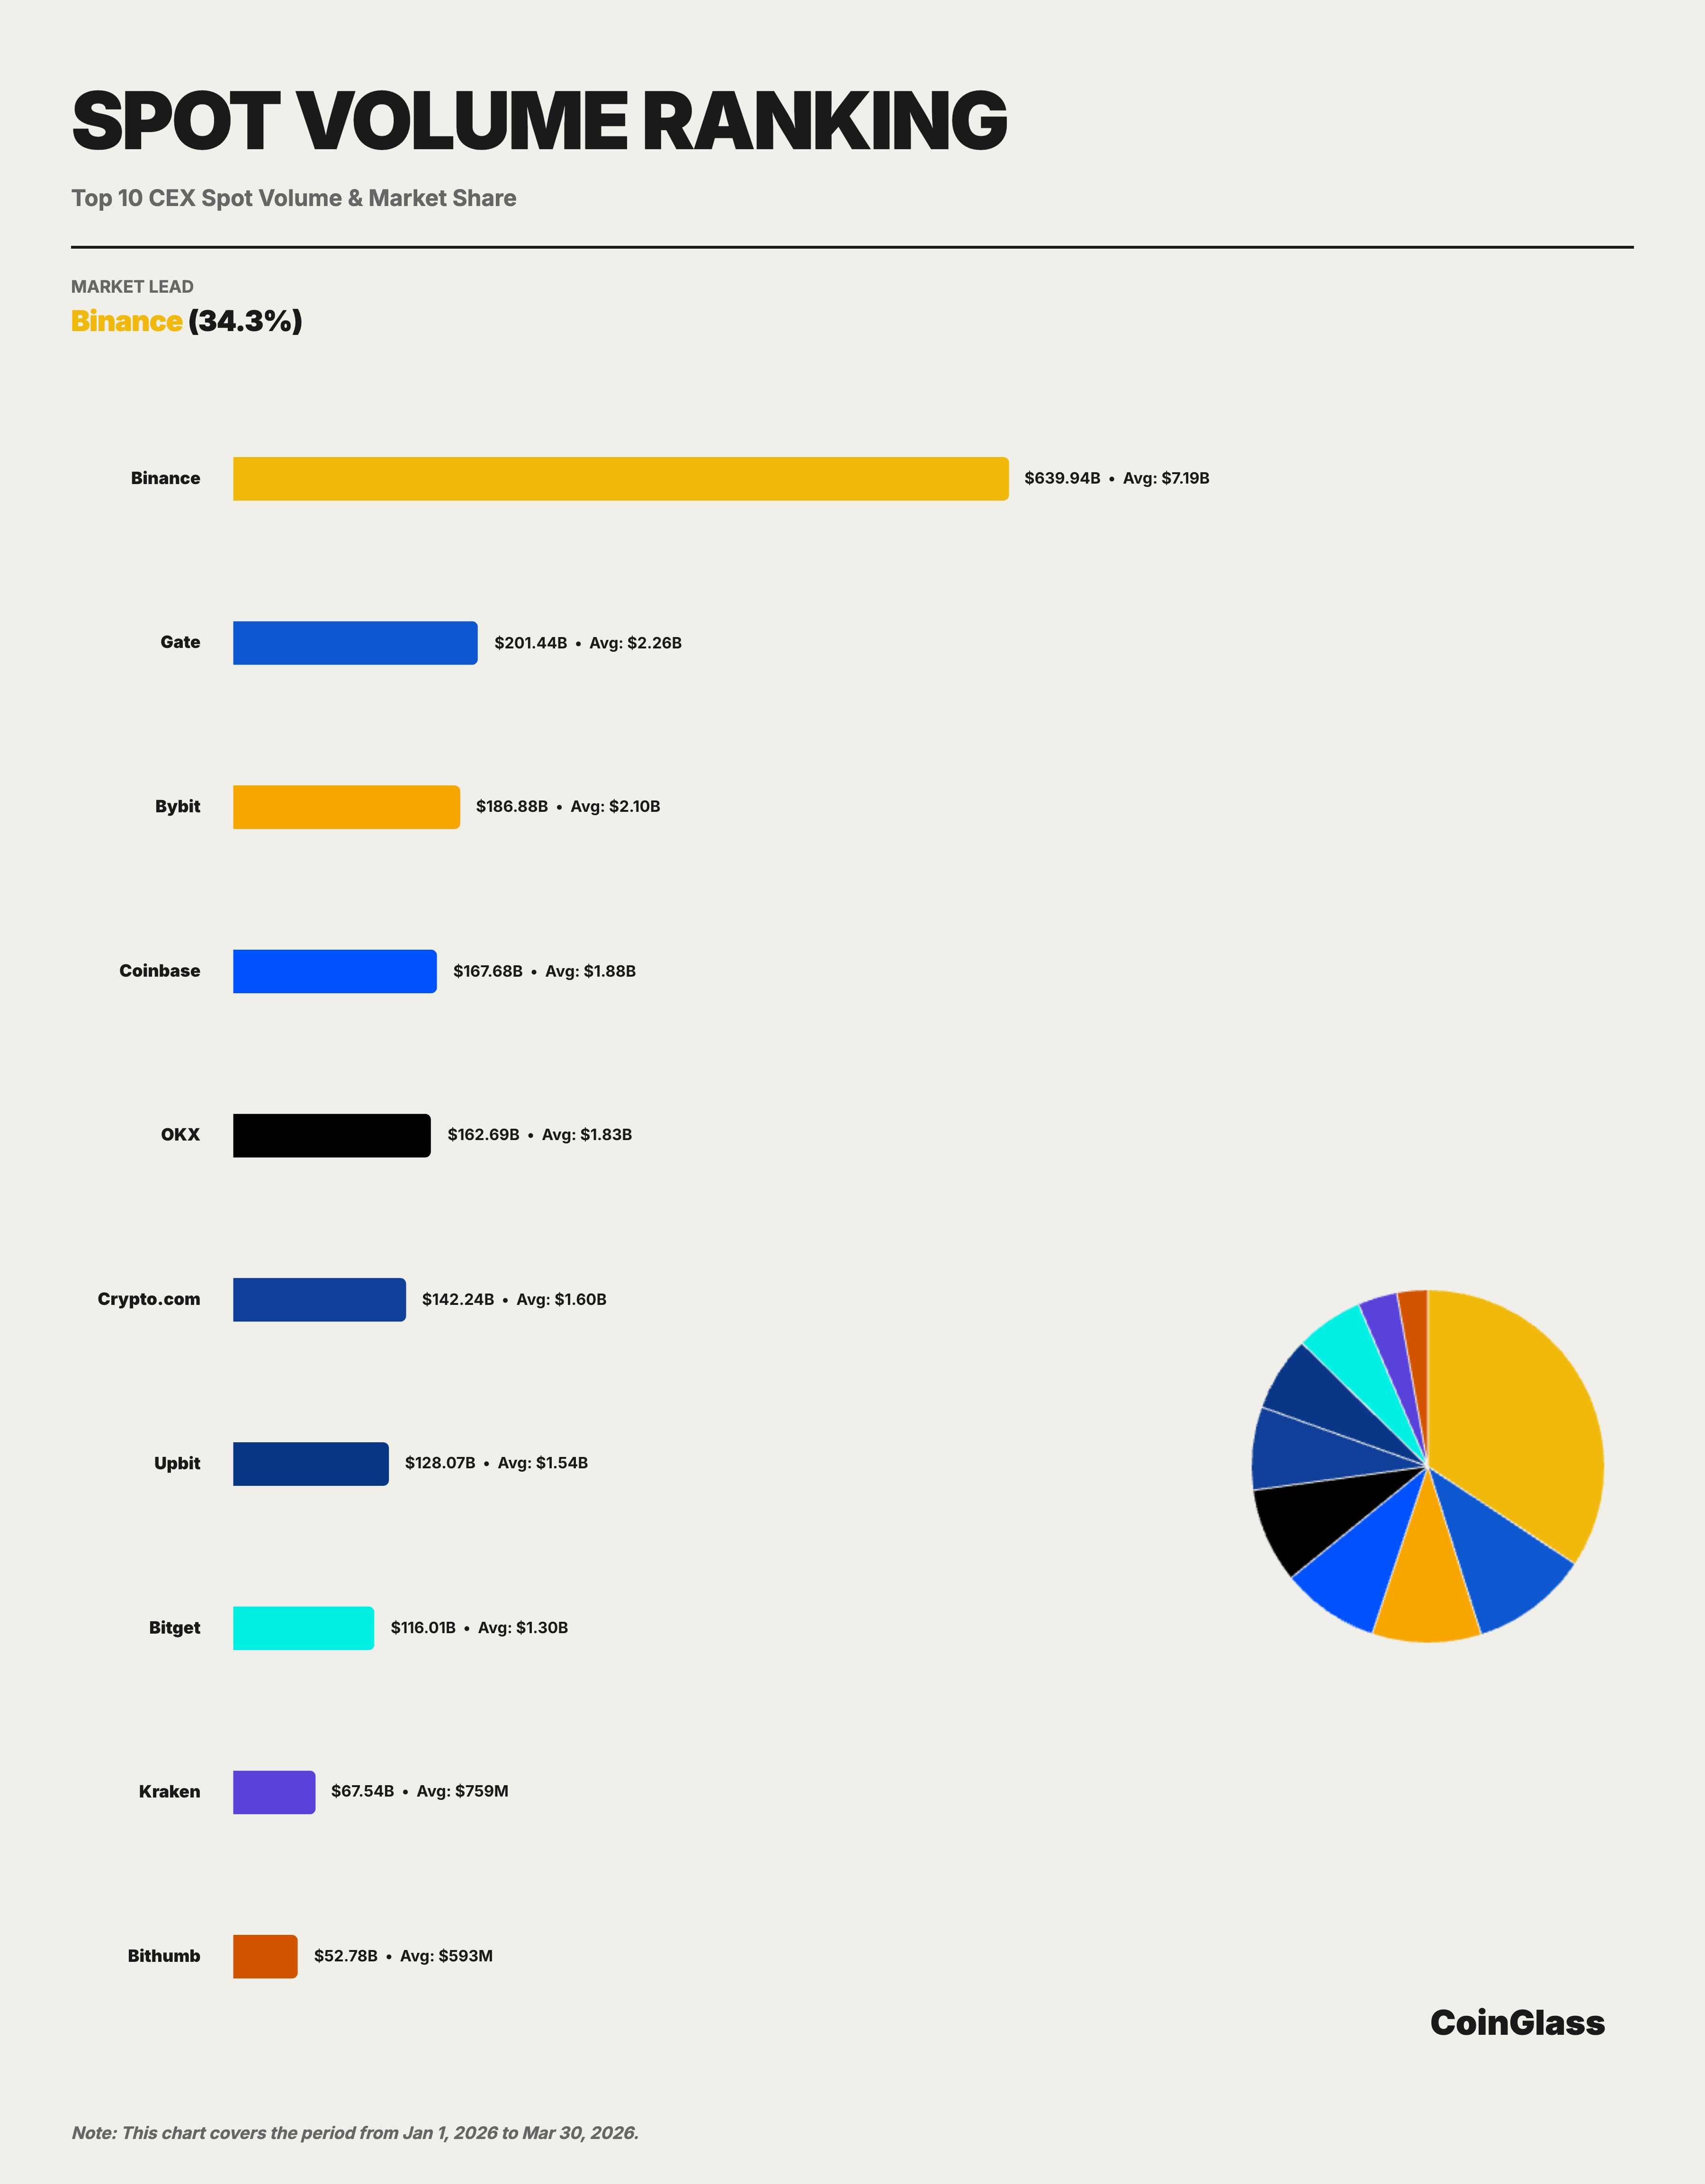
In Q1, Binance's cumulative trading volume in the spot market was about 639.9 billion USD, corresponding to an average daily trading volume of about 71.9 billion USD, with a market share of approximately 34.3% according to the Top 10 statistical standard. From the monthly trend, Binance's share in the Top 10 spot exchanges remained stable overall: 34.0% in January, 33.7% in February, and rising to 35.4% in March. Although the total market volume shrank from 704.7 billion USD in January to 542.0 billion USD in March, a decrease of 23%, Binance's share actually increased slightly. This indicates that although the spot market has generally declined, the leading liquidity continues to concentrate on a few platforms.
If we expand the competitive landscape to the Top 5, the distribution in the spot market is noticeably more dispersed than in the derivatives market. The cumulative spot trading volume ranked among the top five platforms in Q1 were Binance, Gate, Bybit, Coinbase, and OKX, with corresponding trading volumes of about 639.9 billion, 201.4 billion, 186.9 billion, 167.7 billion, and 162.7 billion USD. According to the overall market perspective, excluding Binance, the other four platforms' shares are roughly distributed in the 8% to 10% range. In other words, Binance's leadership in the spot market is evident, but compared to the derivatives market, the distribution of the second tier in the spot market is more balanced and competition is more dispersed.
2.3 Derivatives Trading Volume and Market Share
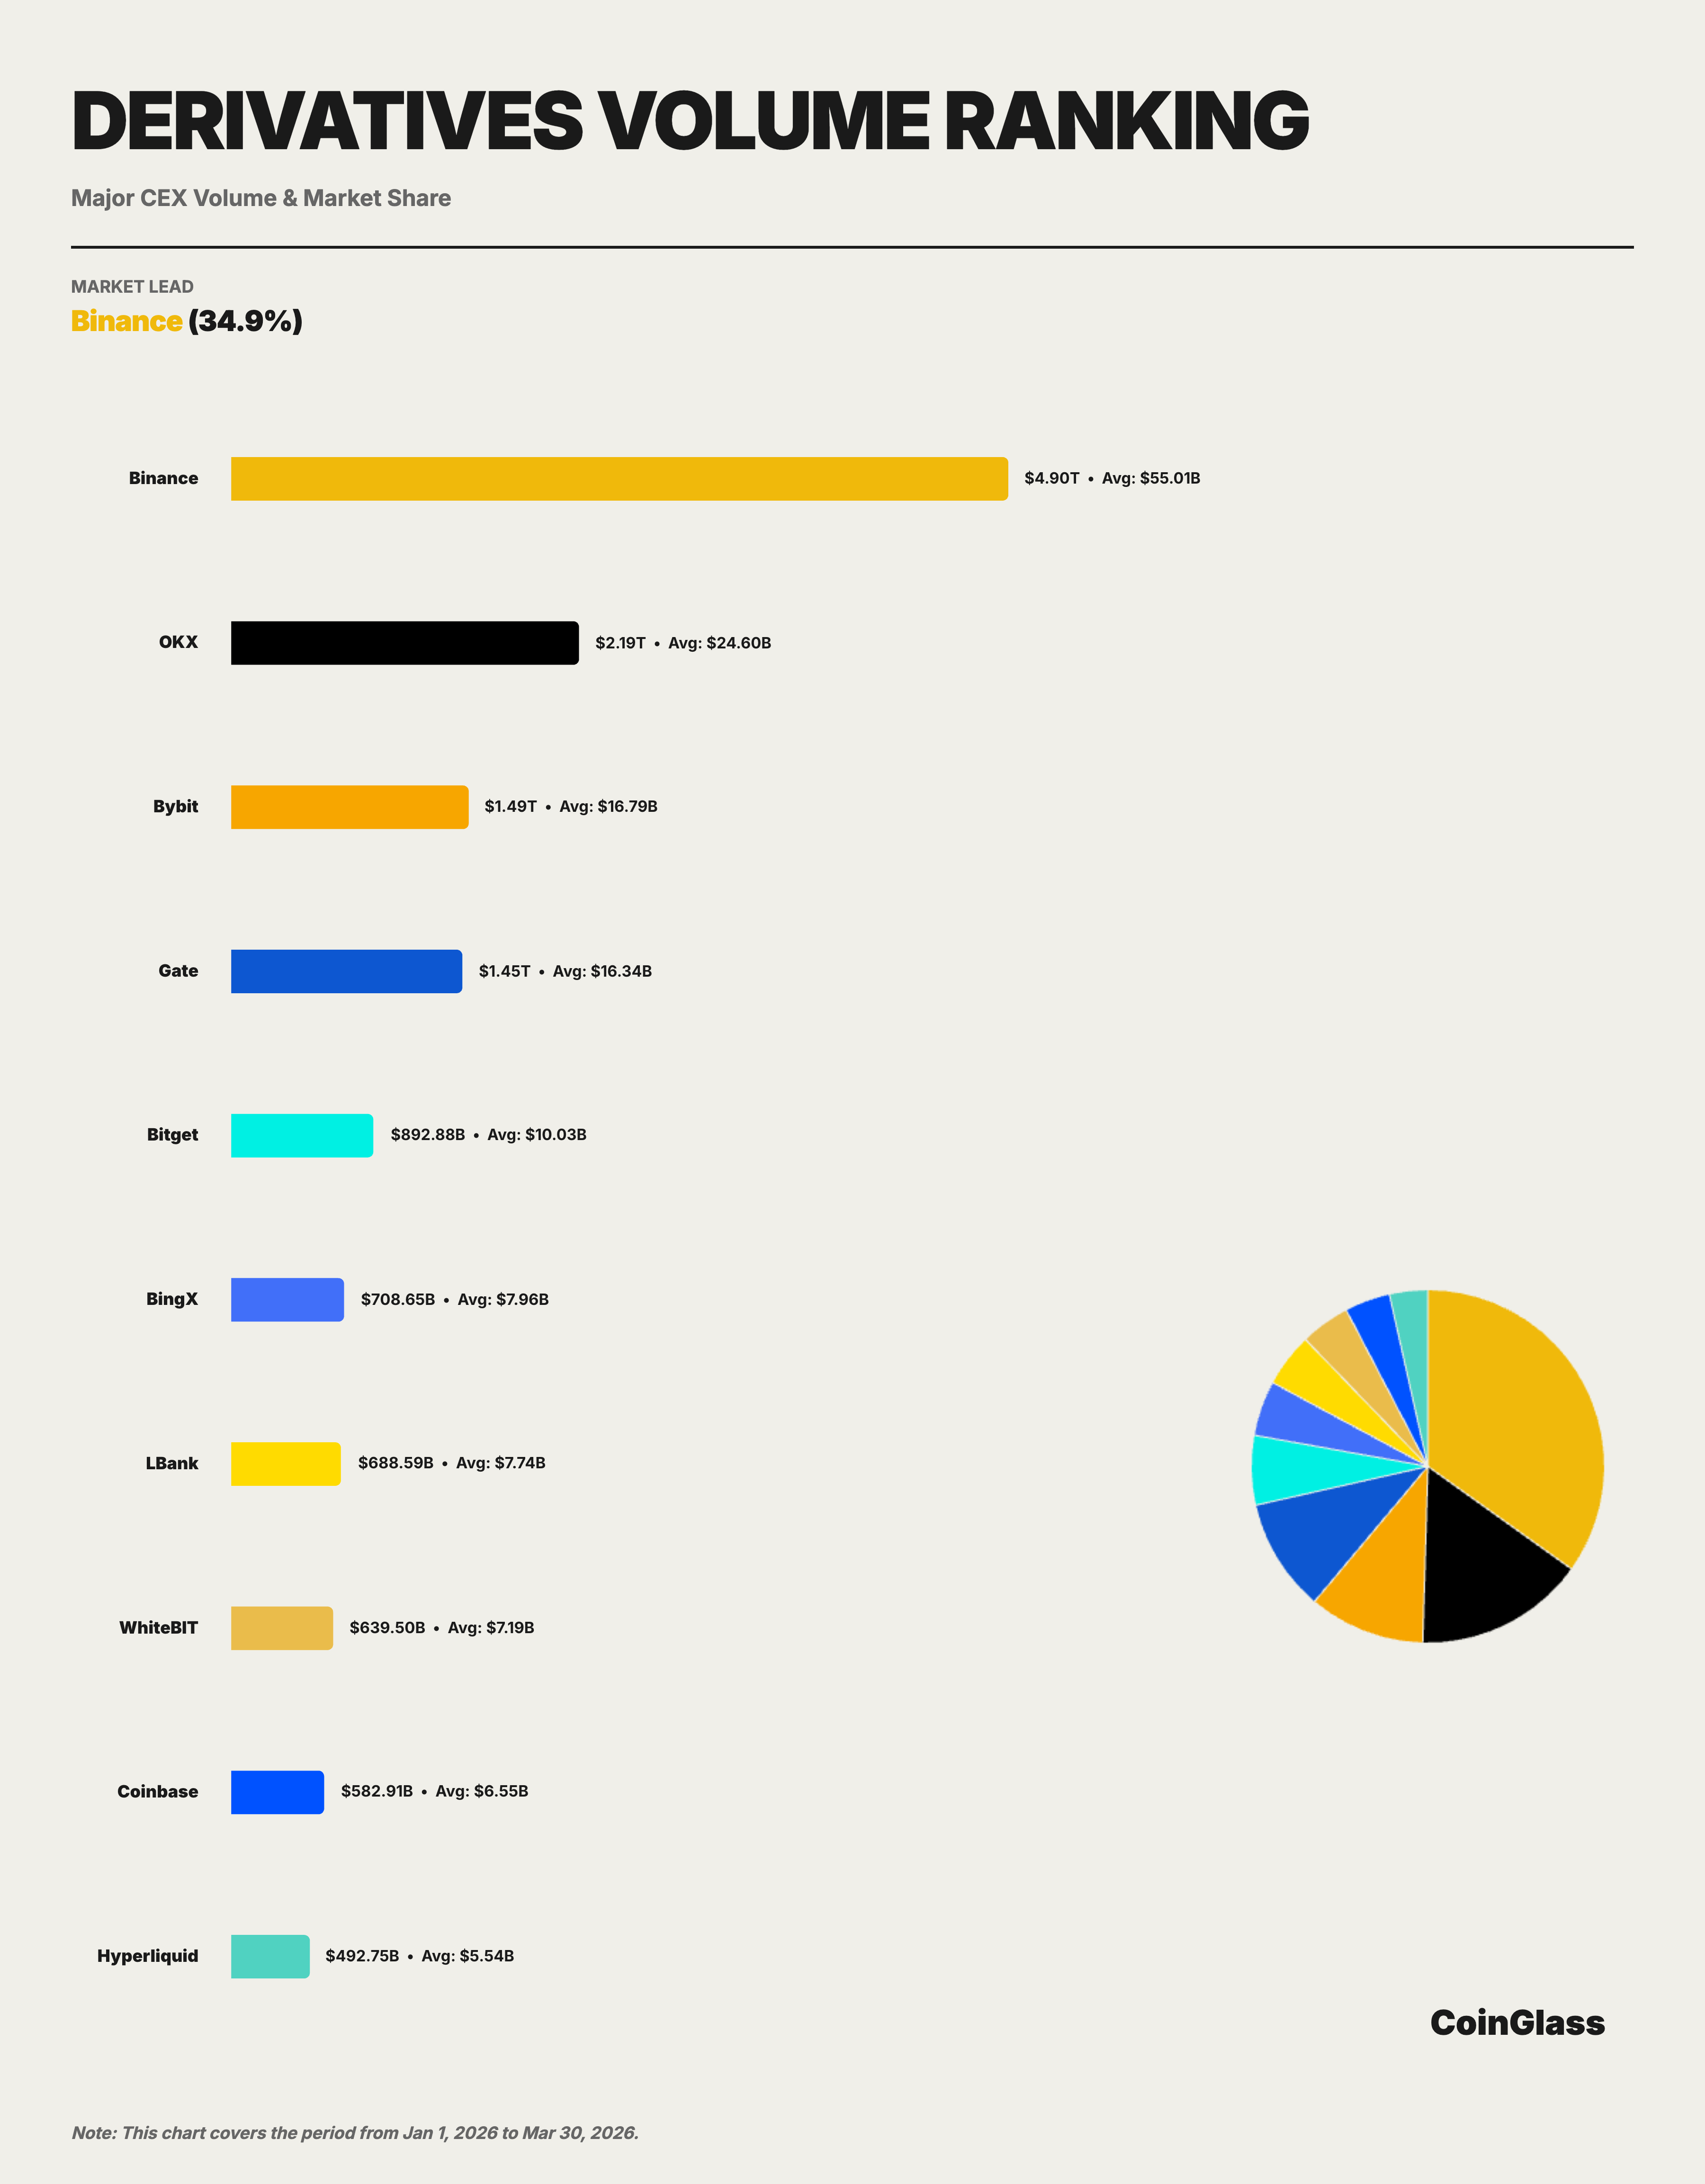
In Q1, Binance's cumulative trading volume in the derivatives market was about 4.90 trillion USD, with an average daily trading volume of about 55 billion USD. Under the Top 10 exchanges' statistical standard, Binance firmly held the first place with a share of 34.9%, surpassing the combined trading volume of OKX (2.19 trillion USD) and Bybit (1.49 trillion USD).
From the monthly trend, Binance's trading share among the Top 10 derivatives exchanges remained relatively stable: 33.2% in January, rising to 35.8% in February, and maintaining at 35.7% in March. This downward then recovery trajectory aligns with the process where market liquidity returned to the leading platforms after the deleveraging impact in Q4 2025. In other words, while trading volume among platforms was briefly dispersed at the beginning of the quarter, as the market gradually stabilized, liquidity continued to flow back to the platforms with deeper liquidity and stronger execution efficiency; Binance demonstrated a stronger capacity to absorb this liquidity during the recovery.
OKX is currently the centralized platform closest to Binance, but its trading volume is still only about 45% of Binance's; Bybit and Gate are close in size, forming the middle of the second tier; Bitget, while consistently in the top five, has shown a noticeable gap from the top four. Measured by relative scale, Binance's derivatives trading volume is about 3.3 times that of Bybit, 3.4 times that of Gate, and 5.5 times that of Bitget.
2.4 Comparison of Competitive Landscape
When observing spot and derivatives within the same framework, it is evident that the competitive landscape differs significantly between the two types of markets. In the spot market, Binance maintains its lead, but the second tier is formed by Gate, Bybit, Coinbase, and OKX, with relatively close shares; in the derivatives market, Binance’s lead is larger, and a certain hierarchy has emerged between the second place OKX and the third and fourth places. Thus, it can be seen that Binance's leadership in the derivatives market is more concentrated, while the spot market shows a structure of "leading first, second tier dispersed".
From the perspective of platform positioning, OKX firmly holds second place in terms of derivatives trading volume, being the closest challenger to Binance; the competition between Bybit and Gate is closer to the same tier, with the former having a strong presence among global active traders, while the latter maintains a significant presence in trading volume and open interest. After the Top 5, BingX, LBank, WhiteBIT, Coinbase, and Hyperliquid still maintain considerable trading activity, but overall magnitude remains lower compared to the top five platforms.
It is noteworthy that decentralized derivatives platforms have entered the mainstream comparative view. Hyperliquid's derivatives trading volume in Q1 was about 492.7 billion USD, ranking in the top ten and achieving an average open interest of about 6 billion USD. This suggests that on-chain derivatives are no longer just marginal supplements but are beginning to form real competition in certain markets. However, from the current scale, its total size is still significantly lower than that of leading centralized platforms such as Binance, OKX, Bybit, and Gate.
III. Derivatives Open Interest
3.1 Overall Market Contract Open Interest Trends
In Q1 2026, the average daily open interest in the overall market for derivatives was about 117.2 billion USD, with a peak occurring on January 15 at approximately 152.5 billion USD. From the monthly trend, January's average open interest was about 141.1 billion USD, dropping significantly to 102.6 billion USD in February, a decrease of about 27%, before slightly rebounding to 106.0 billion USD in March.
3.2 OI Share and Ranking Changes
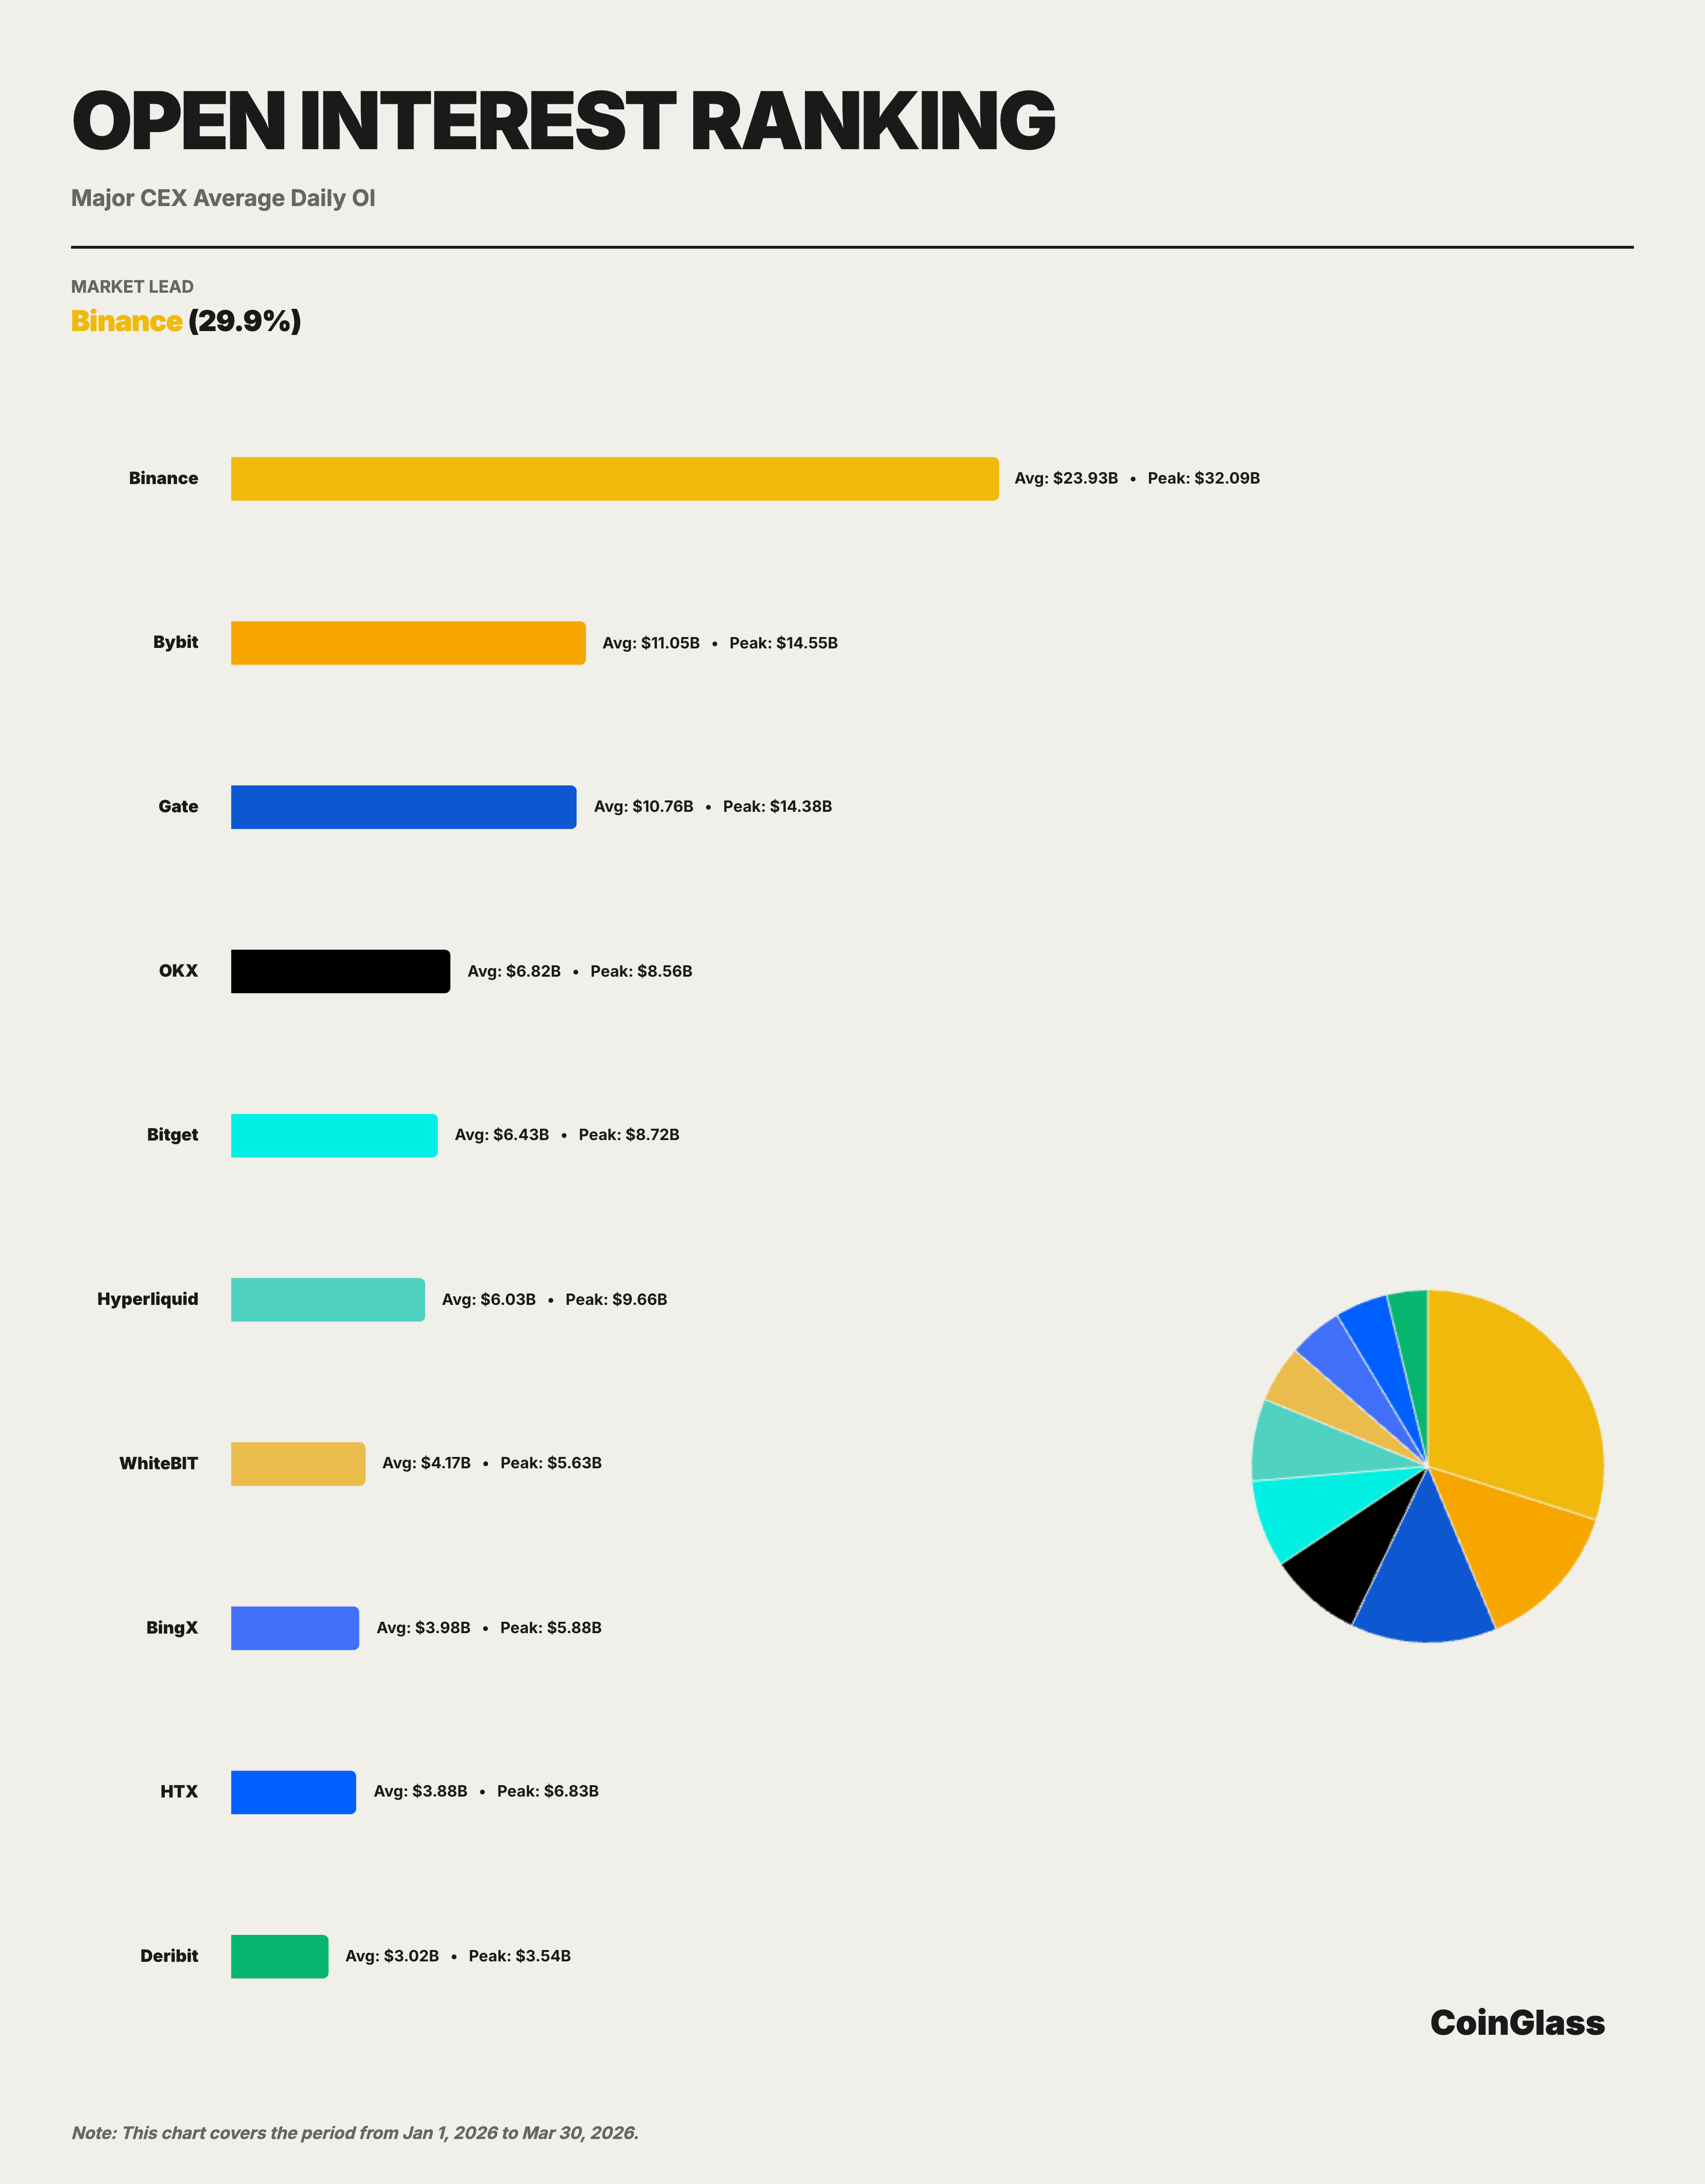
In Q1, Binance's average open interest was about 23.9 billion USD, corresponding to a share of about 29.9% among the Top 10 exchanges, ranking first. The second to fifth places were occupied by Bybit, Gate, OKX, and Bitget, with average open interests of about 11.0 billion, 10.8 billion, 6.8 billion, and 6.4 billion USD respectively. Binance's average open interest is roughly 2.2 times that of Bybit, 2.2 times that of Gate, 3.5 times that of OKX, and 3.7 times that of Bitget, indicating a clear lead.
Binance's OI share remained within the range of 20% to 21% (across the overall market) throughout the quarter, showing limited fluctuation, which indicates a solid market position in terms of open interest. More importantly, Binance's peak OI was about 32.1 billion USD, about 2.2 times the second-place peak of Bybit (14.5 billion USD), demonstrating Binance's capacity to absorb more positions during heightened market volatility.
3.3 Market Structure Analysis
The structure of the open interest market shows different characteristics compared to trading volume. In terms of trading volume, Binance leads by over 19 percentage points; however, in terms of open interest, the gap between Binance (29.9%), Bybit (13.8%), Gate (13.4%), and OKX (8.5%) is narrower. This reflects that different platforms have their own competitive advantages in attracting long positions.
The open interest scale of Hyperliquid is particularly noteworthy. Its average OI is about 6 billion USD, with a peak close to 9.7 billion USD, approaching Bitget and surpassing platforms like WhiteBIT and BingX. The improvement of on-chain platforms in terms of open interest indicates that their appeal in high leverage and strategic trading continues to strengthen. In the short term, this trend is not enough to shake Binance's leading position, but for second-tier platforms, the entry of on-chain competitors is raising the complexity of future share competition. As an on-chain derivatives protocol, its rapid growth in open interest further confirms the judgment from the 2025 annual report regarding the "shift of decentralized derivatives from concept validation to actual market share competition."
IV. Liquidity Depth
This chapter's data is based on order book snapshot data, comparing the main platforms' ±1% bilateral depth in both the BTC and ETH spot and contract markets. Compared to trading volume and open interest, depth more directly reflects a platform's real capacity to execute large transactions, thus serving as an important criterion for assessing whether the "quality leadership" of leading platforms is established.
4.1 BTC Market Depth
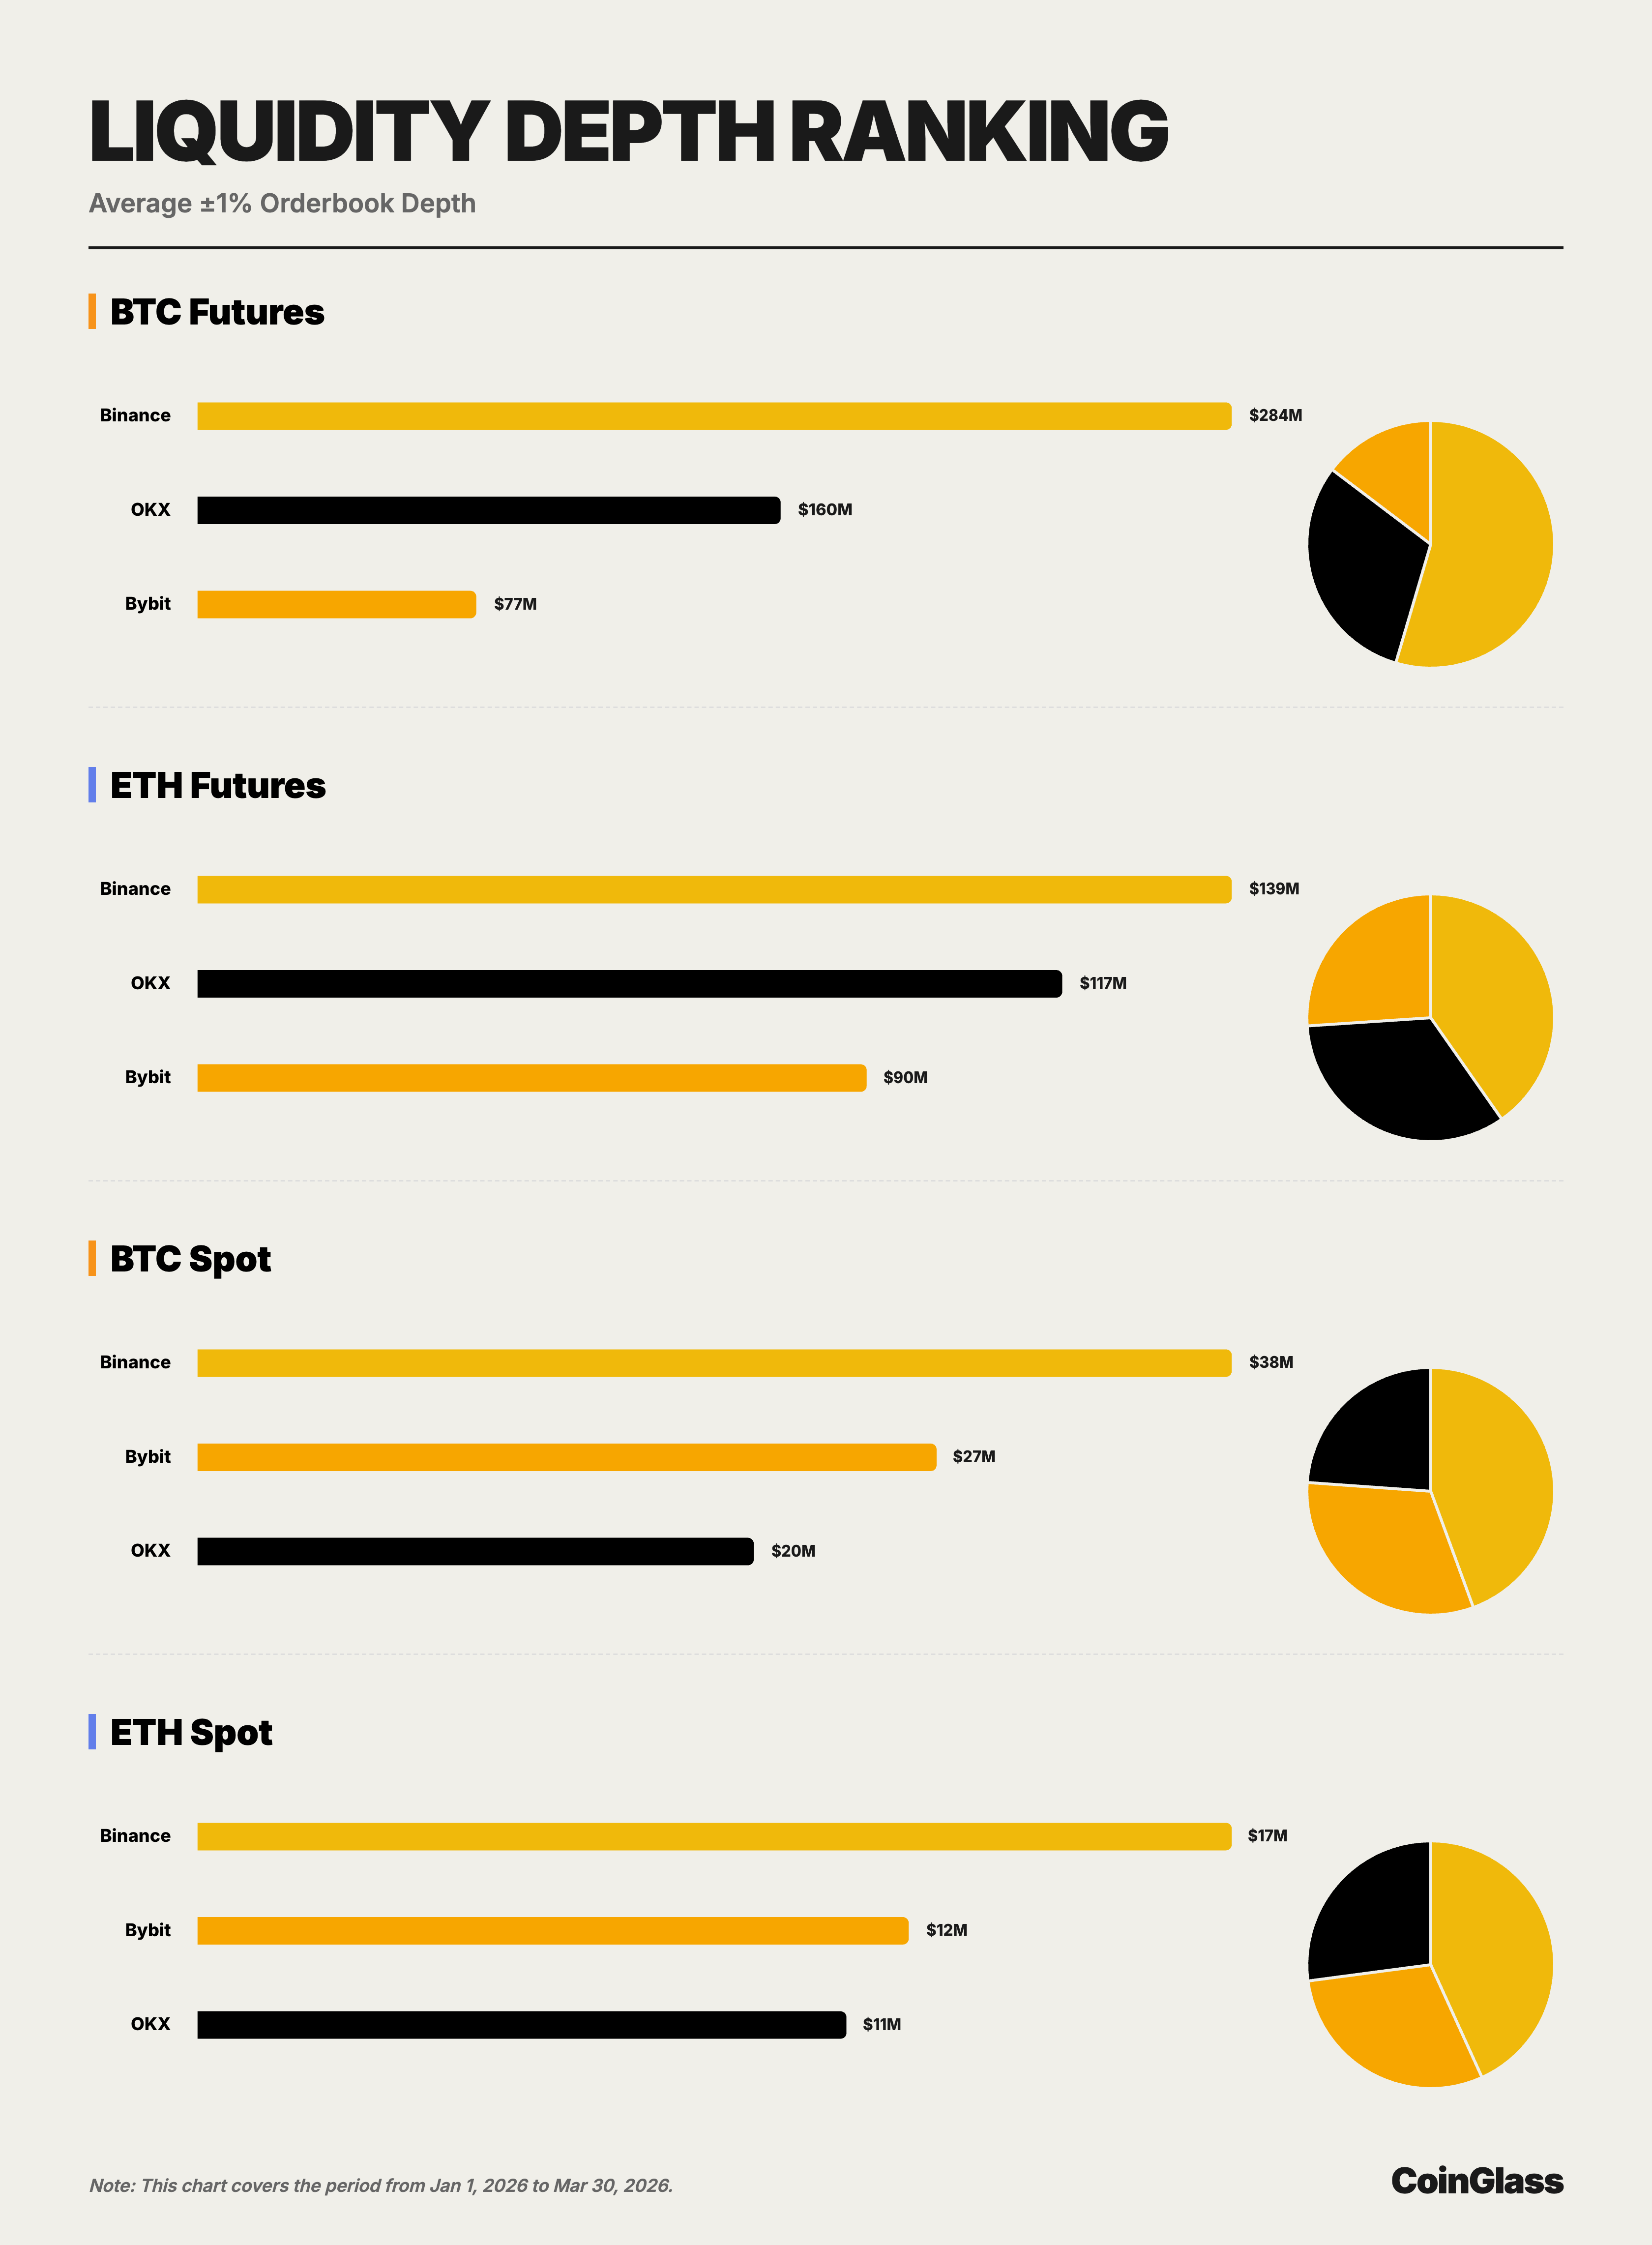
In the BTC contract market, Binance, OKX, and Bybit's average ±1% bilateral depth is approximately 284 million USD, 160 million USD, and 76.55 million USD, respectively. Binance's depth is about 1.8 times that of OKX and 3.7 times that of Bybit, maintaining a significant lead. From the perspective of institutional trading, this means Binance can handle larger orders without excessively increasing impact costs, providing direct execution value.
In the BTC spot market, Binance, Bybit, and OKX's average ±1% bilateral depth is approximately 37.54 million USD, 26.82 million USD, and 20.18 million USD, respectively. Unlike the contract market, Bybit occupies the second place in BTC spot rather than OKX, but Binance is still about 40% higher than Bybit and about 86% higher than OKX. This shows that Binance is in the first position in both the BTC spot and contract markets, while the second-place platform varies between different sub-markets.
4.2 ETH Market Depth
In the ETH contract market, Binance, OKX, and Bybit's average ±1% bilateral depth is approximately 139 million USD, 117 million USD, and 90.15 million USD, respectively. Compared to BTC contracts, the head-to-head competition in the ETH contract market is closer, with the gap between OKX and Binance narrowed to about 16%, while the gap between Bybit and Binance is about 35%. Nevertheless, Binance still maintains the lead, indicating that its advantage exists not only in BTC but also continues in the ETH contract market.
In the ETH spot market, Binance, Bybit, and OKX's average ±1% bilateral depth is approximately 16.84 million USD, 11.58 million USD, and 10.57 million USD, respectively. Similar to the BTC spot market, the second place is still held by Bybit, but Binance is about 45% higher than Bybit and about 59% higher than OKX. As a result, Binance ranks first in all four core sub-markets, while the second place alternates between OKX and Bybit, further illustrating that Binance's advantage is broader, rather than concentrated in a specific asset or market.
4.3 The Relationship Between Depth and Trading Volume
From the execution capability perspective, depth often more accurately measures a platform's true liquidity quality than trading volume. Q1 data shows that Binance not only leads in spot and derivatives trading volume but also possesses the best depth in major trading scenarios for both BTC and ETH. OKX showcases more competitive depth in derivatives, while Bybit performs closer in spot depth, but currently, no platform exerts comprehensive pressure on Binance across all four core sub-markets, indicating that Binance's lead has strong structural stability.
V. User Asset Accumulation
5.1 Asset Reserve Scale and Change Trends
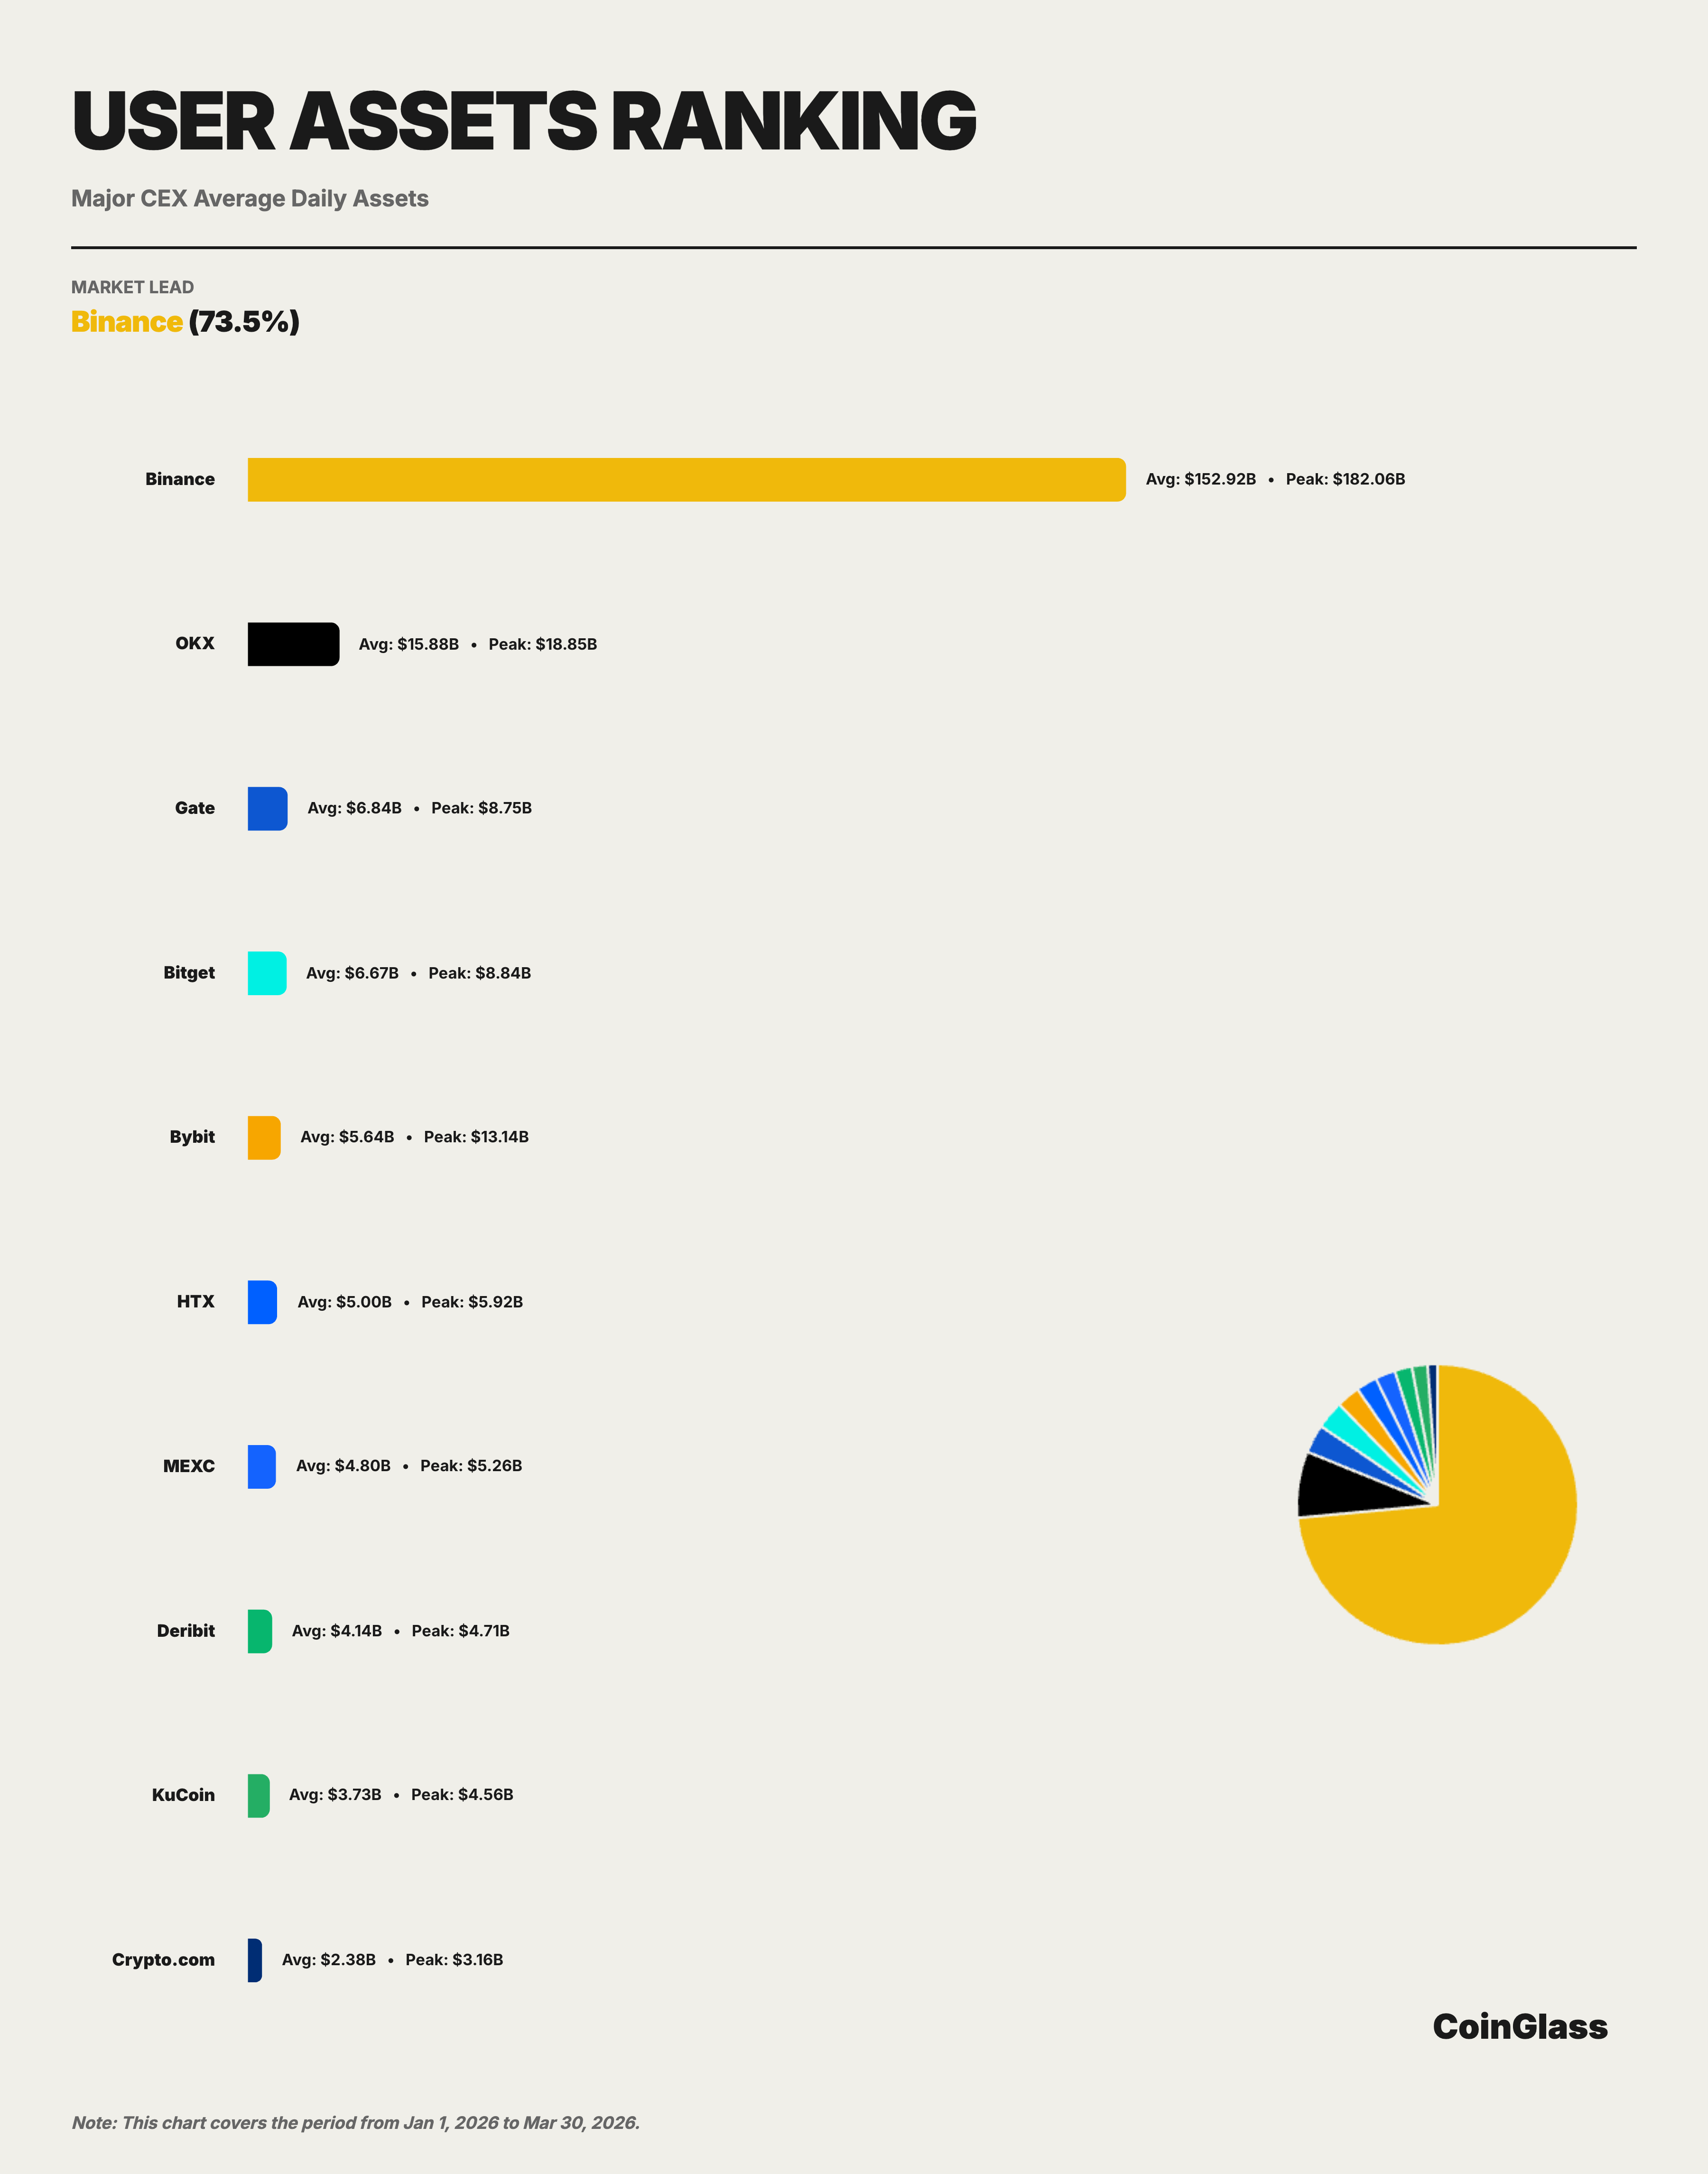
In Q1 2026, Binance's average custodial assets were approximately 152.9 billion USD, accounting for about 73.5% of the Top 10 exchanges' market share. This ratio is significantly higher than Binance's trading volume share (approximately 34.9%) and open interest share (approximately 29.9%), indicating that Binance's concentration in terms of asset custody is much higher than in trading activities. For exchanges, user asset accumulation is often related to brand trust, product ecosystem, on-chain and off-chain deposit and withdrawal convenience, and cross-use scenarios of multiple businesses, thus making this metric more reflective of a platform's comprehensive competitive position in the medium to long term.
From the monthly trend, Binance's custodial assets experienced a process of decline followed by stabilization during Q1. In January, the daily average was about 172.7 billion USD, the peak for the quarter, reflecting the inflow of funds under optimistic market sentiment at the beginning of the year; in February, it fell to about 136.4 billion USD, a decrease of about 21%, consistent with the decline in open interest; in March, it slightly rebounded to about 147.8 billion USD, indicating that the fund outflow trend has basically stabilized. The peak during the quarter occurred on January 15, at about 182.1 billion USD.
The Top 5 platforms are Binance, OKX, Gate, Bitget, and Bybit, with average user assets of approximately 152.9 billion, 15.9 billion, 6.8 billion, 6.7 billion, and 5.6 billion USD, respectively. In the major CEX perspective, only OKX maintains a level above 10 billion USD, while the platforms ranked third to fifth are concentrated in the range of 5 to 7 billion USD, overall showing a pattern of "significantly leading first, second is next, and the rest are relatively close."
5.2 Comparison of User Asset Accumulation in Major CEXs
The market concentration of user asset accumulation is much higher than that of trading volume and open interest. Among the Top 10 exchanges, Binance, with 152.9 billion USD, stands alone at the top, while second-place OKX, with an average of about 15.9 billion USD, is only one-tenth of Binance. The third to fifth places are occupied by Gate (6.8 billion USD), Bitget (6.7 billion USD), and Bybit (5.6 billion USD); although these three are close in size, there is a significant magnitude difference compared to Binance—Binance's asset scale is about eight times that of the sum of these three. Binance's average user assets are approximately 9.6 times that of OKX, 22.4 times that of Gate, 22.9 times that of Bitget, and 27.1 times that of Bybit. Compared to its leading position in derivatives trading volume and open interest, Binance's lead in asset accumulation is even greater. This means that Binance's market position is not only reflected in trading activity but also in the platform preference for the prolonged retention of funds. For the industry competitive landscape, such leads typically possess greater stability and are harder to replicate in the short term. This extremely concentrated distribution pattern indicates that Binance plays a role similar to that of "systemic infrastructure" in terms of user fund custody, with its operation and compliance status having a magnifying effect on the robustness of the entire cryptocurrency market.
In the second tier, HTX (5 billion USD), MEXC (4.8 billion USD), Deribit (4.1 billion USD), KuCoin (3.7 billion USD), and Crypto.com (2.4 billion USD) form the long tail.
VI. Comprehensive Analysis and Outlook
Based on data from the four dimensions of trading volume, open interest, liquidity depth, and user asset accumulation, the following core judgments can be made:
First, Binance's market leadership is comprehensive and solid. Binance ranks first in all core dimensions: derivatives trading volume of about 4.90 trillion USD (Top 10 share 34.9%), average OI of 23.9 billion USD (share 29.9%), BTC contract depth of 284 million USD (share 54.6%), and user assets of 152.9 billion USD (share 73.5%). More importantly, Binance's lead in liquidity depth and asset custody dimensions is far greater than in trading volume dimensions, indicating that its status as a core infrastructure of the cryptocurrency market is more robust than what trading volume rankings suggest.
Second, the competitive landscape in the derivatives market is being reshaped. OKX is currently the centralized platform closest to Binance, mainly reflected in derivatives trading volume and contract depth; Bybit is characterized by relatively balanced trading volume, open interest, and spot liquidity performance; Gate maintains a strong presence in derivatives trading and open interest dimensions, but user asset accumulation is relatively weak; Bitget is an important platform among the second tier, consistently holding positions in the top five for derivatives trading volume and open interest. Simultaneously, the derivatives market traditionally dominated by a few leading CEXs is being simultaneously impacted by two forces: one end being regulatory institutional channels represented by CME, and the other being decentralized protocols represented by Hyperliquid. The former primarily attracts hedging and basis trading demands, while the latter appeals to some high-frequency and strategy traders due to its censorship resistance, composability, and 24/7 uninterrupted attribute.
Third, the market overall is cautiously progressing in recovery. Q1's trading volume contracted month by month, and open interest normalized after declining from highs, overall reflecting the recovery characteristics after the extreme events of Q4 2025. As we enter Q2, key variables to watch include the clarification of the Federal Reserve's monetary policy path, changes in capital flows related to the BTC spot ETF, and the progress of regulatory frameworks in major jurisdictions.
免责声明:本文章仅代表作者个人观点,不代表本平台的立场和观点。本文章仅供信息分享,不构成对任何人的任何投资建议。用户与作者之间的任何争议,与本平台无关。如网页中刊载的文章或图片涉及侵权,请提供相关的权利证明和身份证明发送邮件到support@aicoin.com,本平台相关工作人员将会进行核查。


