Original author / Castle Labs
Translation / Odaily Star Daily Golem (@web 3_golem)

Editor's note: This article systematically studies the differences in crude oil contract trading data on Hyperliquid and CME during weekdays and weekends, arriving at some important conclusions. Currently, it appears that Hyperliquid cannot compete with CME in terms of absolute metrics such as liquidity depth or slippage, with overall liquidity being less than 1%, which is related to the fact that the primary users of the RWA trading platform are still crypto-native retail investors.
The difference with Hyperliquid is that during weekends, the scale of crude oil contract trading on Hyperliquid increases significantly.This indicates that beyond retail investors with speculative demands, traders looking to gain crude oil exposure before Monday and conduct hedging operations are also trading on Hyperliquid.This trend is becoming more apparent, making Hyperliquid capable of price discovery in commodity trading.
However, for institutional investors, the high trading costs on the Hyperliquid platform compared to CME remain a major obstacle to its expansion in the commodity trading sector. If Hyperliquid does not improve its ability to handle institutional-level orders soon, it can only serve as a temporary trading venue for traditional traders on weekends, ultimately becoming a minor supplement to the traditional financial landscape.
Research Methodology and Data Sources
This analysis evaluates the microstructure of the crude oil market through two studies, covering market activity on weekdays and weekends, and utilizes tick transaction data from two trading venues, namely the xyz:CL perpetual contract on Hyperliquid and the CLJ6 (April 2026 NYMEX WTI crude oil futures) contract on the Chicago Mercantile Exchange (CME).
The CME data is sourced from the Databento trading data provider, which captures tick transaction data rather than order book snapshots. Therefore, all depth and slippage estimates for CME are based on actual transaction volumes instead of quoted depth. Hyperliquid data comes from the publicly available S3 database of Hyperliquid, which contains complete on-chain transaction records.
Thus, the analysis of both trading venues is based on actual transaction volumes. All depth data represents explicit liquidity, which is the volume within a specific basis point range ±2, ±3, and ±5 around the VWAP mid-price within a 5-minute window, rather than the complete resting depth on the order book.
Research Period and Market Context
The research period spans from February 27 to March 16, 2026, coinciding with the geopolitical turbulence following Iran's attacks on February 28, 2026.
- Pre-attack market close: The last CME trading day before the attack.
- Monday opening: The market reopens under significant pressure, with CME stocks gapping up sharply, while the Hyperliquid xyz:CL market is limited by discovery boundaries.
- Subsequent weekends: With oil prices remaining high, market volatility keeps crude oil trading volumes high on the Hyperliquid platform.
xyz:CL launched at the beginning of 2026, indicating that the observation period of these three weekends covers the early maturity phase of the Hyperliquid market. The observed trends, including improved liquidity depth, increased trading volume, and user growth, partially reflect the market's maturation. However, we believe that on-chain exchanges currently cannot compete with traditional exchanges in absolute metrics such as liquidity depth or slippage.
The goal of our study is to trace directional trends: whether the price spread between the two is narrowing, how quickly it is narrowing, and under what conditions it is narrowing.
Data Analysis
The data analysis is divided into two parts by time period:
- Weekday periods: Covering a full three-week period, comparing the depth, slippage, and premium/discount of trades between Hyperliquid and CME during weekday periods. For Hyperliquid, we also analyze its financing rates throughout the period.
- Weekend periods: Within the given timeframe, including three weekends, we analyze price discovery and the price gap bias of Hyperliquid relative to CME open prices.
Weekday Period Data Analysis
This analysis covers a full three-week period, focusing on periods when both exchanges are active simultaneously.
Liquidity depth is measured by the dollar volume within the VWAP mid-price ±2, ±3, and ±5 basis point ranges in each 5-minute interval, summarized as the median across all weekday intervals. As mentioned, this reflects the transaction volume within the interval rather than resting quote depth. This method may underestimate the liquidity depth of CME and Hyperliquid.
Execution slippage is estimated using a synthetic order book sorted by execution price. In each 5-minute interval, observed execution records of market orders are arranged in ascending price order (simulating aggressive sell orders), and sell orders are walked through in sequence until the target order size is reached. The 'arrival price' is set as the lowest transaction price during that interval (representing the best sell price at which the order arrived). Slippage is calculated as the difference between the execution volume weighted average price (VWAP) and the arrival price, expressed in basis points. This method is applied to incremental order sizes from 10,000 to 1,000,000 dollars.
The Hypeliquid-CME basis during weekday periods: Tracks the signed price difference between the mid-price on Hyperliquid and the last price on CME within a 5-minute window across all weekday intervals. This reflects any structural premium or discount on Hyperliquid relative to CME's reference price during active periods. The mid-price on Hyperliquid is derived from the volume-weighted average price (VWAP) of trades executed within each 5-minute trading period, rather than real-time order book quotes.
The Hyperliquid financing rate is priced hourly, expressed in basis points per hour.
Weekend Period Data Analysis
This analysis focuses on three different weekend closure periods of CME:
- W1: February 28 to March 1, 2026
- W2: March 7 to March 8, 2026
- W3: March 14 to March 15, 2026
In W1 and W2, the Hyperliquid perpetual contract was restricted, thus the marking price could not exceed the “range limit boundary” (DB). When the oracle price freezes (for example, when the main reference market (CME) is closed and external price data sources stop updating), the protocol effectively constrains the price to a narrow range.
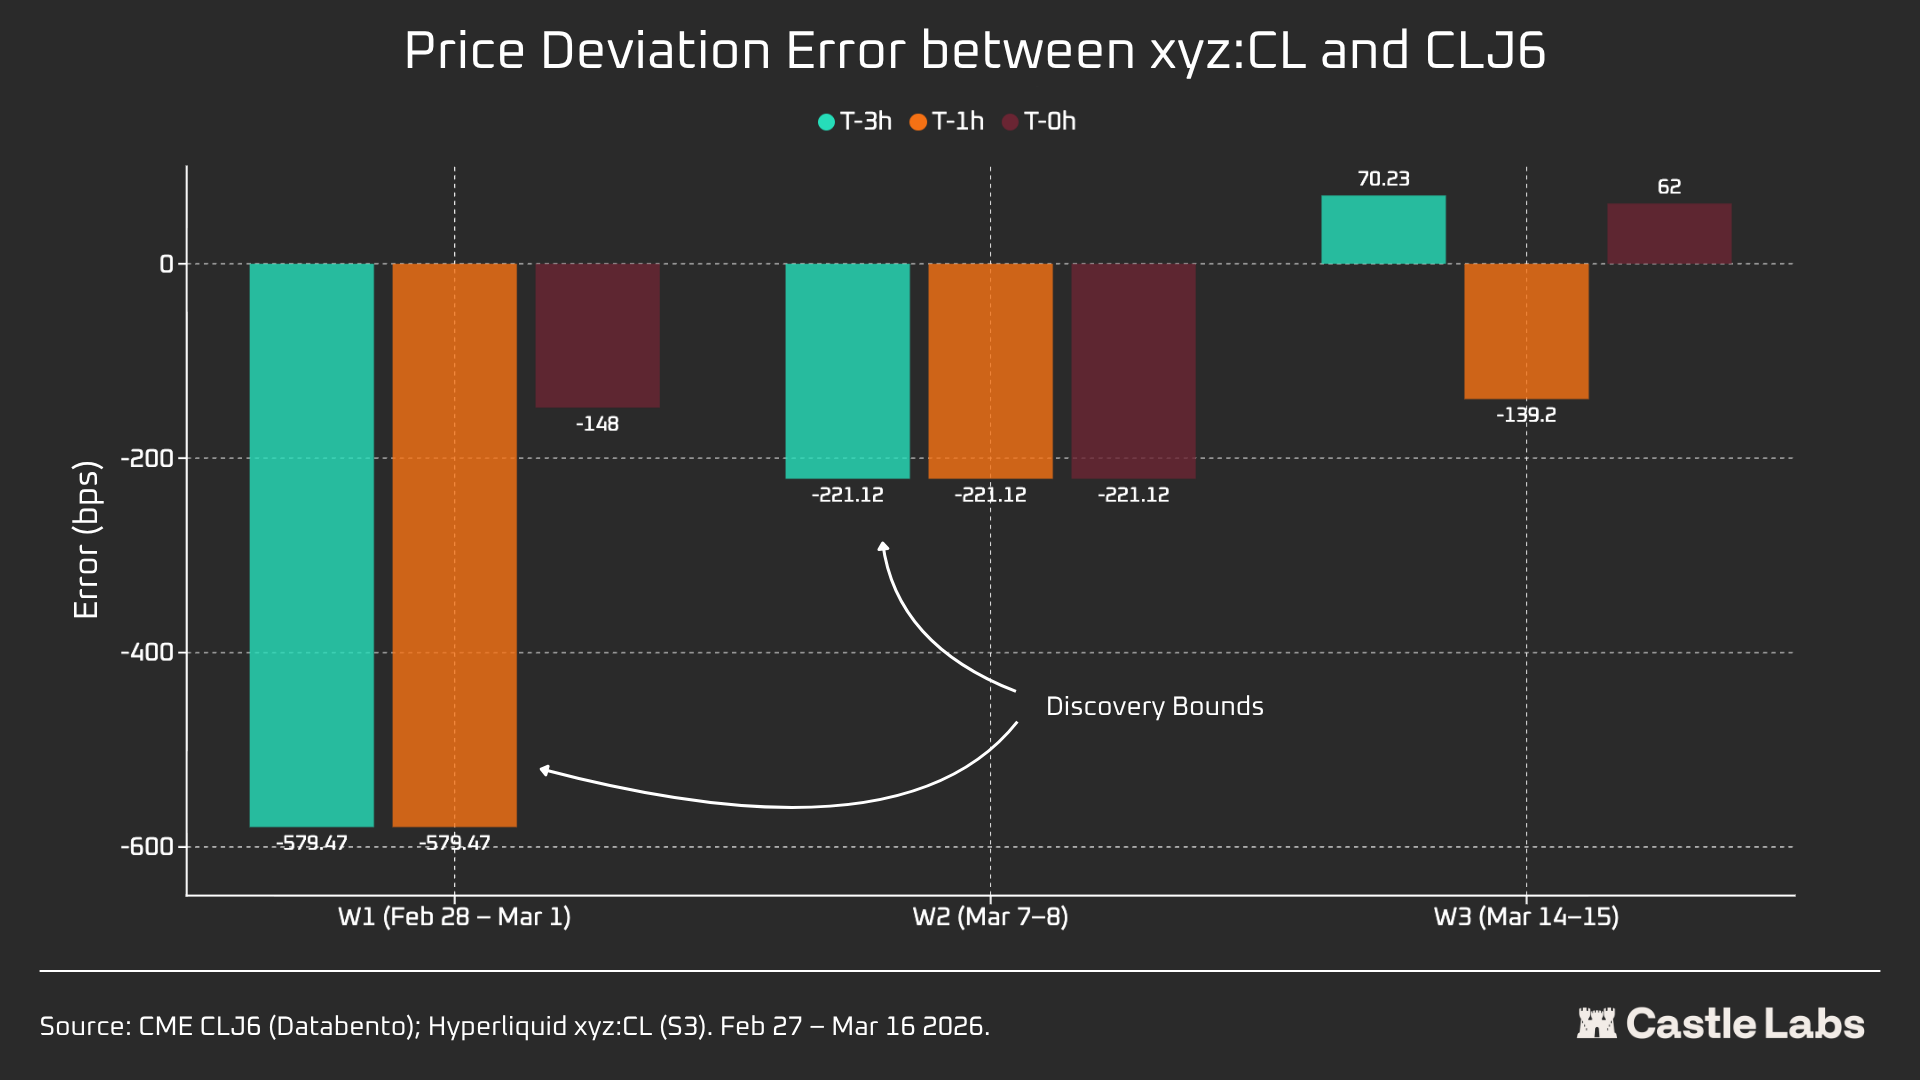
For each weekend window period, we report key data metrics for Hyperliquid xyz:CL, including price, volume, and number of trades. To measure the Monday opening price deviation, for each weekend, we will measure the price difference between Hyperliquid and CME at three reference points:
- 3 hours before CME reopens
- 1 hour before CME reopens
- At CME opening (T=0)
All price differences are expressed in basis points, with positive values indicating Hyperliquid is above the CME opening price and negative values indicating a discount.
Quantitative Analysis
This section begins with an analysis comparing the liquidity conditions of the Hyperliquid xyz:CL HIP-3 crude oil market with NYMEX CLJ6 during overlapping weekday periods.
Liquidity Depth: Hyperliquid is less than 1% of CME
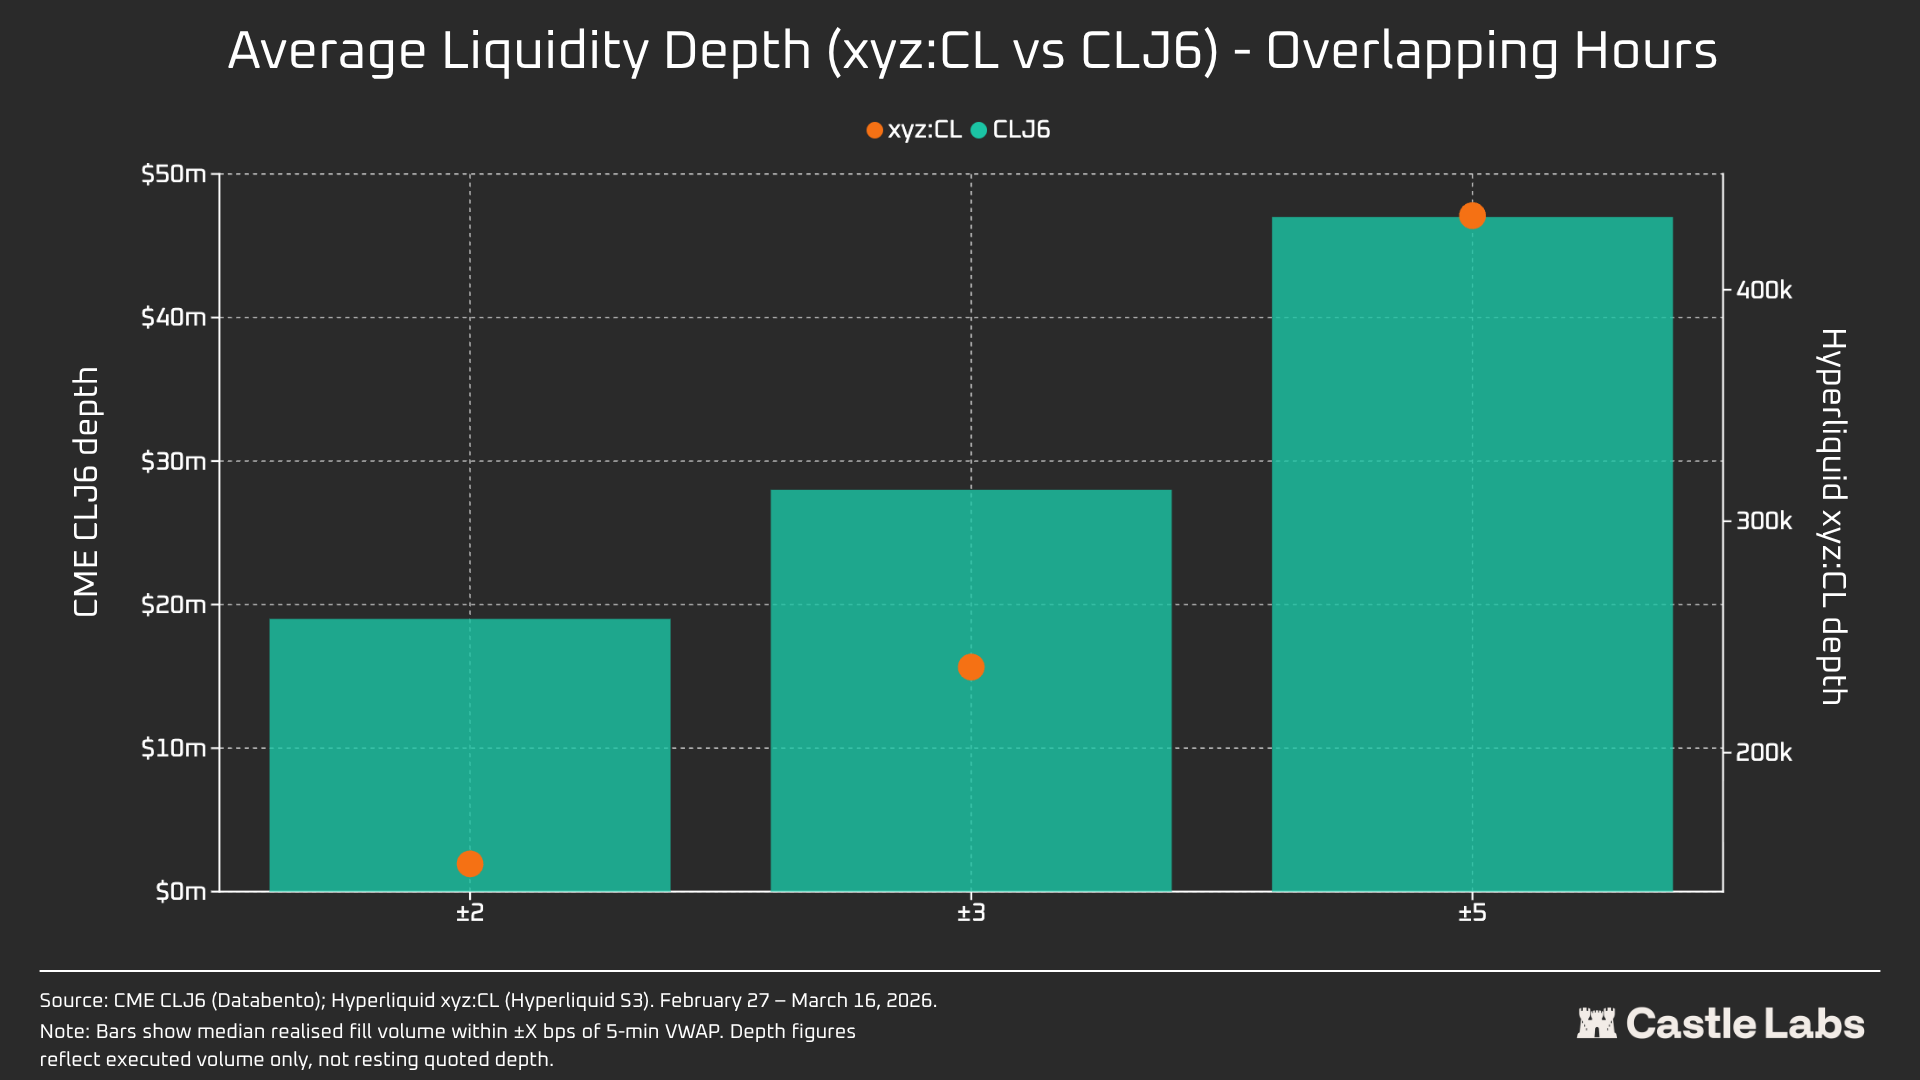
Without a doubt, the liquidity conditions of on-chain exchanges are starkly different from CME. The average liquidity depth of CL on Hyperliquid is less than 1% of CLJ6, with the liquidity depth across price intervals being consistent (109 times at ±5 bps). Within the midpoint price ±2 bps range, CME's executable depth is 19 million dollars, while Hyperliquid is only 152,000 dollars, a difference of 125 times.
Considering the novelty of the CL market on Hyperliquid and the differing target user demographics, this outcome is not surprising. The primary value of on-chain exchanges lies in providing a permissionless trading channel for users traditionally excluded by institutions like CME.
However, as weekend trading volumes on DEX platforms like Hyperliquid grow, perceptions of these platforms are beginning to shift, with institutional investors increasingly interested in hedging positions during off-trading hours. Therefore, it is becoming more crucial for Hyperliquid to create a market environment suitable for traditional investors and retail traders.
For a retail trader with a transaction amount of 10,000 dollars, this cost gap is negligible. However, for institutional investors with transaction amounts over 1,000,000 dollars, on-chain trading costs for CL (and most other markets) remain burdensome.
In fact, the inherent differences between user groups are reflected in the median transaction sizes during these overlapping market periods.
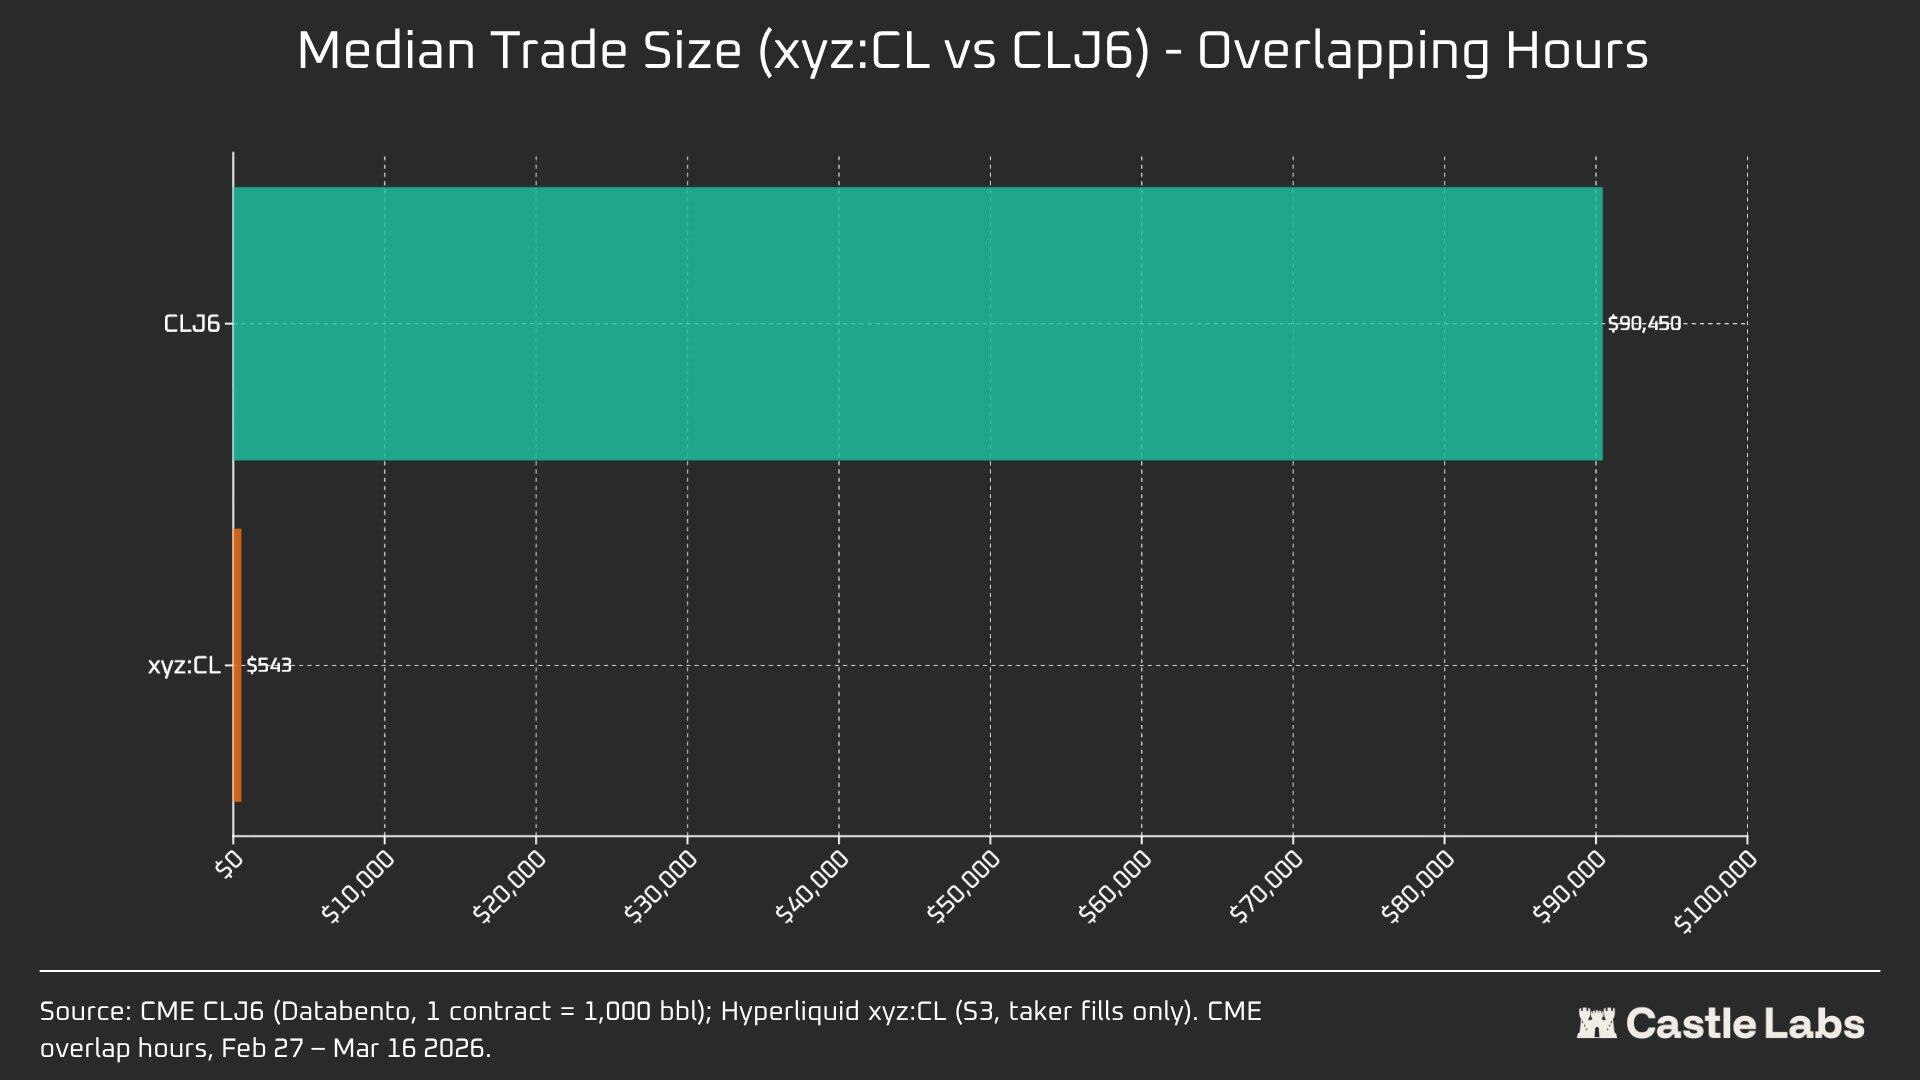
The 166 times difference in median transaction size (90,450 dollars vs 543 dollars) most clearly demonstrates the fundamental disparity in the user groups served by these trading venues. The median transaction size of CLJ6 is comparable to a standard crude oil futures contract (with a notional value of about 94,000 dollars at current prices), while Hyperliquid's median transaction size is 543 dollars, reflecting the situation of crypto-native retail traders making leveraged directional bets.
We anticipate that as these markets become increasingly legitimized in the eyes of more traditional investors and funds are shifted on-chain, the median transaction size in the Hyperliquid commodity market will reach an inflection point.
To further distinguish different transaction sizes, we conducted order simulations with order sizes ranging from 10,000 dollars to 1,000,000 dollars.
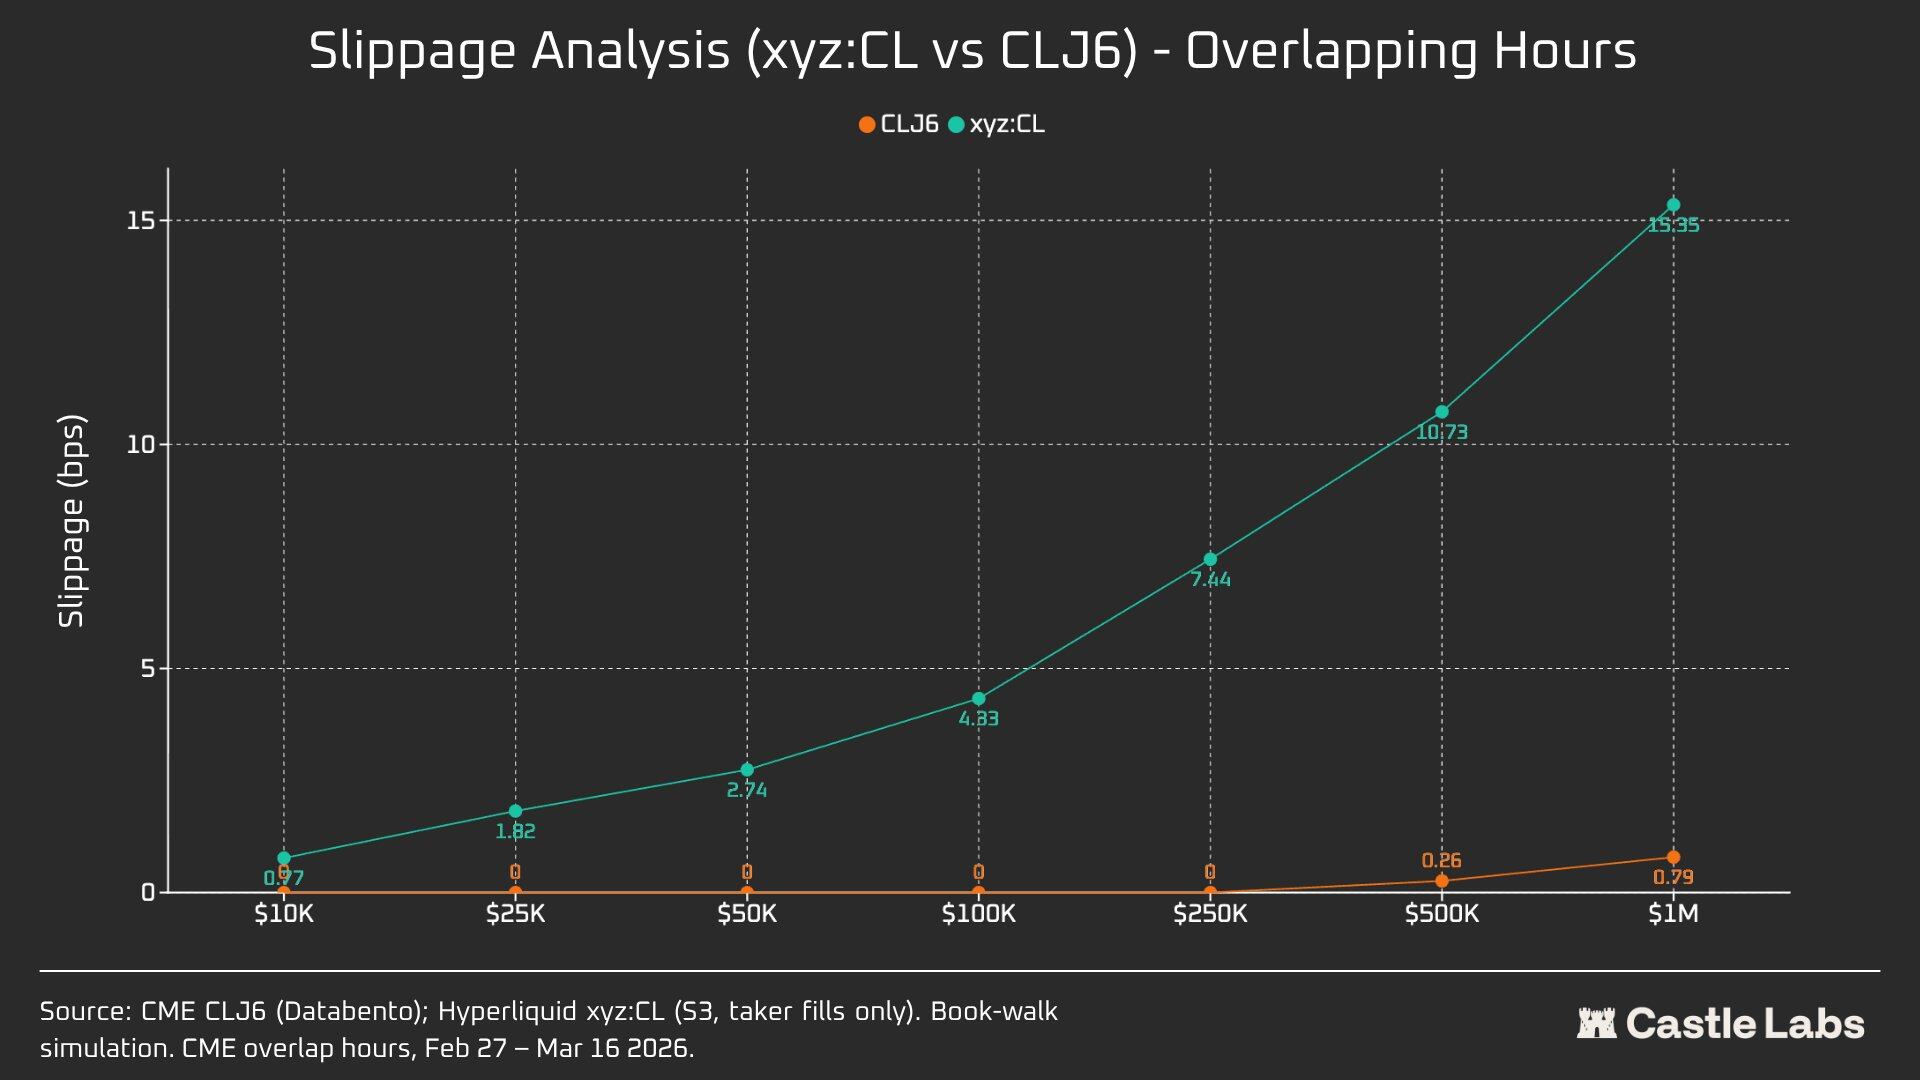
For a 10,000 dollar order, CLJ6 traders experienced no slippage, which is as expected, while Hyperliquid users had a median execution slippage of less than 1 basis point at 0.77 basis points. The gap appears at the 100,000 dollar order size, wherein Hyperliquid users' slippage rises to 4.33 basis points, nearing the 5 basis point threshold, while CME CLJ6 saw no slippage.
It is noteworthy that this is higher than the median transaction size of the CLJ6 market (90,450 dollars).
At a 1,000,000 dollar transaction size, Hyperliquid's 15.4 basis points is about 20 times CME's 0.79 basis points, confirming that this trading venue currently lacks the capacity to handle institutional-level orders. Considering Hyperliquid's average transaction size, the platform could easily provide the same quality of service to users without incurring slippage.
CLJ6 orders only began to show noticeable slippage around the 500,000 dollar transaction size, impacting their execution.
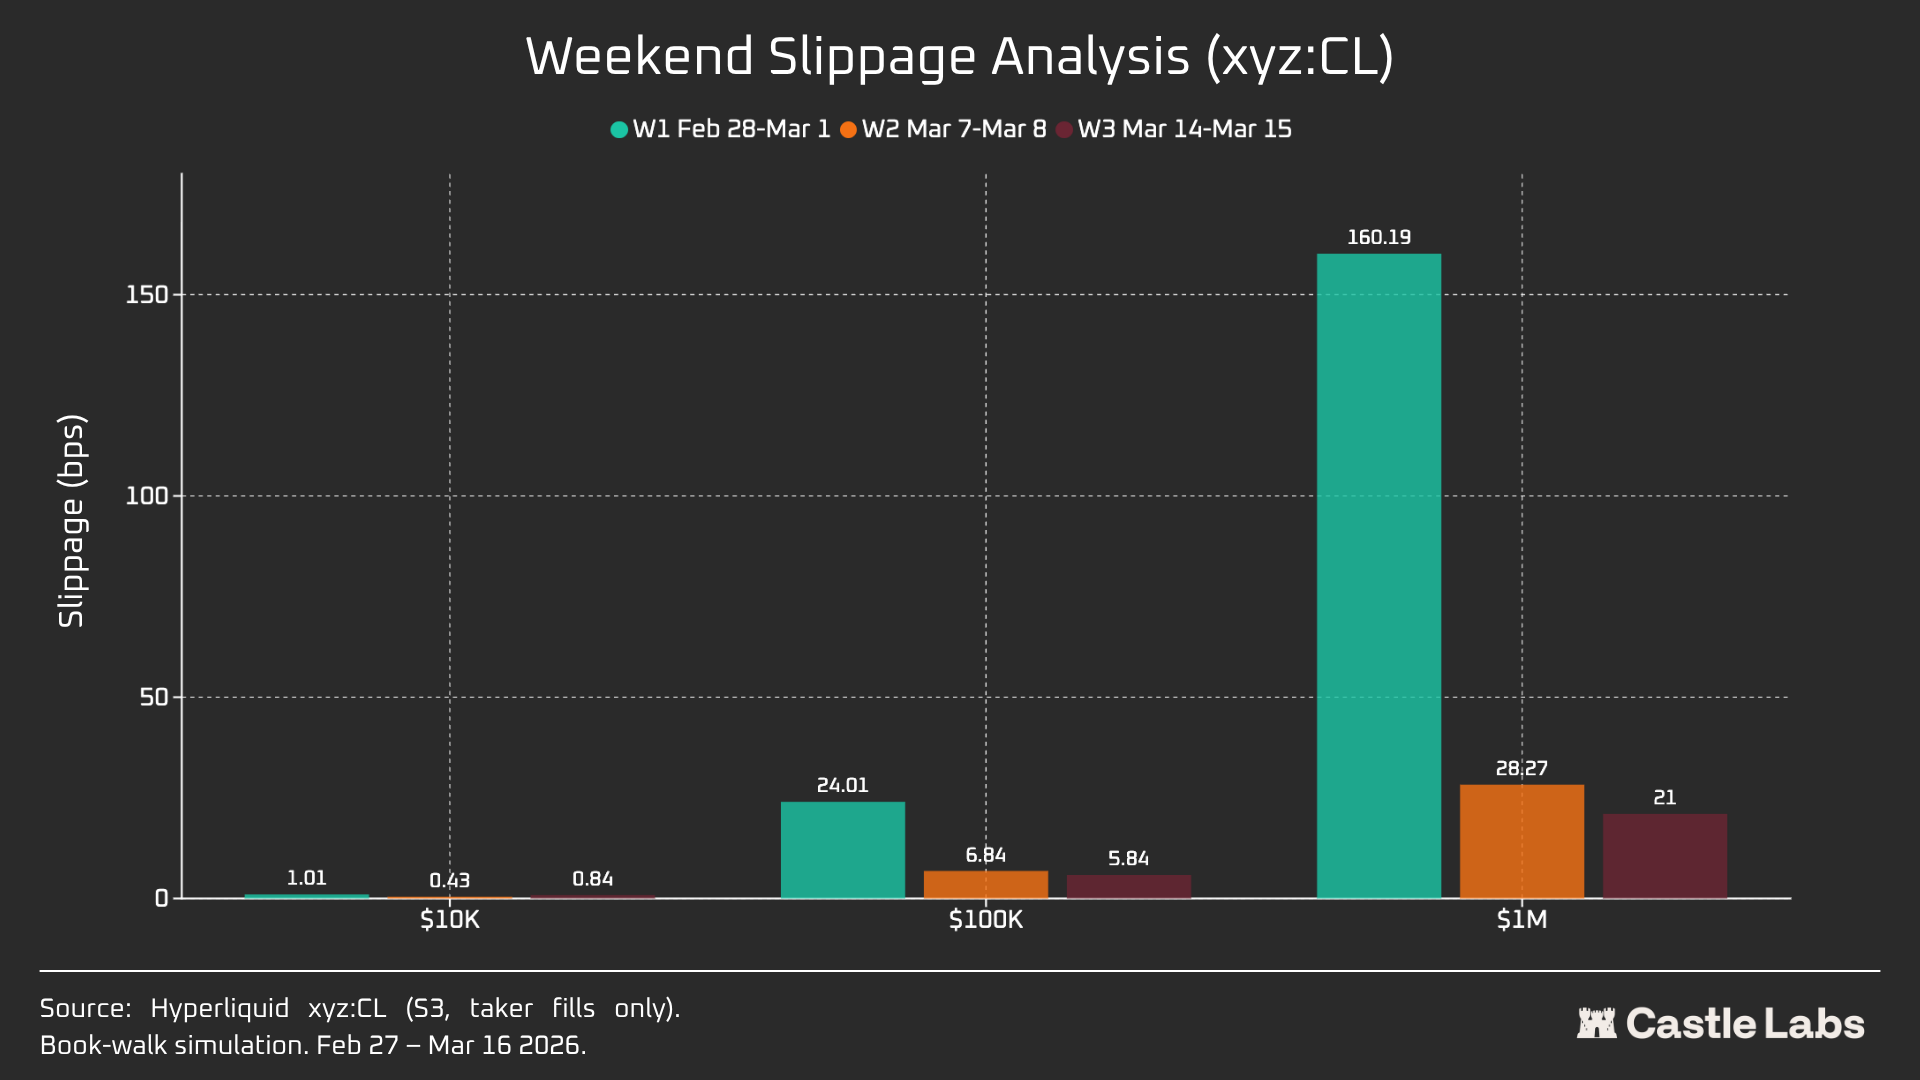
When we extended order size analyses to weekends, slippage for all order sizes decreased, especially for 100,000 and 1,000,000 dollar orders, indicating that the market has matured. During the three weeks analyzed, the reduction in simulated order slippage is as follows:
- 10,000 dollars: -16%
- 100,000 dollars: -75%
- 1,000,000 dollars: -86.9%
Financing Rates
The financing rate of CL fluctuated considerably during CME's closing hours, but saw lower volatility during the delivery period. This helps reveal the internal pricing dynamics of the market during off-trading hours. The weekend opening allows the CL market to utilize internal price discovery mechanisms (supported by DB and other risk reduction mechanisms). Therefore, financing rates are expected to be more volatile, as highlighted below.
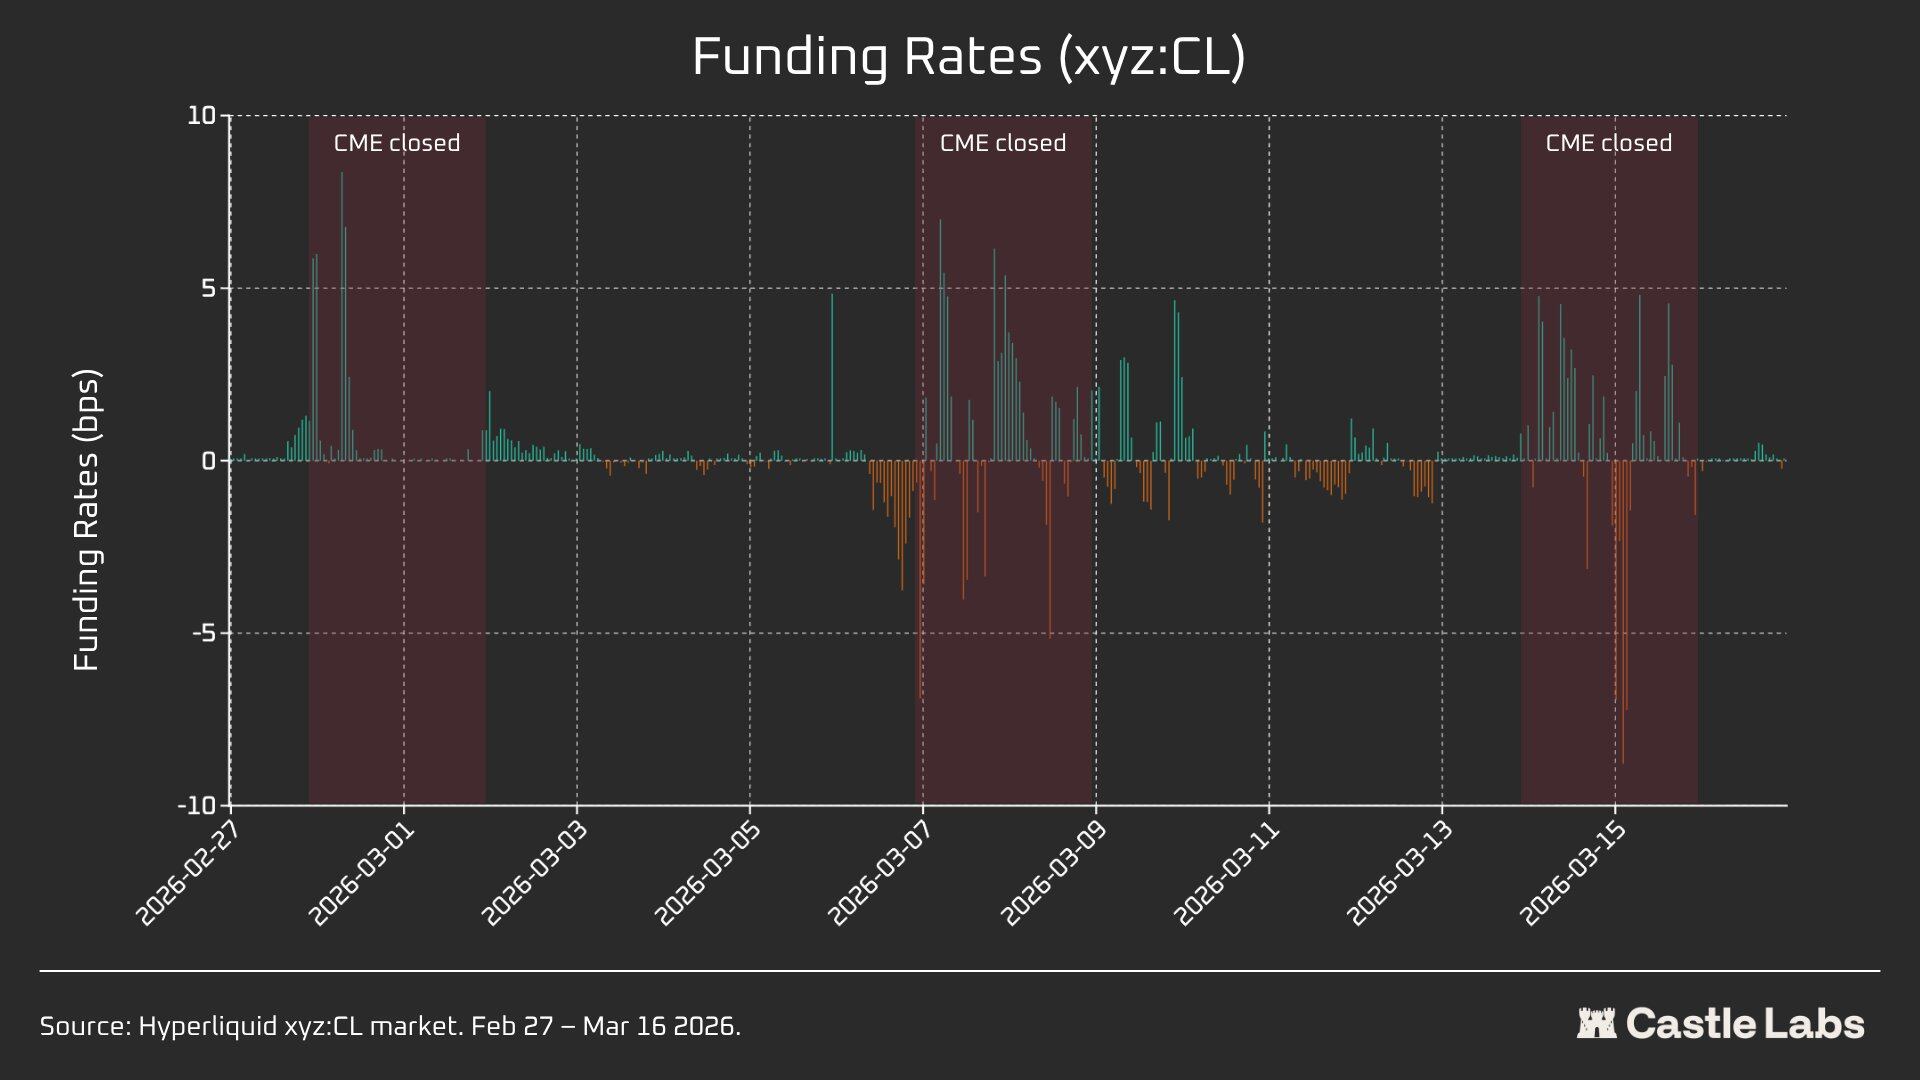
During active trading periods, the trajectory of Hyperliquid's xyz:CL is closely tied to CME's CLJ6; however, with rising oil prices, a structural discount emerged and widened, likely due to financing rate pressure from accumulated long positions. During the weekends, with CME closed, price discovery on Hyperliquid was further constrained by the price range mechanism (DB), which restricted the volatility of marking prices without a real-time reference market.
Weekend Period Individual Analysis: Hyperliquid has Established Price Discovery Capability
The three weekends showcased the rapid maturation process of the Hyperliquid market:
W1: February 28 to March 1, 2026 (Iranian Attack Event)
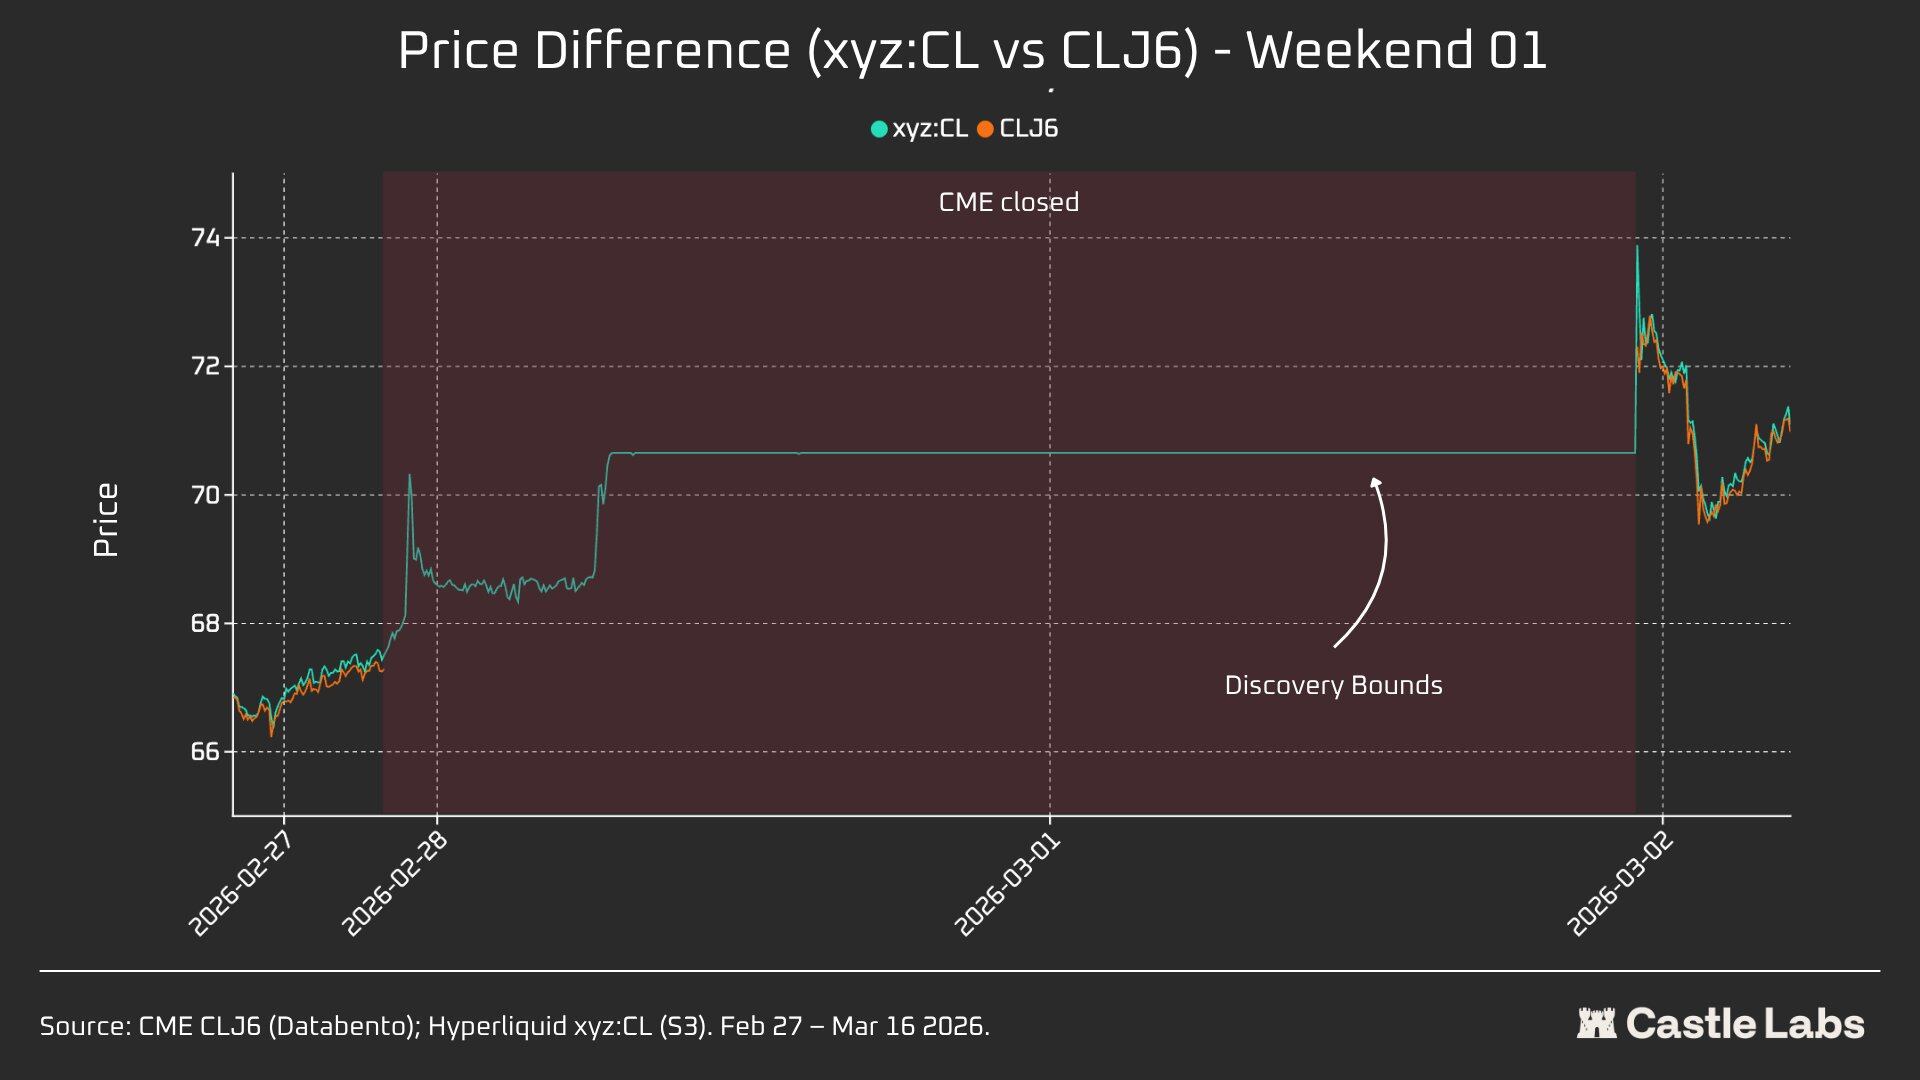
The price on Hyperliquid rose from around 67.29 dollars near CME to about 70.80 dollars, accounting for approximately 45% of Monday's final gap-up to 75 dollars (+1146 basis points).
It is important to note that, due to the aforementioned ±5% price range restriction mechanism (DB) of trade.xyz, price discovery during this weekend was limited. This explains why the curve in the chart is relatively smooth and why there was a gap-up on Monday. Nevertheless, at the moment pairing data was published, the difference between Hyperliquid xyz:CL (73.89 dollars) and CME CLJ6 (75 dollars) was within 1.5%.
This is not a "failure" or "error," but rather a risk management achieved through market design. Therefore, from a data perspective, the first weekend shows the lowest correlation, but it highlights xyz:CL's initial response to the Iranian airstrikes while also recognizing DB's importance as a price discovery mechanism during weekends, especially for emerging markets.
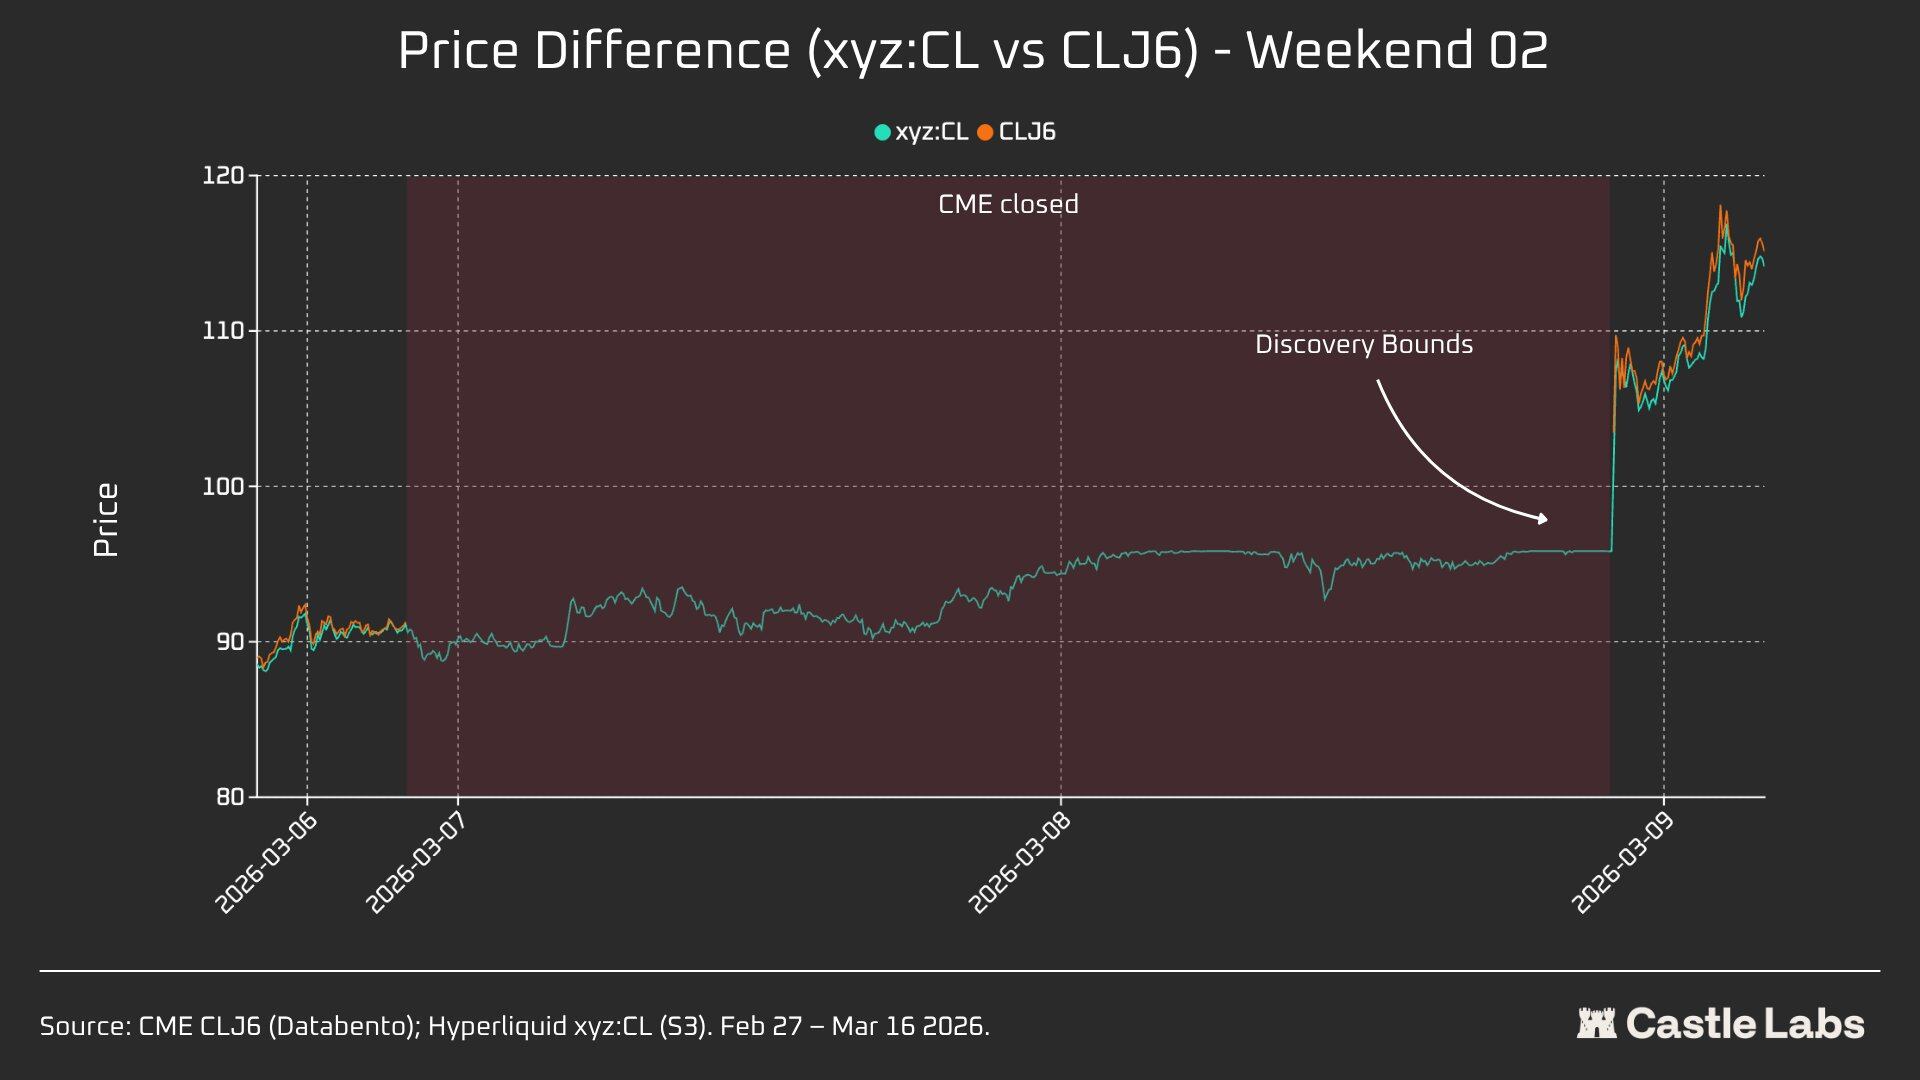
W2: March 7 to March 8, 2026
The second weekend was the true test as xyz:CL reached the boundary price at the end of the market. The CLJ6 opening price was 98 dollars (up 737 basis points from the 91.27 dollar closing price), while xyz:CL peaked at around 95.83 dollars, capturing only 68% of the increase.
During the second weekend, xyz:CL better captured market trends and was closer to CME's opening price than the previous weekend.
W3: March 14 to March 15, 2026
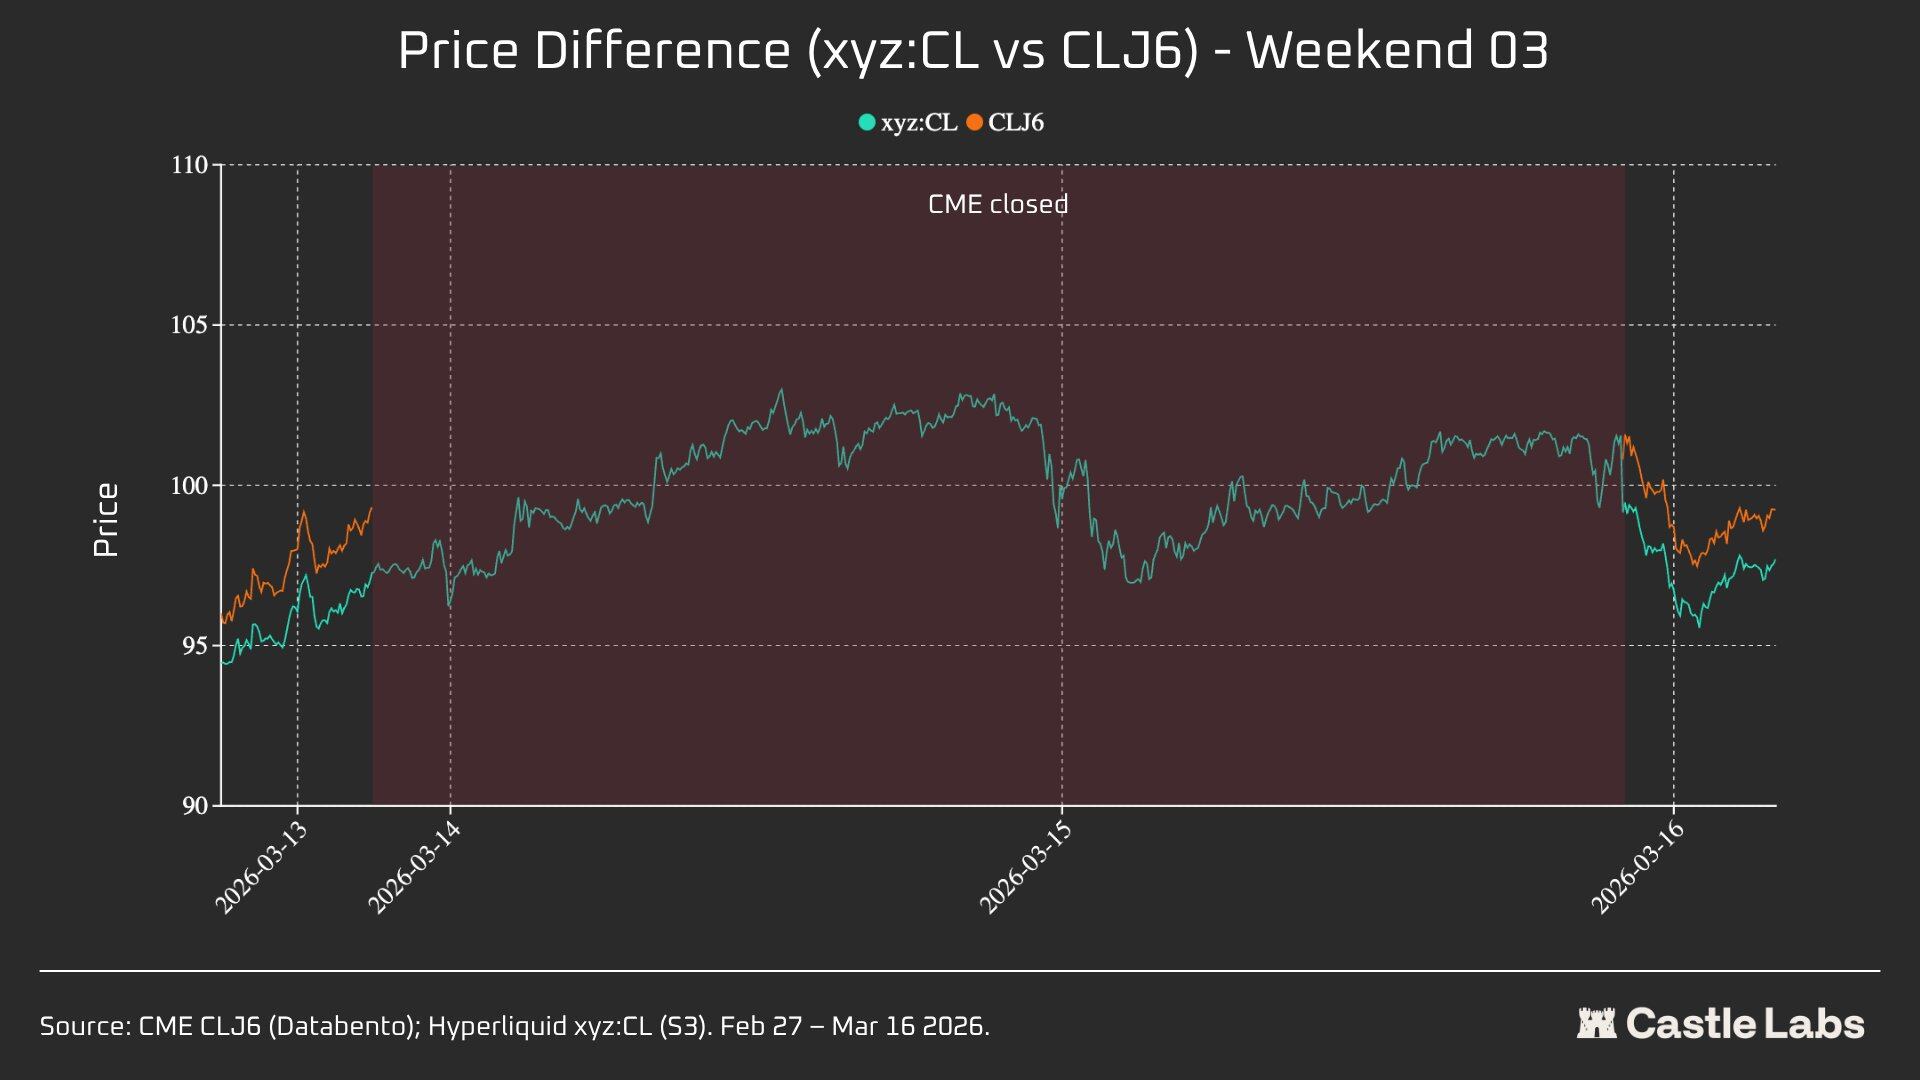
Data from the third weekend indicates that in a calmer market environment, Hyperliquid can more reliably forecast the ultimate opening direction of CME.
This weekend, the convergence of xyz:CL and CLJ6 reached its best: up 226 basis points from CME's closing price, slightly exceeding the Monday opening price difference of 62 basis points. The closing price of CLJ6 on Friday was 99.31 dollars, while its opening price was 100.93 dollars (up 163 basis points), and the opening price of xyz:CL was 101.56 dollars.
Collectively, these three snapshots display the structural changes in the xyz:CL market on the Hyperliquid platform, transitioning from an emerging market constrained by the DB price discovery mechanism (weekend 1 and weekend 2) to increasingly free price discovery, exhibiting overshoots and corrections (weekend 3).
Analysis of price deviation errors at different time periods (3 hours, 1 hour, 0 hours) before CME openings shows that W3's data is the most reliable, as during the first two weekends, the xyz:CL market was affected by DB. In W3, the errors for xyz:CL were approximately +70 and -139 basis points respectively, 3 hours and 1 hour before CME opened, indicating its price discovery capability exceeds that of the previously analyzed weekends.
Other Indicators
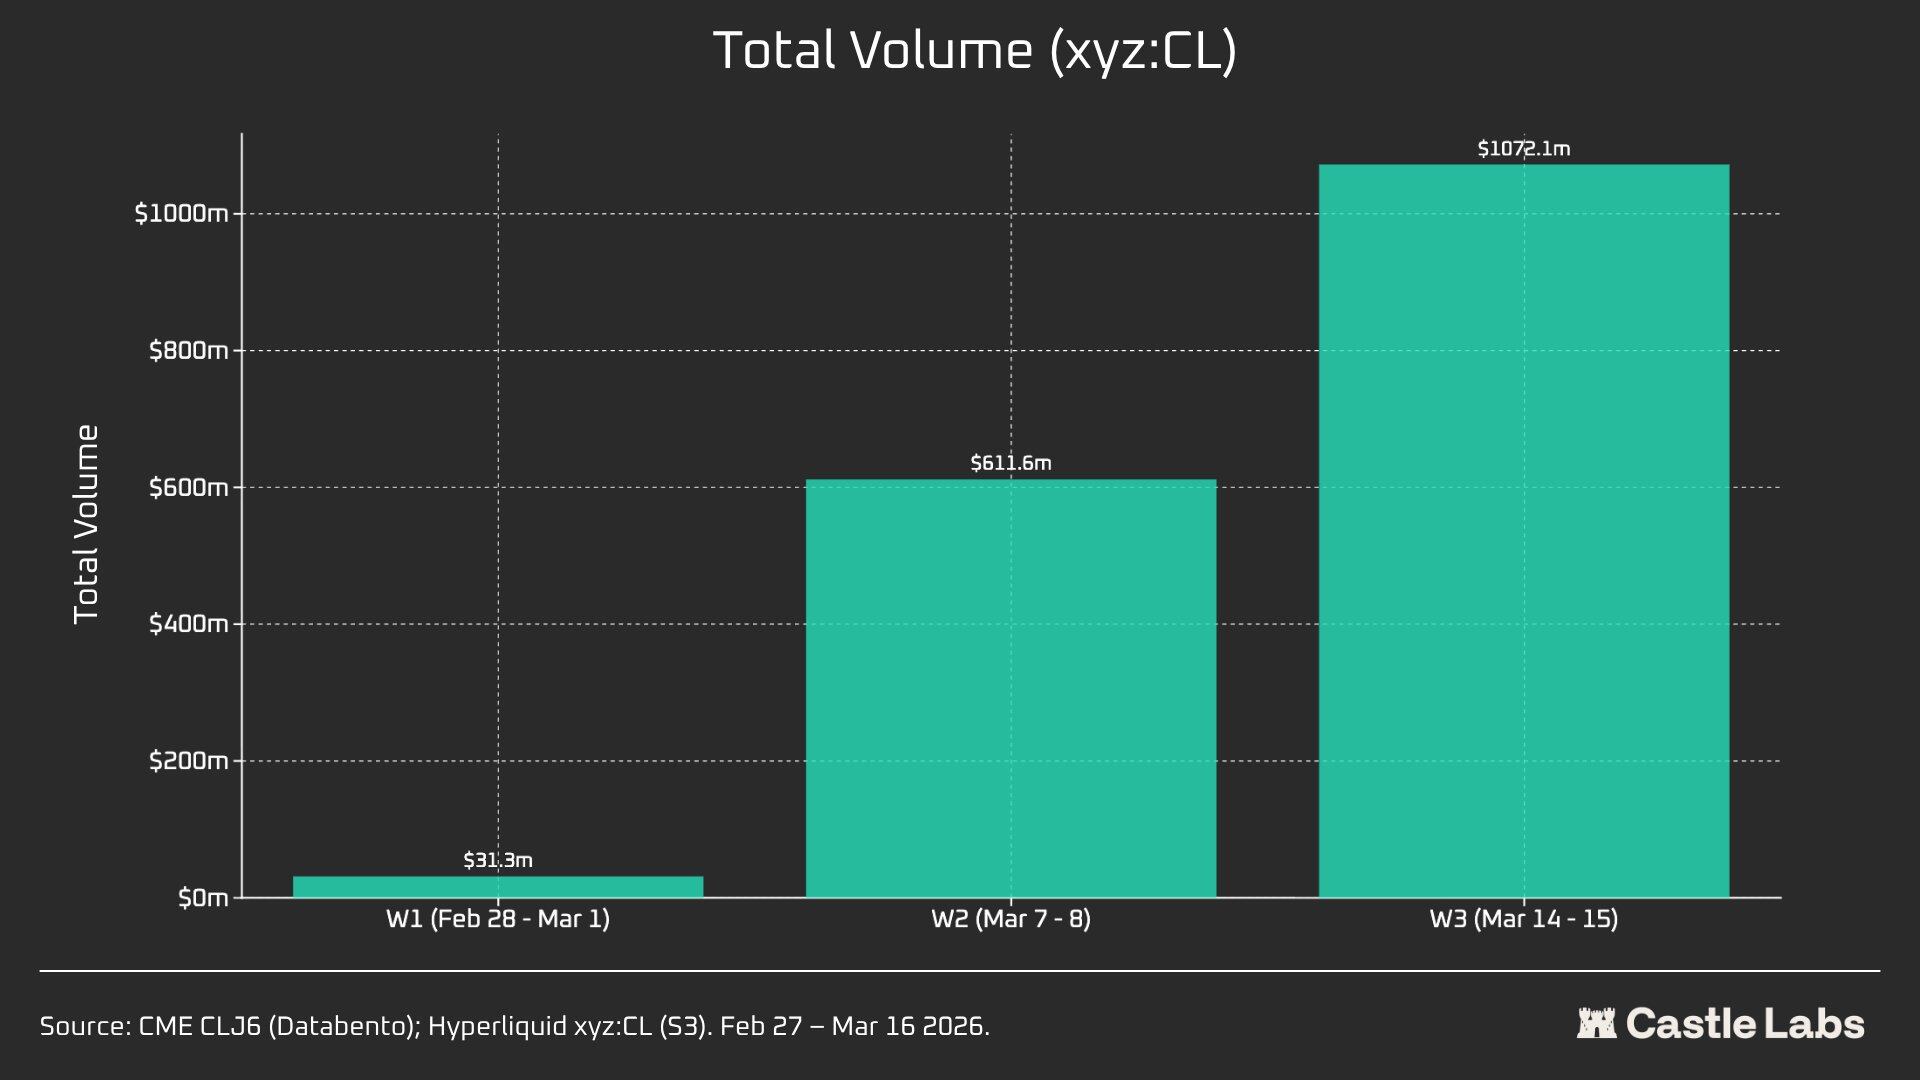
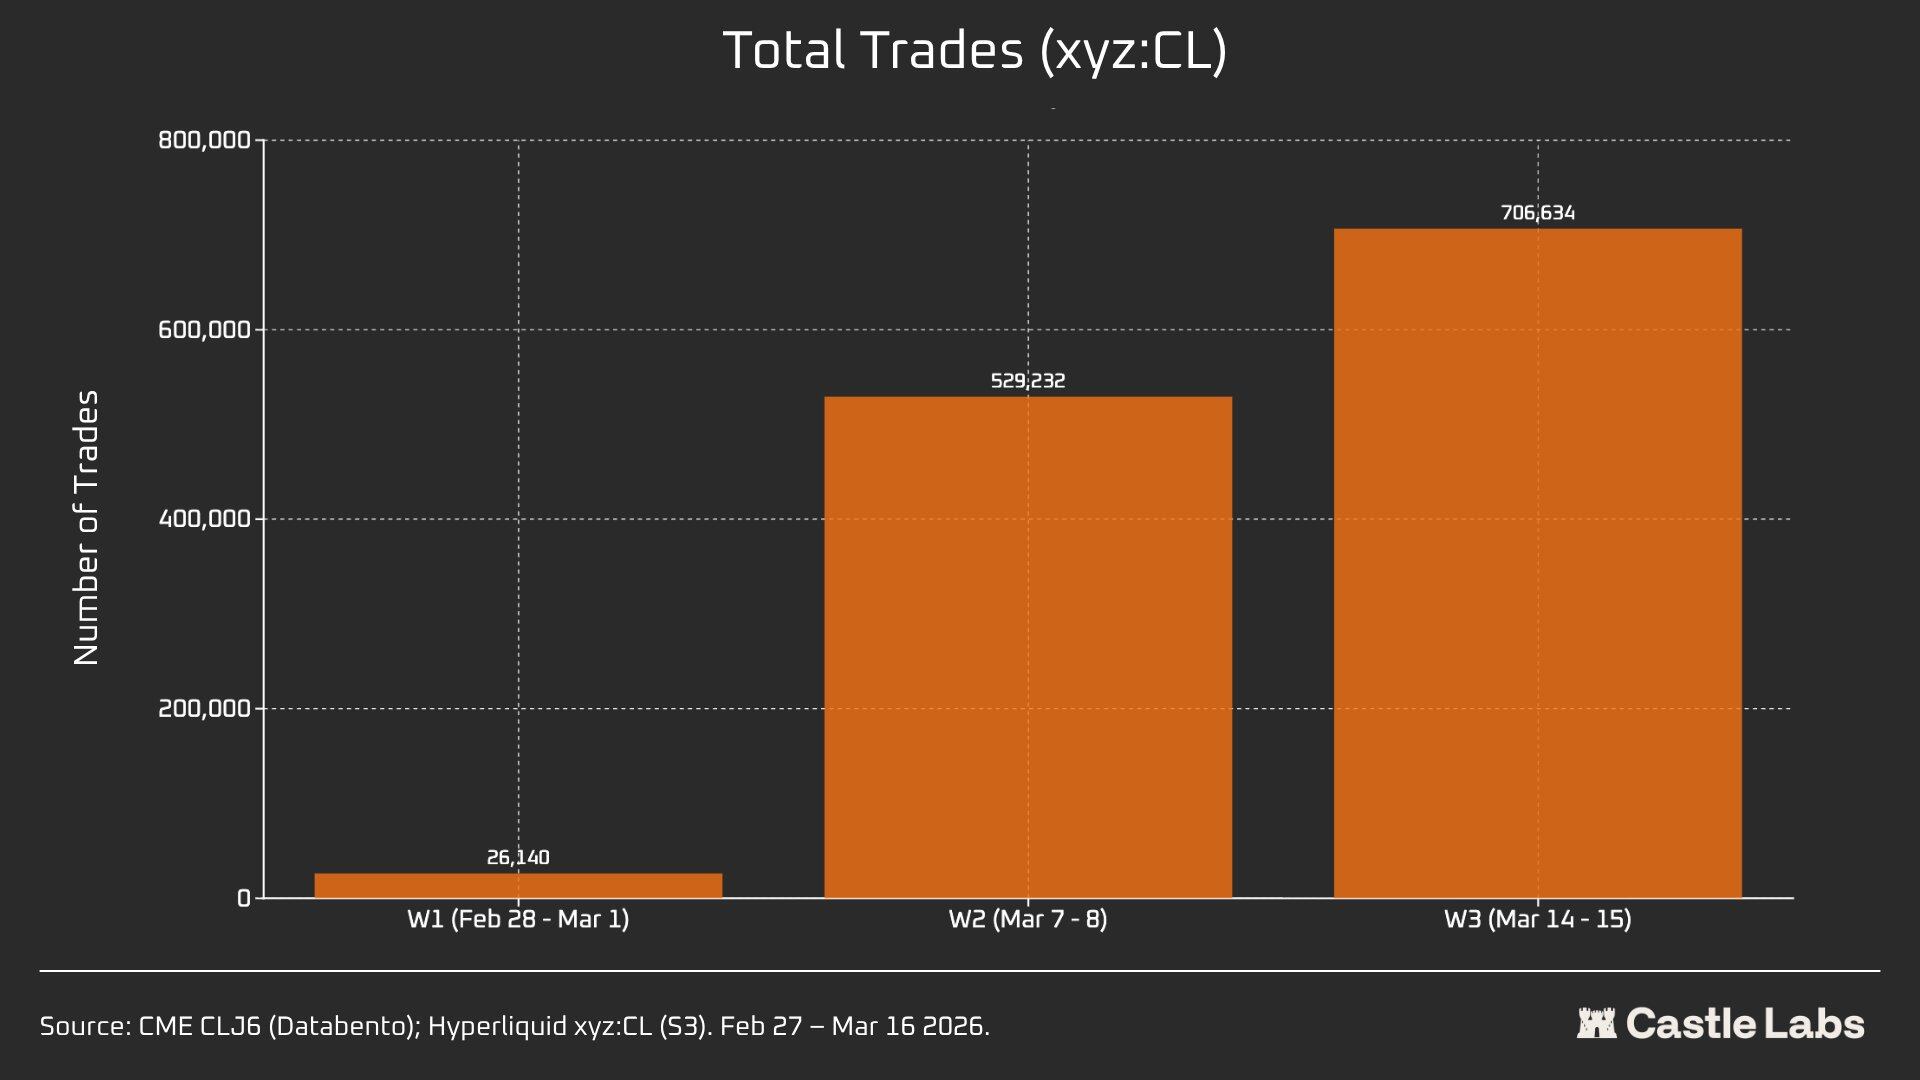
We also provide other indicators summarizing analysis of weekends, including trading volume, total number of trades, and average transaction size. These indicators varied across weekends and showed continuous growth over several weekends.
The total trading volume in the xyz:CL market grew from 31 million dollars to over 1 billion dollars over the three weeks, reflecting an increase in user numbers and the market's ultimate maturation.
Additionally, the total number of trades increased from 26,000 in the first weekend to over 700,000 in the third weekend.
Notably, the average transaction size over the weekends actually grew from the previously mentioned median to 534 dollars. All three weekends observed the same growth trend, which may indicate an influx of more institutional funds into the market.
The average transaction size for the first weekend was 1,199 dollars, growing to over 1,500 dollars by the third weekend.
This may suggest that the user demographics utilizing the platform over weekends are different, with fewer retail users, and more traders needing to gain crude oil exposure before Monday, thus weekend trading is closer to hedging demands rather than speculation.
免责声明:本文章仅代表作者个人观点,不代表本平台的立场和观点。本文章仅供信息分享,不构成对任何人的任何投资建议。用户与作者之间的任何争议,与本平台无关。如网页中刊载的文章或图片涉及侵权,请提供相关的权利证明和身份证明发送邮件到support@aicoin.com,本平台相关工作人员将会进行核查。