Recently, the market is like a well-written script; either it moves sideways, making people sleepy, or some influencer tweets, and the market instantly reacts with a surge, squeezing those who shorted at low levels and those who cash out at high levels. A lot of funds flee, and then it begins to decline again. Those chasing the rising bullish market get caught again. Anyway, regardless of whether the market rises or falls, this market is never short of liquidations, forever teary-eyed, always full of hope, never retreating, never admitting defeat. This is the cryptocurrency space, this is the self-cultivation of retail investors...
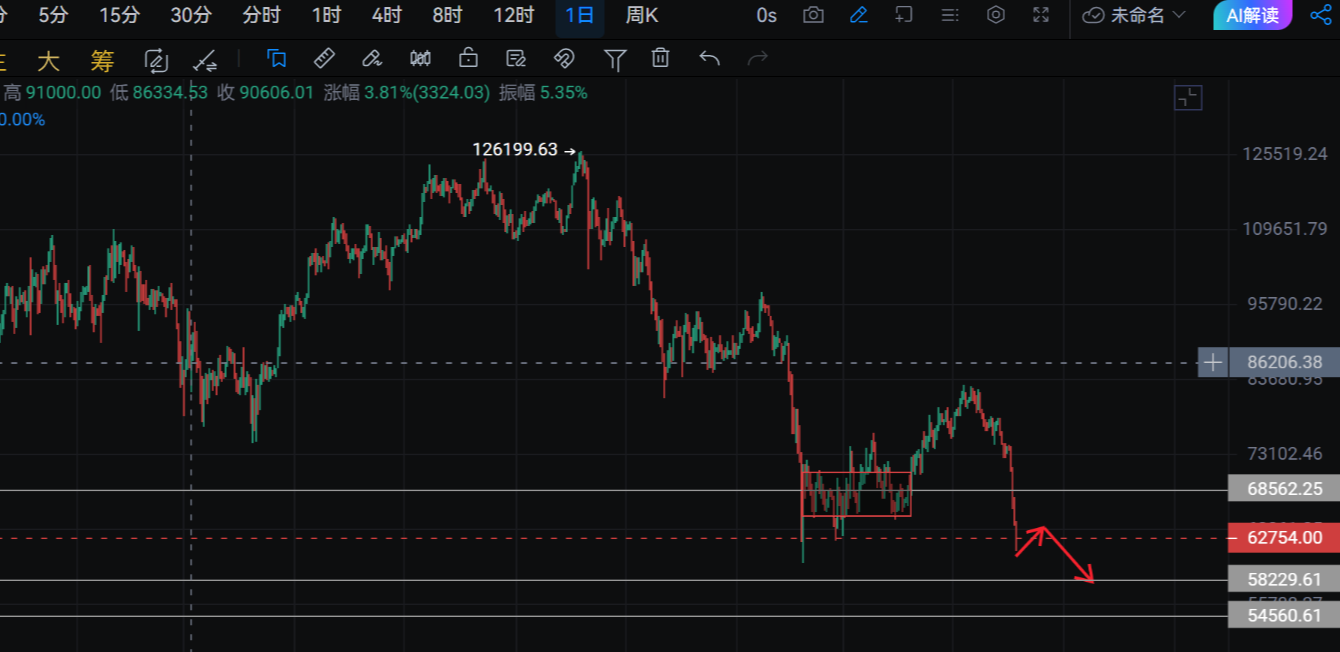
After two consecutive weeks of declines, Bitcoin's weekly candlestick formed a medium bullish candle last week. The Bollinger Bands continue to have all three lines opening downward. The KDJ shows a golden cross upwards, but the RSI is flattening and slowing down, with signs of a downward turn. The MACD bears are still expanding volume. On the daily chart, from Friday to Saturday, the weekend saw three consecutive bullish candles, with each one larger than the last. The price stands above the middle Bollinger Band, and today’s opening was directly above it. The middle and upper Bollinger Bands are both opening downward, while the upper band is lifting upwards. The KDJ is turning upwards, the RSI is slowing down and flattening, and after a continuous contraction of bearish volume, the bullish volume begins to expand. However, the upper band on the daily chart has significantly declined, and despite the indicators showing a need for a rebound, coupled with some enthusiastic support from influencers, the price still couldn't stand above the 70,000 level. This shows just how sluggish the entire market is and how weak the bulls are.
On the short-term 4-hour level, after five consecutive bullish candles, the bulls are exhausted, and there is currently a need for a pullback at high levels, with both the KDJ and RSI turning downwards. On the hourly chart, the price has dropped back below the upper band, and the bullish volume in the MACD is contracting. This morning, I publicly recommended entering short positions around 69,200-69,500, and the view remains valid and unchanged. For intraday operations, primarily short positions are advised, relying on the 70,000 level to look bearish. News-driven surges have limited impact, and one should not chase the increase. After a rise, it will consolidate at high levels, consuming the bulls' demand, so do not be fooled by a fake-out. The major range of fluctuation remains between 70,000-65,000; do not chase or sell off before a breakthrough!
Above, watch for resistance around 69,000 and 70,000; short positions can be considered around here. Below, watch for support around 67,500, 66,500, and the 65,000 level.
For Ethereum, watch for resistance around 2,150 and 2,200; short positions can be considered around here as well. Below, watch for support around 2,100, 2,000, and the 1,950 level.

免责声明:本文章仅代表作者个人观点,不代表本平台的立场和观点。本文章仅供信息分享,不构成对任何人的任何投资建议。用户与作者之间的任何争议,与本平台无关。如网页中刊载的文章或图片涉及侵权,请提供相关的权利证明和身份证明发送邮件到support@aicoin.com,本平台相关工作人员将会进行核查。