Crypto Wave: April 6 Bitcoin (BTC) Market Analysis Reference:
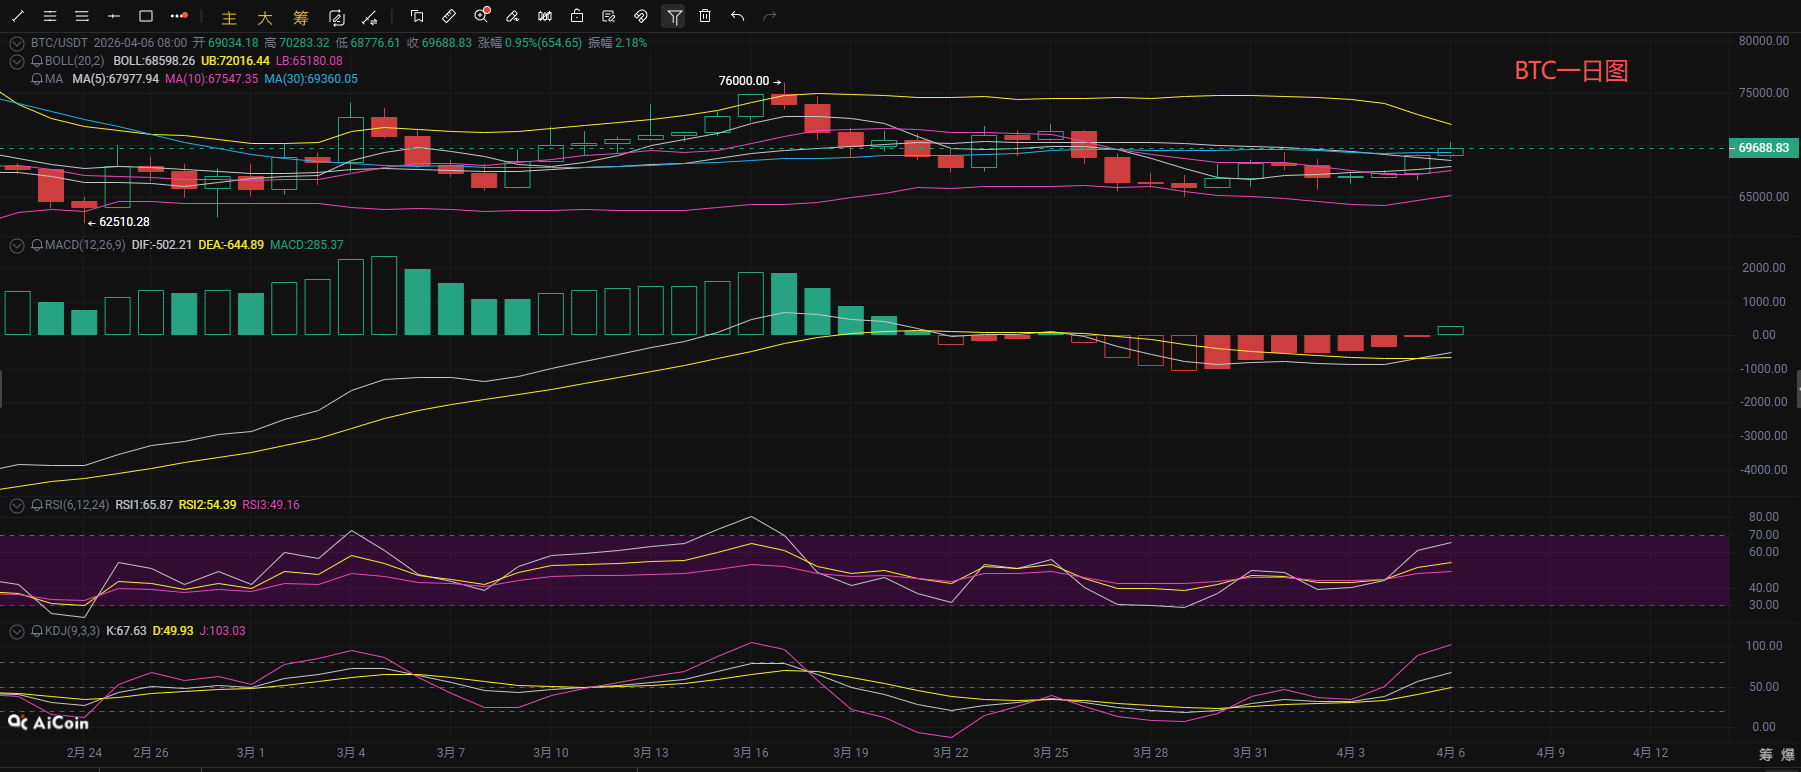
After a narrow consolidation over the weekend, Bitcoin has made a strong upward move this morning. The intraday high reached around 70200, followed by a slight retreat, and as of the time of writing, the price is hovering around 69700. Observing from the daily chart, the daily K-line forms a double bottom shape, the short-term moving averages are diverging upward, and the price is above the 30-day moving average indicating a bullish structure. The Bollinger Bands are narrowing, with the price operating above the middle band, currently in a strong correction phase. The upper Bollinger Band at 72000 forms key resistance, while the lower support at 68000 (5-day moving average) is for the short term; the MACD indicator shows the fast and slow lines below the zero axis but diverging upward continuously, with the histogram turning positive, indicating increased bullish momentum; the RSI indicator is rising in tandem, with ample short-term upward momentum; the KDJ indicator shows three lines diverging at a high position, with the J value breaking above 100 entering the overbought zone, indicating strong short-term rebound momentum, but the risk of pullback increases in the overbought state. Therefore, avoid blindly chasing highs and prioritize low buying within the support range.
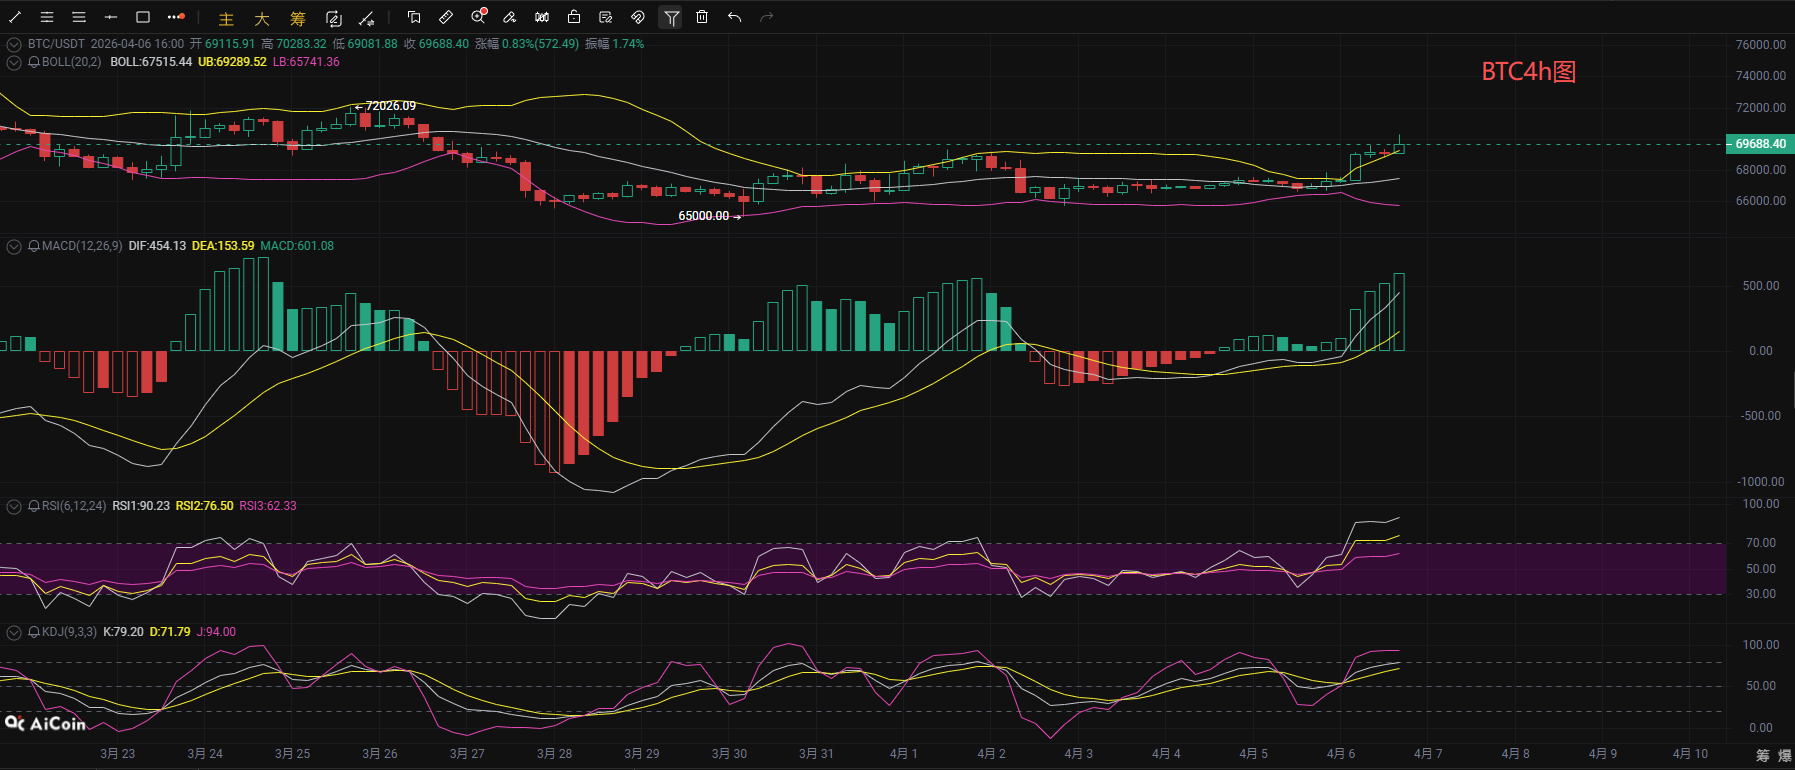
From the short-term hourly chart, the 4-hour moving average system shows a bullish arrangement, with the price stabilizing above all moving averages, indicating a clear short-term bullish trend; the Bollinger Bands are opening upward, with the price breaking through the upper band, currently in a strong upward phase. The immediate resistance is at 70283, with strong resistance at 72000, while the core supports are 68000 (10-day moving average) and 67500 (Bollinger Bands middle band). The MACD indicator shows the fast and slow lines above the zero axis and diverging significantly upward, with the histogram continuously expanding, indicating strong bullish momentum; the RSI indicator and KDJ have both entered the overbought threshold, with short-term rebound momentum still continuing, but a technical pullback may occur at any time. The focus in the short term should be on the effectiveness of breaking through the 72000 resistance level, and it is better to wait for the pullback support range to stabilize before making low-buy arrangements.
Crypto Wave: April 6 Bitcoin Short-term Reference:
Long position: 67500-68500 range long, stop loss 500 points, target 69000-70000,
Short position: 72000-71000 range short, stop loss 500 points, target 70500-69500,
Crypto Wave: April 6 Ethereum (ETH) Market Analysis Reference:
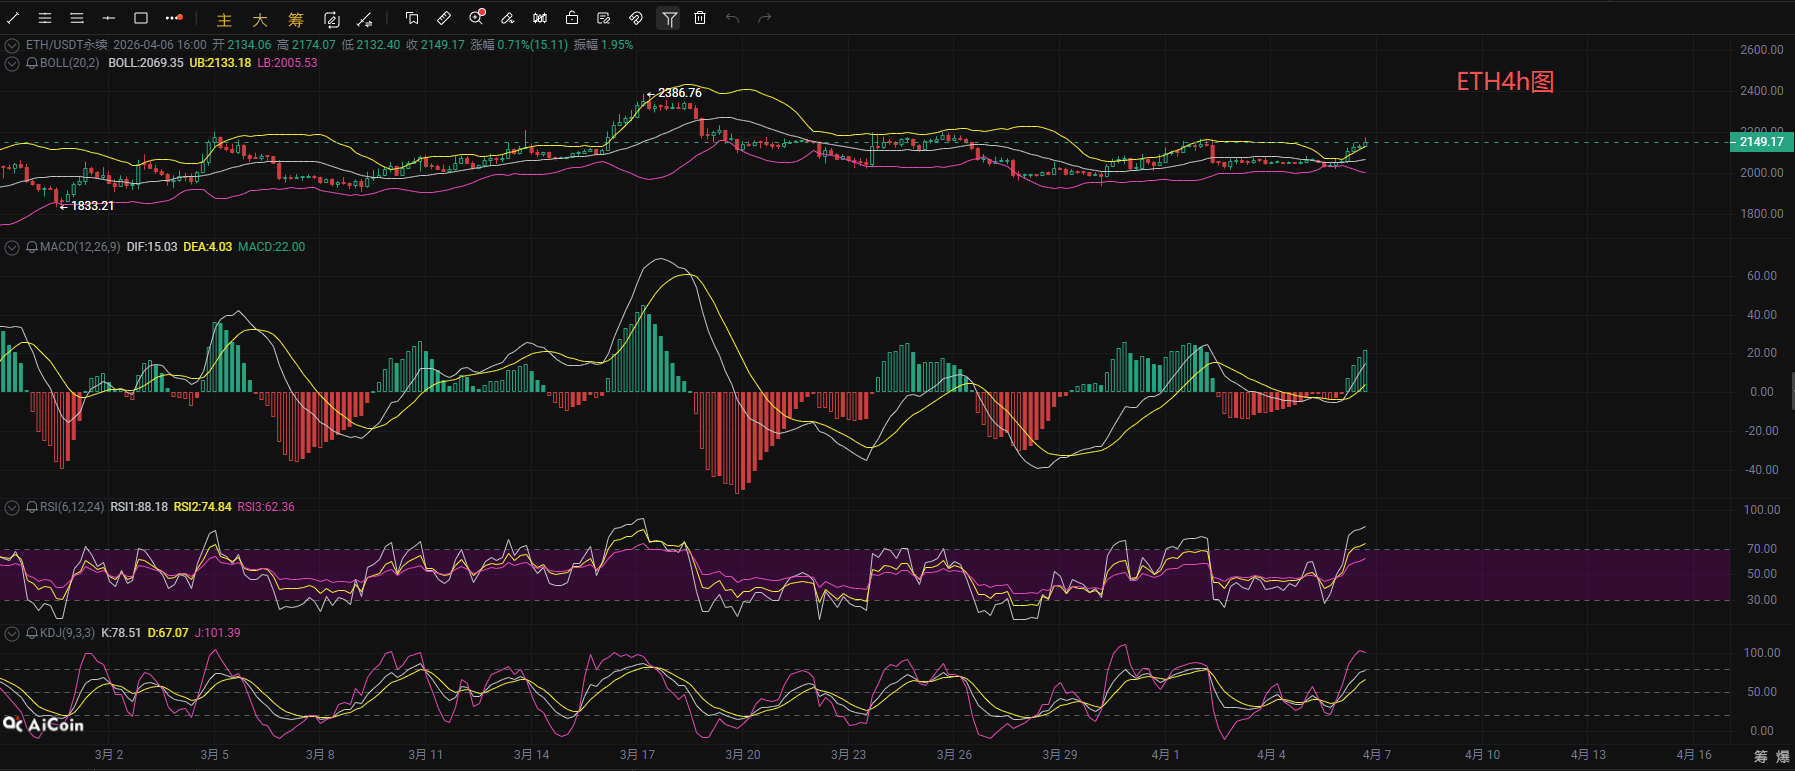
From the 4H and 1H charts of Ethereum, although the price is in a mid-term upward trend, the short-term technical indicators are seriously overbought and bullish momentum is gradually declining: the 4H Bollinger Bands are expanding, RSI has broken 80, and KDJ is turning high; the 1H KDJ is showing a death cross, and the MACD volume is shrinking, indicating a technical resonance signal for a pullback. It is predicted that the market will likely enter a pullback correction phase shortly, with resistance levels above at 2170-2175 (previous high) and a strong resistance at the 2200 integer level. The first support below is at 2100-2110 (Bollinger Bands middle band) and strong support at 2050-2060 (previous rising starting point). It is suggested to short high and long low, relying on the intervals of resistance and support for high selling and low buying, and strictly set stop losses to control risks.
Crypto Wave: April 6 Ethereum Short-term Reference:
Short position: 2220-2170 range short, stop loss 30 points, target 2150-2100,
Long position: 2080-2110 range long, stop loss 30 points, target 2150-2200,
[The above analysis and strategies are for reference only. Please bear the risk and note that the article may have delays in publication and strategies may not be timely. Do not engage in blind operations.]

This content is originally shared by [Crypto Wave], representing only personal views. The publication of the article may have delays and is for reference only. Do not engage in blind operations! If you want to get more daily real-time signals? Then follow my public account. Here, you can conduct online technical learning and gain knowledge related to exit strategies. I have many years of research experience in the market, focusing on the overall trends in the crypto space. I am mainly responsible for analyzing and guiding investment actions for BTC, ETH, SOL, BCH, and other currencies. Welcome to study and research together.
免责声明:本文章仅代表作者个人观点,不代表本平台的立场和观点。本文章仅供信息分享,不构成对任何人的任何投资建议。用户与作者之间的任何争议,与本平台无关。如网页中刊载的文章或图片涉及侵权,请提供相关的权利证明和身份证明发送邮件到support@aicoin.com,本平台相关工作人员将会进行核查。