Cryptocurrency Expert: On April 8, 2026, Ethereum solidifies key moving average support, bullish momentum rebounds, and the rebound trend is expected to continue! Latest market analysis reference
The current price of Ethereum is 2095, and Ethereum has already sounded the horn of counterattack in the short term! After rebounding from the historical low of 1736, the current price is stabilizing above 2094, and countless people are still hesitating whether it is a rebound; real players have already completed their positioning at key points. The market always rewards those with insight and punishes emotional traders. What we need to do next is to hold heavy positions in trends, lighten positions in fluctuations, and always prioritize risk. Don’t be scared off by short-term corrections; in the main upward wave, every pullback is an opportunity to enter.
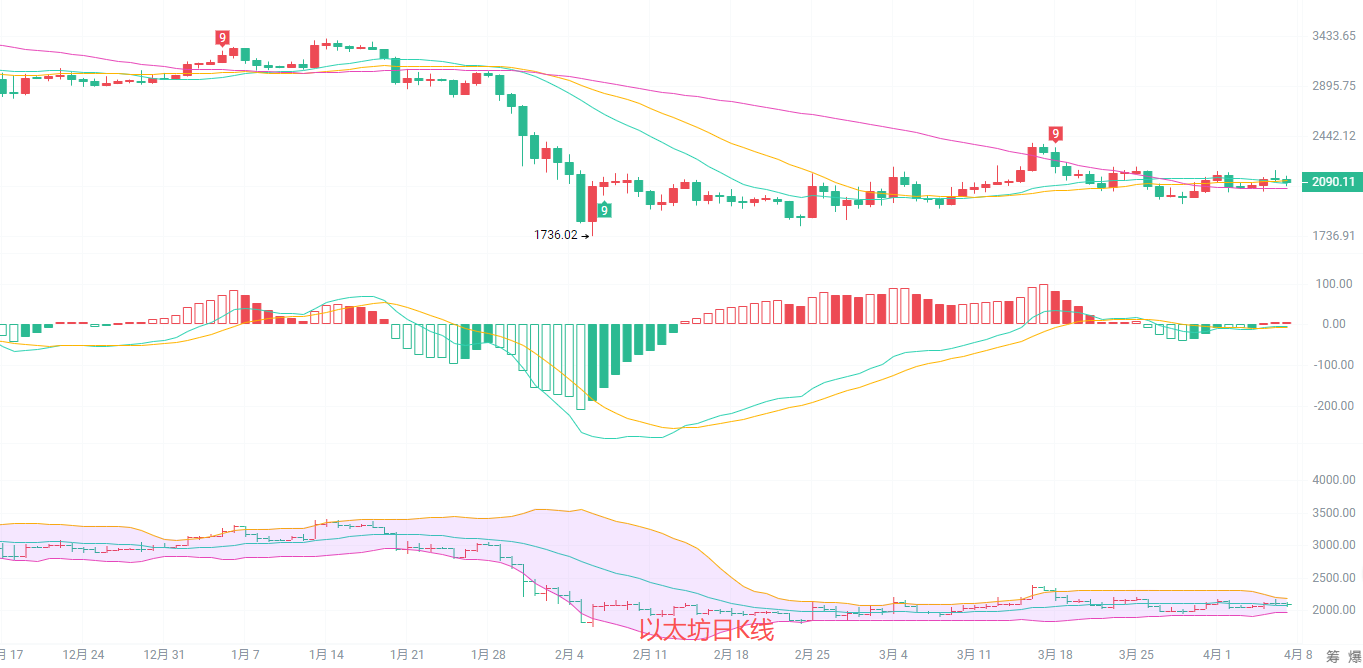
The daily K-line stabilizes with MA20 at 2083, MA30 at 2101, and MA60 at 2047, with MA60 forming strong support. The MACD indicator shows green bars continuously shrinking, with downward momentum significantly weakening and upward counterattack signals clear. The middle track of the Bollinger Bands at 2083 provides strong support, the upper track at 2194 serves as mid-term strong resistance, and the lower side at 1736 supports the historical low. Overall, it is in a stage of bottoming through fluctuations and rebound repairs, with the downward trend gradually ending, and the mid-term trend shifting from south to north, entering a fluctuating upward cycle.
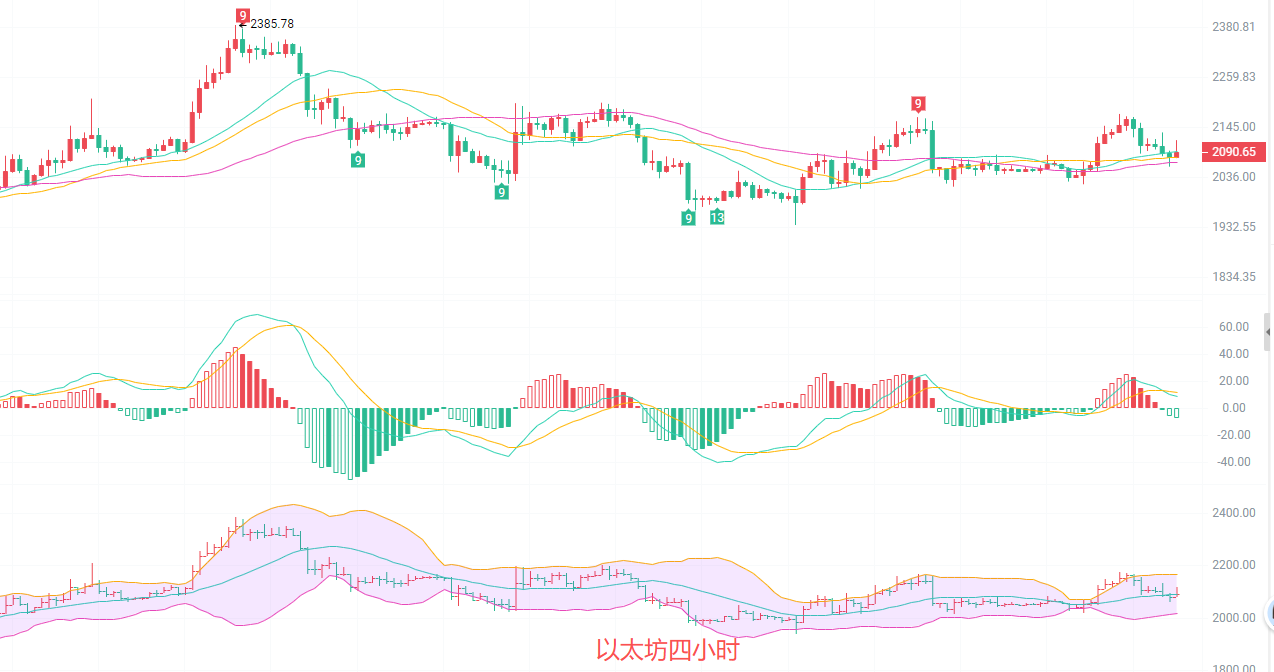
The four-hour K-line breaks through the MA20 line at 2091 and the MA30 line at 2079, stabilizing the MA60 above 2068, with short-term moving averages arranged upward. After the MACD indicator's golden cross, the red bars continue to expand, with upward momentum being strongly released. The middle track of the Bollinger Bands at 2091 provides strong support, and the upper track at 2166 serves as short-term pressure, with the price positioned between the middle track and upper track, indicating a clear bullish short-term trend, with the rebound trend continuing; every pullback is an opportunity for upward movement.
Short-term reference: (Practical data has been updated; please consult the author for details)
For the downside 2080 to 2040 moving up, stop loss at 2010, target looking at 2150 to 2200, break point at 2250
For the upside 2180 to 2220 moving down, stop loss at 2250, target looking at 2120 to 2080, break point at 2050
It is recommended to control the position within 30%, mainly moving up with the trend, and moving down only for short-term speculation; strict stop-loss, do not hold positions.
Specific operations are based on real-time market data; for more information, please consult the author. There might be a delay in article publishing, and suggestions are for reference only at your own risk.

Friendly reminder: The above content is only created by the author of the public account; advertisements at the end of the article and in the comment section are not related to the author, please discern carefully. Thank you for reading.
免责声明:本文章仅代表作者个人观点,不代表本平台的立场和观点。本文章仅供信息分享,不构成对任何人的任何投资建议。用户与作者之间的任何争议,与本平台无关。如网页中刊载的文章或图片涉及侵权,请提供相关的权利证明和身份证明发送邮件到support@aicoin.com,本平台相关工作人员将会进行核查。