Coin Sea Riding the Waves: April 8 Bitcoin (BTC) Market Analysis Reference:
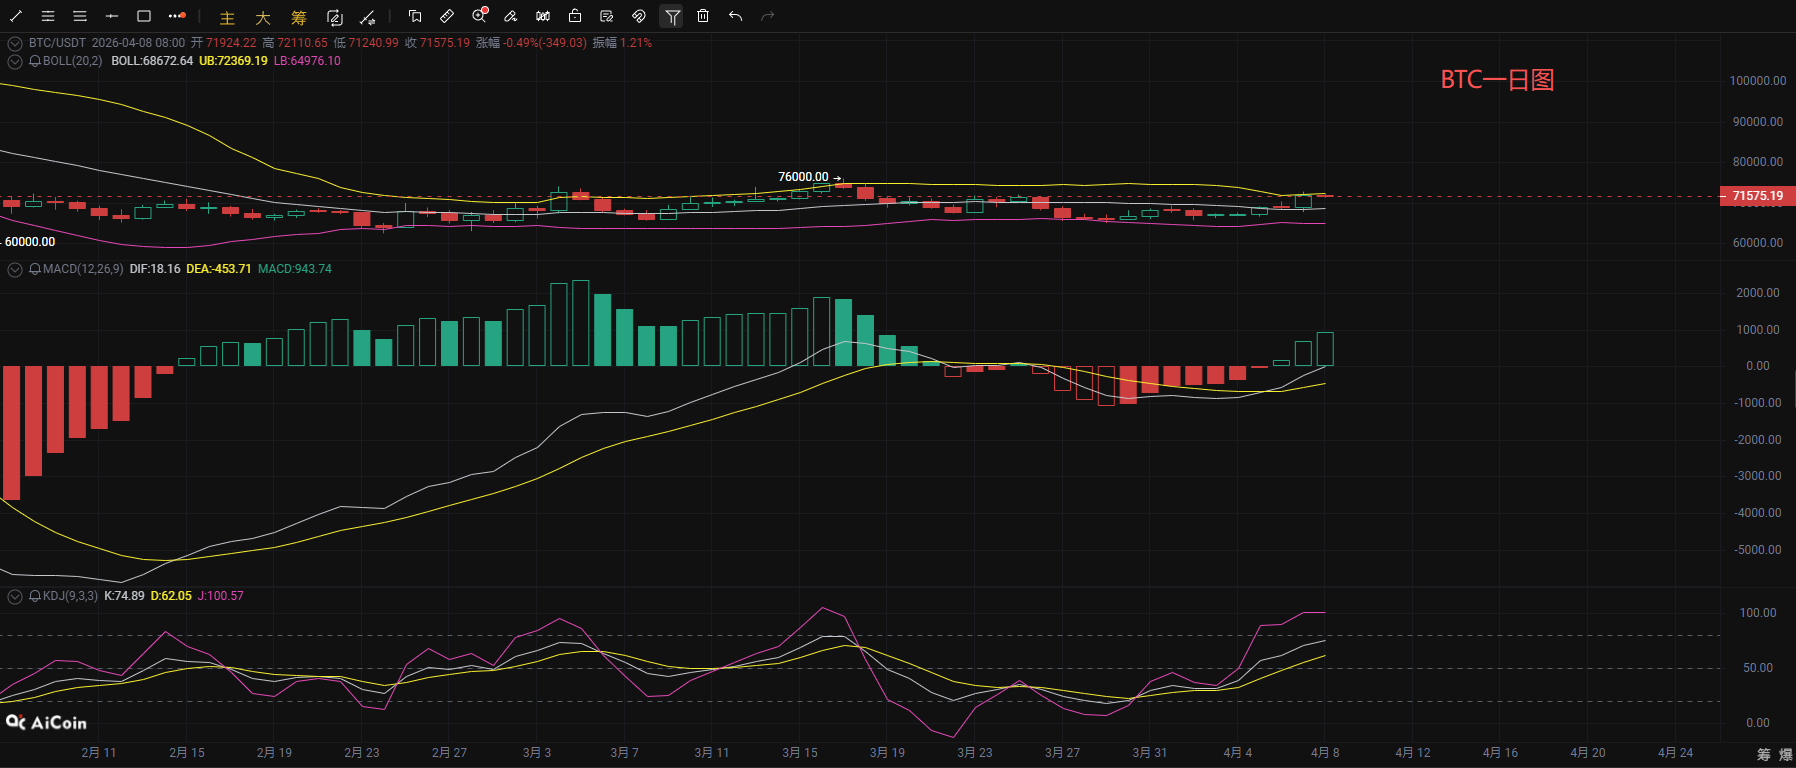
Bitcoin retraced as expected last night to test the lower support, and after stabilizing, it made a strong rebound; this morning it spiked to around 72700 before pulling back, and as of publication, the price is running around 71600. From the BTC daily chart, the current price is above all short to medium-term moving averages, with the EMA20/EMA30 providing core strong support; the Bollinger Bands are continuously expanding, the price is running close to the upper band, which is pulling upwards, with the middle band being a key defense point, reinforcing the medium-term bullish trend. In the MACD indicator, the DIF line and DEA line golden crossed and have continued to diverge upwards, with the MACD histogram being positive and continually amplifying, while bullish momentum is steadily releasing above the zero line, with no top divergence signals, indicating sufficient upward trending momentum. The KDJ indicator's three lines are diverging upwards in sync, with the J value entering the overbought zone, reflecting extremely strong short-term bullish power. Although there is a demand for a correction due to overbought conditions, no reversal signal has appeared yet, thus the main approach is still to follow the trend. Overall, the BTC daily line maintains a bullish trend, with multiple indicators strongly resonating, and the upward structure is complete. The upper pressure to watch is 73000-73500, and a breakthrough could challenge the previous high of 76000; the lower support is 69000-69300, with strong support at 68600, which, if not broken, keeps the trend unchanged.
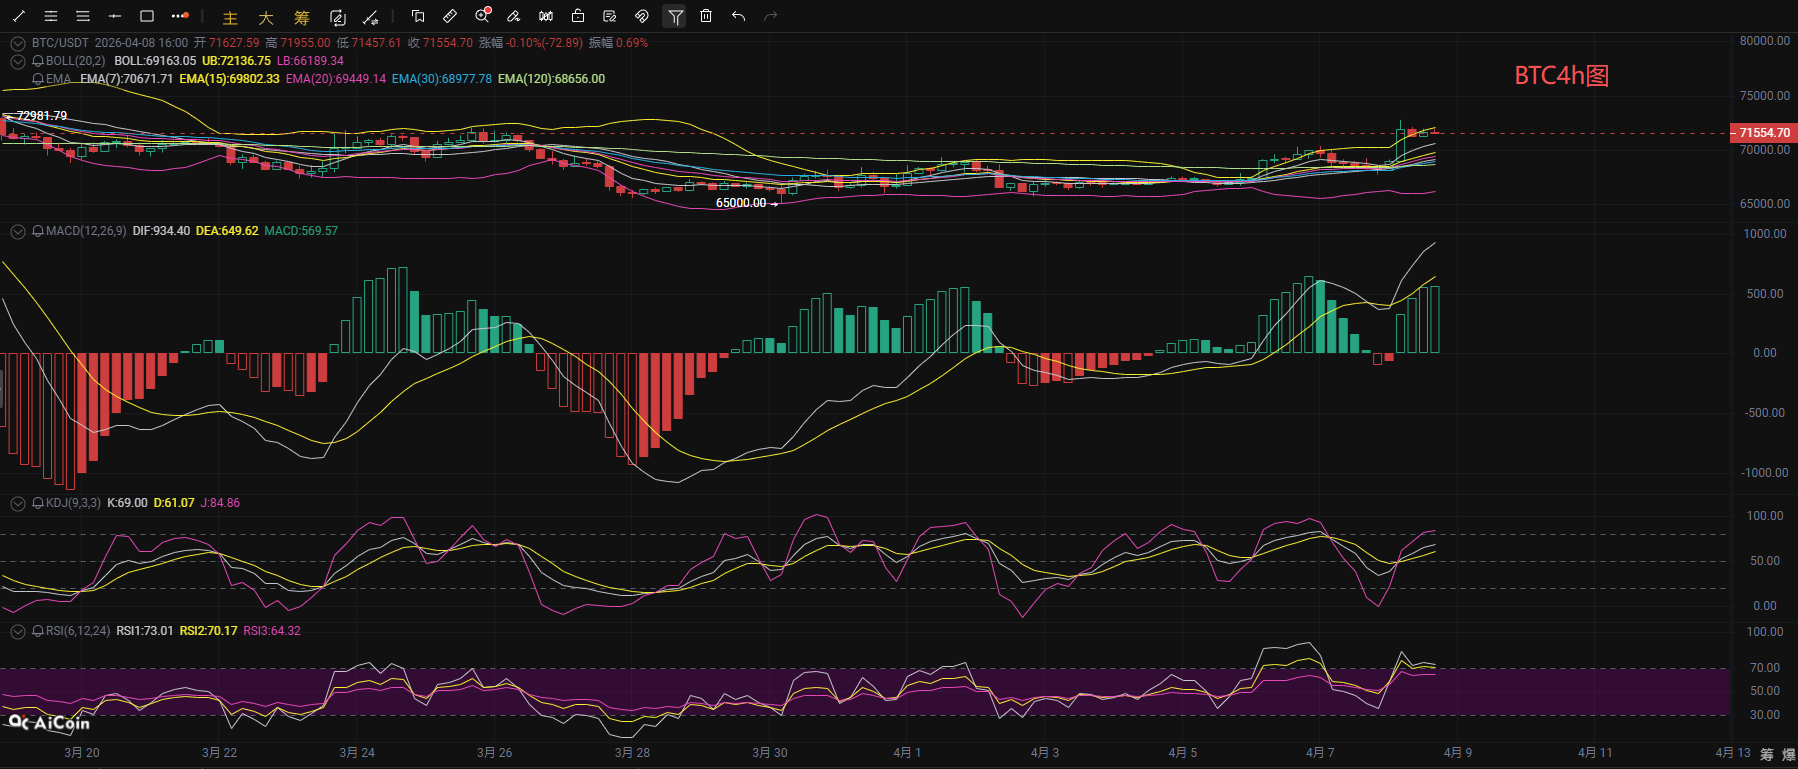
From the short-term hourly chart perspective, the 4-hour level has entered a high-level consolidation phase after a strong spike; bullish momentum still exists, but it has entered the overbought zone in the short term. Overall technical indicators are resonating strongly, while also showing certain correction pressure: the moving average system remains in bullish arrangement, the Bollinger Bands are expanding upwards, and the price is running close to the upper band and is being pulled by it; in the MACD indicator, the DIF and DEA are golden crossing upwards above the zero line in a high position, with volume momentum maintained. Though there is a slight slowdown in the short term, a dead cross has not yet appeared, keeping the bullish pattern dominant. The RSI indicator has slightly retreated from a high position but is still in a strong area, while the KDJ indicator's J value has entered the overbought range, indicating that there is a technical need for a short-term pullback. In terms of operation, one should not blindly chase high prices and should be cautious of rapid pullbacks caused by overbought conditions, ensuring proper risk management. Overall, the current market remains strong, but short-term volatility has intensified. It is advisable to adopt a cautious approach and wait for a stabilization after a pullback before seeking safer entry opportunities.
Coin Sea Riding the Waves: April 8 Bitcoin Short-Term Reference:
Long Position: Buy in the 69300-70300 range, stop loss at 500 points, target at 71500-72500,
Short Position: Sell in the 73000-74000 range, stop loss at 500 points, target at 72500-71500,
Coin Sea Riding the Waves: April 8 Ethereum (ETH) Market Analysis Reference:
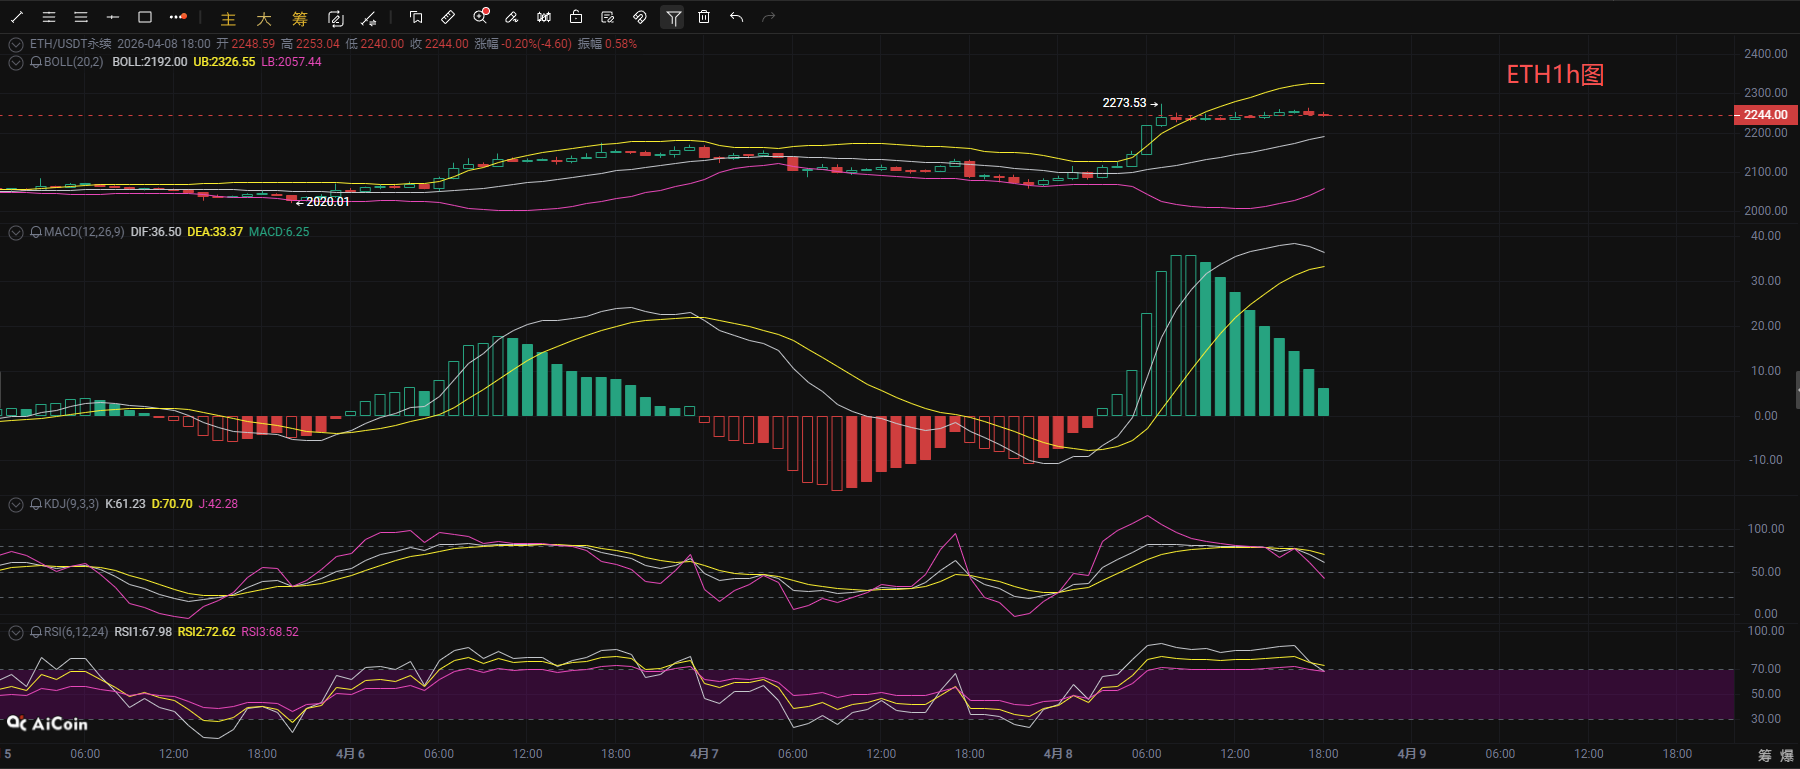
Ethereum's 4-hour level maintains a clear bullish trend, with Bollinger Bands expanding, the price running close to the upper band, the MACD golden cross above the zero line, and sufficient histogram momentum. Both KDJ and RSI are in the overbought area, indicating a well-formed upward structure for the medium term. The 1-hour level presents a high-level stagnation with accumulated pullback pressure, as the MACD histogram continues to shrink, with both lines turning, while the KDJ shows a dead cross at a high position, and the RSI has retreated from the overbought zone, indicating a rapid decline in short-term bullish momentum. With multi-period resonance, Ethereum's medium-term trend remains strongly upward, but short-term will enter a high-level consolidation correction phase. The first upper resistance to watch is the previous high of 2273, and once broken, it could challenge the 2300-2350 range; the strong support on the 4-hour chart is around the Bollinger middle band at 2130, and the 1-hour support is in the 2200-2220 range. If it does not effectively break down, the upward trend is hard to reverse. In terms of operation, one can wait for a pullback to support at low points to go long, avoiding the risk of an overbought correction while closely linking with Bitcoin's movement for effective risk control.
Coin Sea Riding the Waves: April 8 Ethereum Short-Term Reference:
Short Position: Sell in the 2300-2350 range, stop loss at 30 points, target at 2250-2200,
Long Position: Buy in the 2170-2220 range, stop loss at 30 points, target at 2250-2300,
【The above analysis and strategies are for reference only. Please bear the risks yourself, the article may have publication delays, and the strategies lack timeliness. Do not operate blindly】

This content is originally shared by 【Coin Sea Riding the Waves】 and represents personal opinions only. The article may have delays in sending, is for reference only, and should not be operated blindly! Want to get more daily real-time signals? Then follow my public account! Here, you can engage in online technical learning, and learn about related knowledge for exiting positions. I have years of research experience in the market, focusing on major trends in the crypto space. I am mainly responsible for analyzing and guiding investment operations in BTC, ETH, SOL, BCH, and other cryptocurrencies. Welcome to study and learn together.
免责声明:本文章仅代表作者个人观点,不代表本平台的立场和观点。本文章仅供信息分享,不构成对任何人的任何投资建议。用户与作者之间的任何争议,与本平台无关。如网页中刊载的文章或图片涉及侵权,请提供相关的权利证明和身份证明发送邮件到support@aicoin.com,本平台相关工作人员将会进行核查。