Hello everyone, I am Sister Qinglan! Welcome to the Qinglan Crypto Classroom. Today, we will utilize the TPV three-point verification trading system that I have refined for a long time to thoroughly sort out the current market situation, filled with practical, down-to-earth insights!
Step 1: Look at the big picture (multi-timeframe trend overview)
Let's lay out the fundamentals from four timeframes:
1-day timeframe: Closing price 70895.04. The moving averages are in a mixed state, MA5 is 70355.41, MA10 is 68934.21, MA30 is 69650.12. The price is fluctuating among the moving averages, giving a weak directional sense. The on-chain sentiment is "extreme fear," with an index of only 14; this sentiment usually puts pressure on larger timeframe rebounds.
4-hour timeframe: Closing price 70895.04. This shows a bullish arrangement! MA5 is 71253.71, MA10 is 70828.72, MA30 is 69042.17. The price is close to MA10, which counts as a normal pullback in a bullish trend. However, the extreme fear sentiment on-chain makes this bullish trend seem a bit "strong on the outside but weak on the inside."
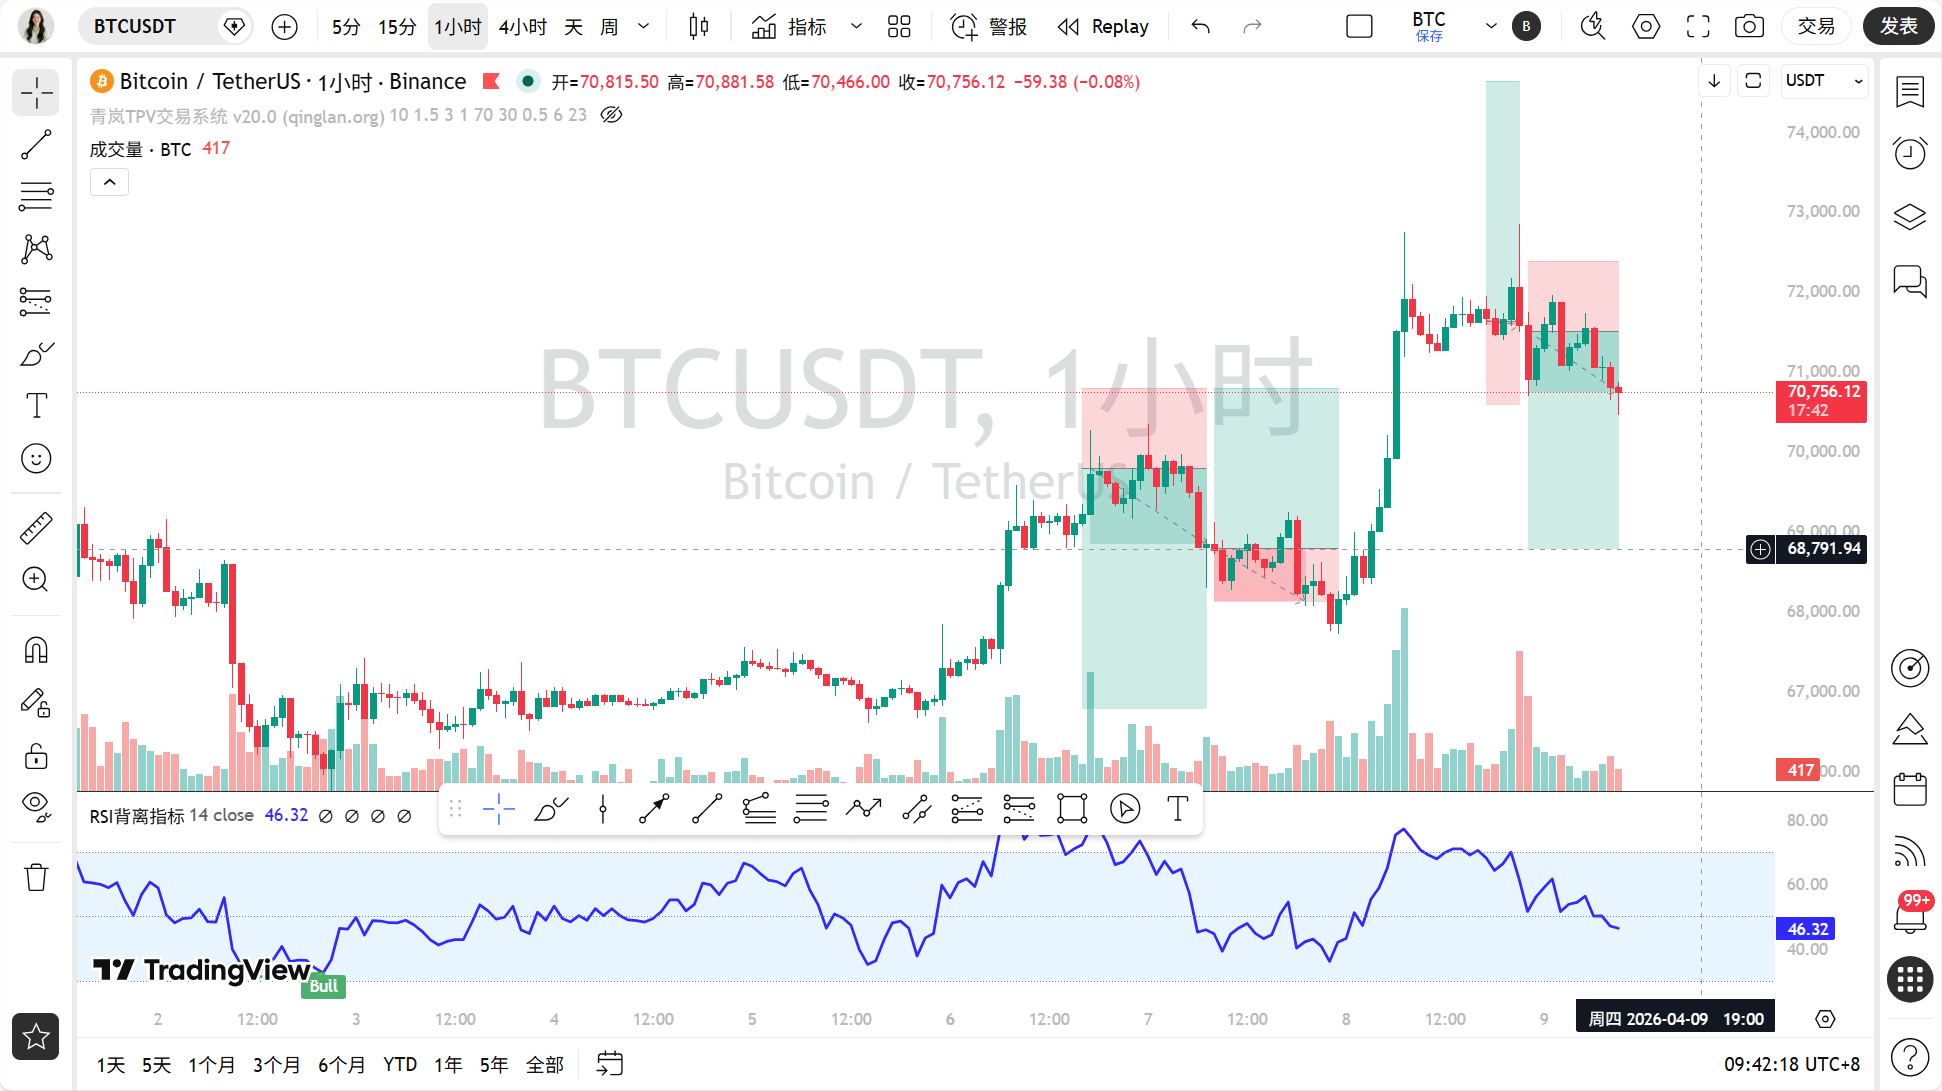
1-hour timeframe: Closing price 70895.04. Bearish arrangement, with MA5 at 71079.34, MA10 at 71267.80, MA30 at 71346.21. The price is below all moving averages, skewing weak in the short term. Negative news such as "Federal Reserve's hawkish tone resurfaces" and "dimming prospects for rate cuts" adds fuel to the downturn for this timeframe.
15-minute timeframe: Closing price 70895.04. Also a bearish arrangement, with MA5 at 70751.39, MA10 at 70864.62, MA30 at 71167.25. This is the smallest timeframe, with the fastest fluctuations, and the current price struggles between MA5 and MA10.
Step 2: Identify pivot points, draw key lines (valid highs and lows + trend lines)
Let's find the "joint" positions for each timeframe:
1-day: The most recent valid high is 72857.0 (from the highest price in 4h), the valid low is 70466.0 (from the lowest price in 4h). The price is now hovering near the lower edge of this range, crucially!
4-hour: Valid high at 72857.0, valid low at 70466.0. A rising trend line can be drawn connecting the lows, but the price recently broke below it and needs reconfirmation.
1-hour: Valid high at 72857.0, valid low at 70466.0. Similarly, the price is testing this low support area.
15-minute: Valid high at 72857.0, valid low at 70466.0. The small timeframe is also observing the key positions of the larger timeframe.
In the news, headlines like "Bitcoin may continue to test lower" coincidentally appear when the price is testing this key low of 70466.0, indicating a resonance between market sentiment and price levels.
Step 3: Indicators to support (technical indicator verification)
Let's see what the indicators say:
1-day: The MACD histogram is positive at 418.40, but the DIF (230.02) and DEA (-188.38) have not crossed positively yet, suggesting momentum is available but the trend has not fully reversed. RSI is at 58.06, slightly stronger than neutral, confirming the daily oscillation pattern.
4-hour: The MACD histogram is positive at 88.91, with DIF (917.16) above DEA (828.25), indicating bullish momentum is still present. RSI is at 58.08, also slightly stronger than neutral, validating the bullish arrangement of the moving averages.
1-hour: The MACD histogram is negative at -165.42, with DIF (143.11) below DEA (308.53), showing evident bearish momentum. RSI is at 41.52, approaching but not yet in the oversold territory, indicating more space for decline. This aligns with the price being in a bearish arrangement below the moving averages.
15-minute: The MACD histogram is negative at -23.92, indicating bearish momentum. RSI is at 39.50, nearing oversold. The indicators in the small timeframe are generally bearish.
No significant divergence signals are currently observed.
Step 4: Bull vs Bear showdown (news + on-chain analysis)
On the news front:
Bearish factors have piled up! "Federal Reserve's hawkish tone resurfaces," "more officials mention the possibility of rate hikes," "dimming prospects for rate cuts," and "inflation may last longer." The core issue is the hawkish stance of the Federal Reserve, which is the most crucial factor suppressing the market currently, expected to continue affecting it.
There are also bullish factors: "Michael Saylor says Bitcoin has bottomed out," and "Morgan Stanley's Bitcoin spot ETF is attracting funds." However, compared to the power of the Federal Reserve, these bullish points seem a bit weak.
The technical and news aspects are currently "divergent!" The 4-hour technical aspect appears bullish, but the news is overwhelmingly bearish, which is quite dangerous.On-chain data:
The sentiment indicator shows "extreme fear," with an index of only 14, reflecting extremely pessimistic sentiment. BTC's dominance is at 56.96%, indicating no large-scale flight from Bitcoin. The total market cap is 2.485 trillion, with a 24-hour change of -1.33%.
The on-chain data and the short timeframe technicals (1h, 15m bearish) are in "resonance," pointing toward pessimism. However, this is "divergent" from the bullish technical formation of the 4-hour timeframe.
Step 5: The path of least resistance (trading strategy)
Overall, the market is dominated by bearish news and panic sentiment, with the short timeframe technicals completely turning bearish. Although the 4-hour chart still shows a bullish structure, in such an atmosphere, it can easily collapse.
Current suggestion: Cautiously bearish.
Key entry observation area: If the price rebounds and faces resistance near the 4-hour MA5 at 71253.71, or if it breaks below the daily key low of 70466.0, both are bearish signals.
Stop-loss basis: If the price strongly rises above the 4-hour high of 72857.0, the bearish logic will fail.
Target area: First, observe whether it can effectively break below 70466.0; if it breaks, the downside space may open up.
Step 6: How will today unfold (market prediction)
Current (within a few hours): There is a high probability of weak fluctuations within the range of 70466.0 to 71253.71, as the small timeframes are all in bearish arrangement.
Key for today and near-term: Today's most crucial support level is 70466.0! This is the lifeline for bulls and bears. The most important resistance levels are 71253.71 (4-hour MA5) and 72857.0 (previous high).
Trading thought process: The most suitable approach now is to "short on rallies" or "chase short when breaking key support." The reasoning is straightforward: bearish news pressure, extreme fear in market sentiment, and a bearish arrangement in small timeframe technicals create a resonance. The risk of counter-trend bottom-fishing is very high.
Conclusion: The core contradiction in the current market is the confrontation between the "4-hour bullish technical structure" and the "macroeconomic bearish news and market panic sentiment."
Trading wisdom: The Federal Reserve's "hawkish tone" reverberates in the market, traders need to listen for the direction of least resistance, just like listening to the wind, rather than opposing the strong trend.
[Qinglan's personal opinion]
Oh dear, looking at this market, Sister Qinglan felt a tightness in her heart. With overwhelming bearish news, the sentiment index dropping to "extreme fear," this is when bullish signals on the technicals should be taken with caution. In trading, we cannot just look at charts and draw lines; the market's "heartbeat" — meaning sentiment and news — often proves more useful at critical moments. Today, I will be especially cautious, looking more and acting less, waiting for the market to choose a clear direction before acting; preserving capital is more important than anything else. Of course, this is just my personal feeling, not investment advice!
This TPV system is something I've refined over the years of monitoring the markets, reviewing trades, and practical experience; I dare not say it is 100% accurate, but at least it can give us more confidence at critical positions. If you want to be the first to grasp the latest entry opportunities based on the TPV system, welcome to visit the Qinglan crypto classroom official website www.qinglan.org
免责声明:本文章仅代表作者个人观点,不代表本平台的立场和观点。本文章仅供信息分享,不构成对任何人的任何投资建议。用户与作者之间的任何争议,与本平台无关。如网页中刊载的文章或图片涉及侵权,请提供相关的权利证明和身份证明发送邮件到support@aicoin.com,本平台相关工作人员将会进行核查。