Original author: Glassnode
Original translation: AididiaoJP, Foresight News
Bitcoin rebounded from sixty-seven thousand dollars to seventy-two thousand dollars, but weak spot demand and slowing futures activity indicate that this recovery still lacks strong confidence, with ETF fund flows beginning to show slight positive inflows.
Summary
- Bitcoin remains in a sluggish and confidence-lacking market environment. Weak spot activity and decreased derivative participation continue to limit the sustainability of upward price movements.
- Binance's thirty-day relative trading volume is still below the baseline. This indicates a lack of strong organic demand behind the recent price stabilization.
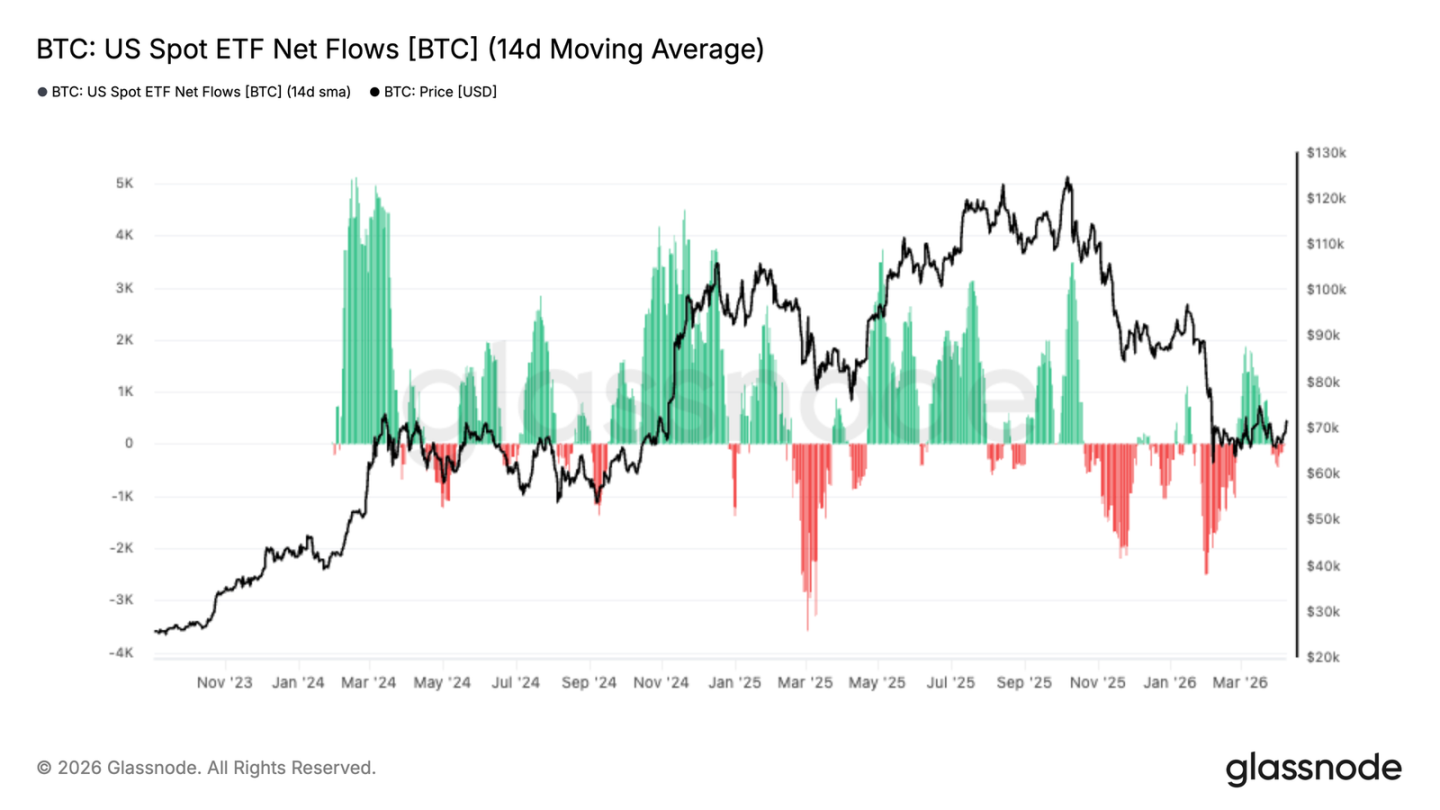
- Funds flow for the U.S. spot ETF is beginning to improve. After experiencing a long period of net outflows, it has shifted back to slight net inflows. This suggests early signs of institutional demand returning around the current price levels.
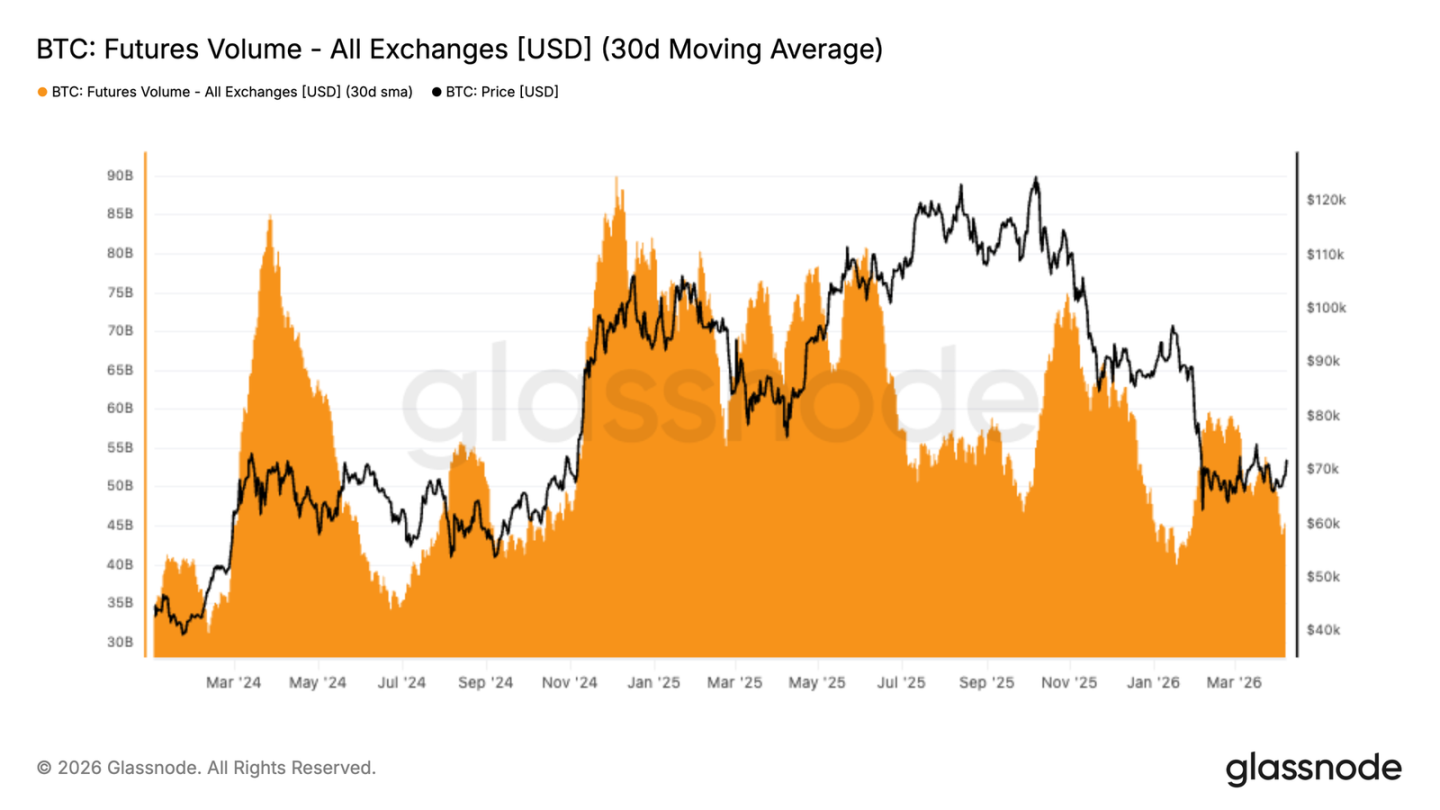
- Futures trading volume has significantly declined, with the thirty-day average turning downward and trending lower. This reinforces the view that after recent deleveraging events, traders are sitting on the sidelines rather than actively re-engaging.
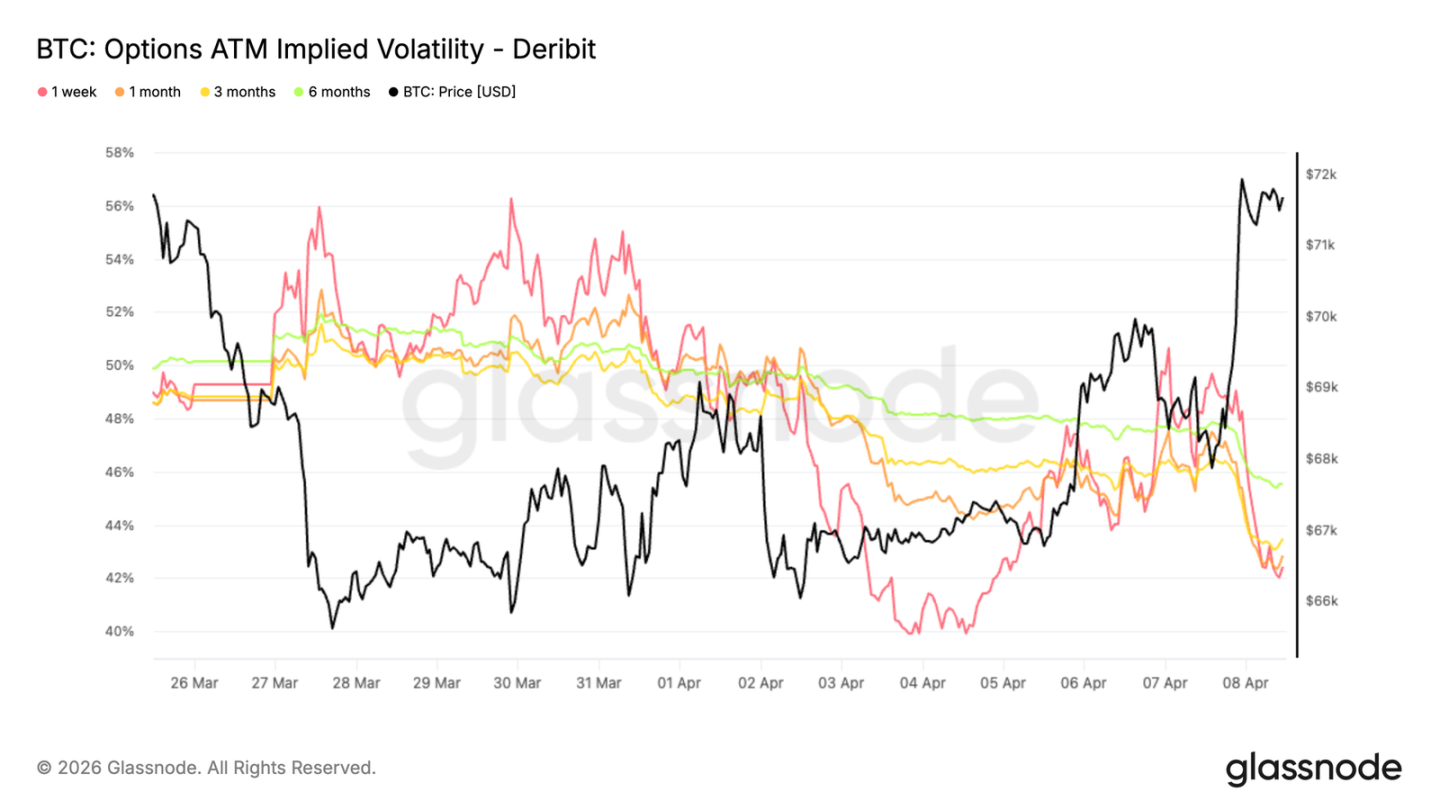
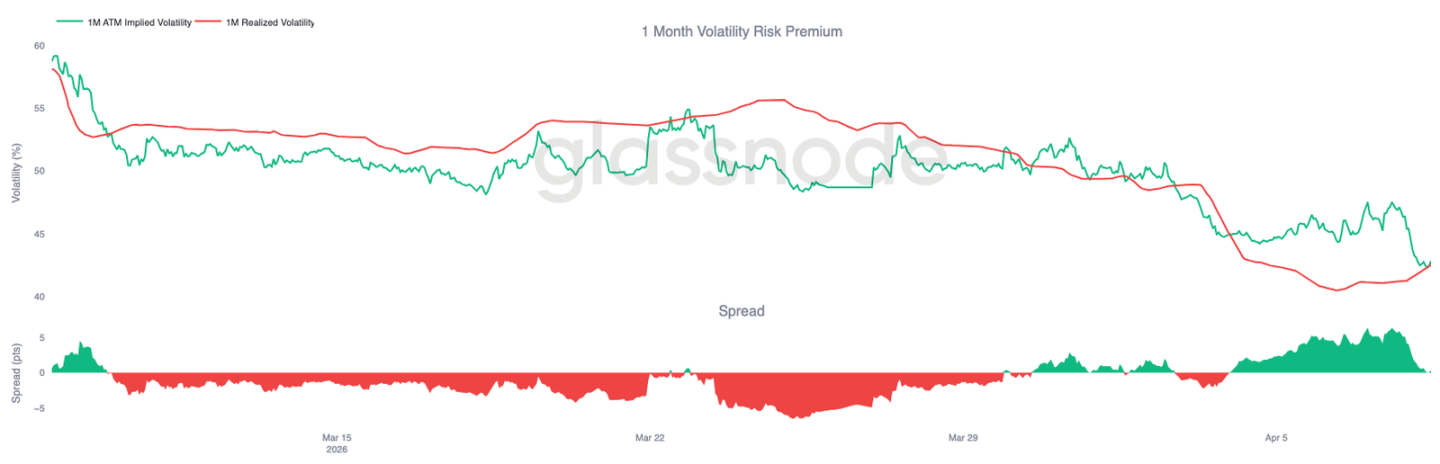
- From the perspective of implied volatility, option prices have decreased across the curve, with short-term volatility retreating to around 40%, and six-month volatility around 45%, reflecting widespread repricing of expected volatility.
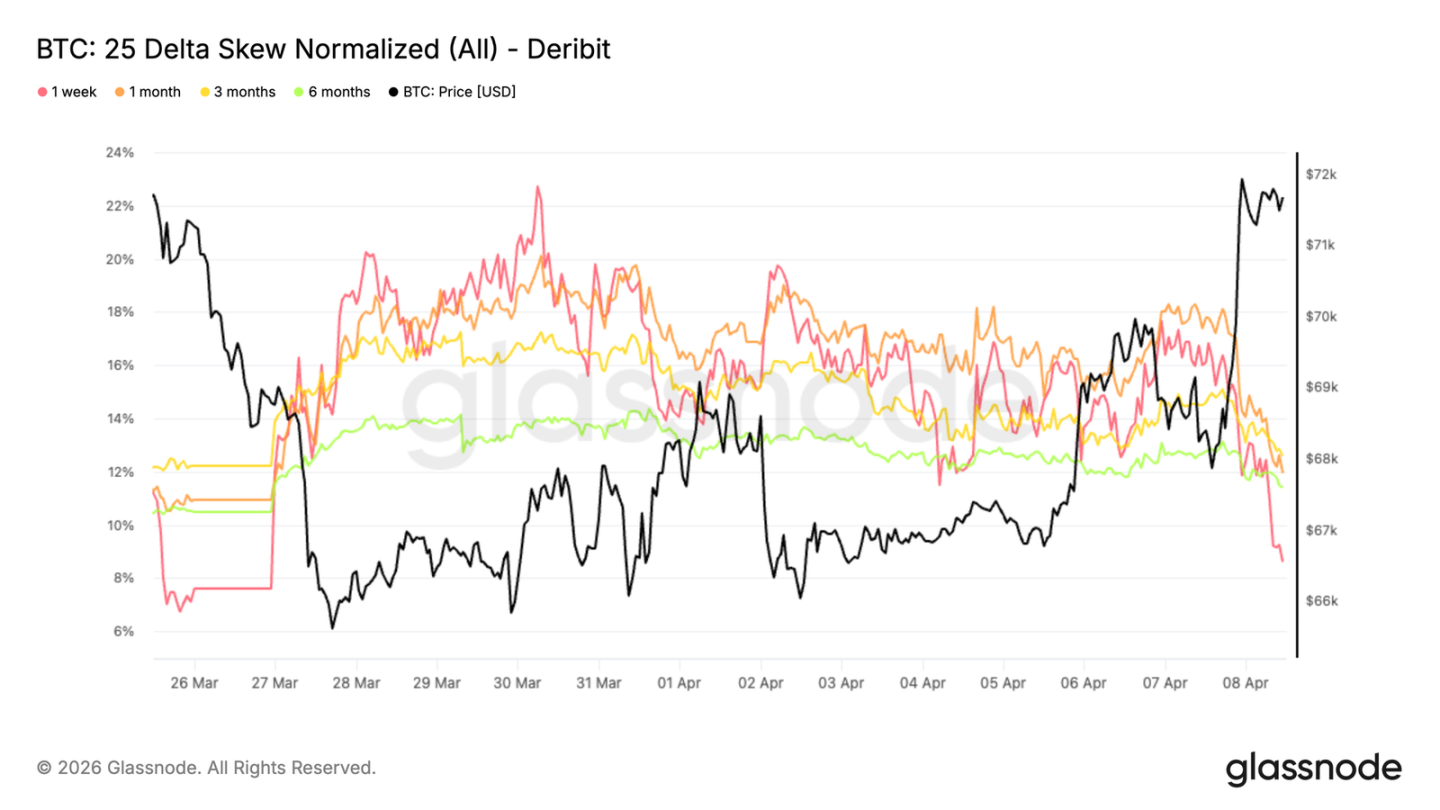
- Despite the overall relief in volatility, the relative pricing of options still reflects a defensive bias. The skew remains tilted toward put options, indicating that the price of downside protection remains higher than upside exposure. This shows that participants are willing to reduce overall volatility exposure but are reluctant to give up protection against adverse movements.
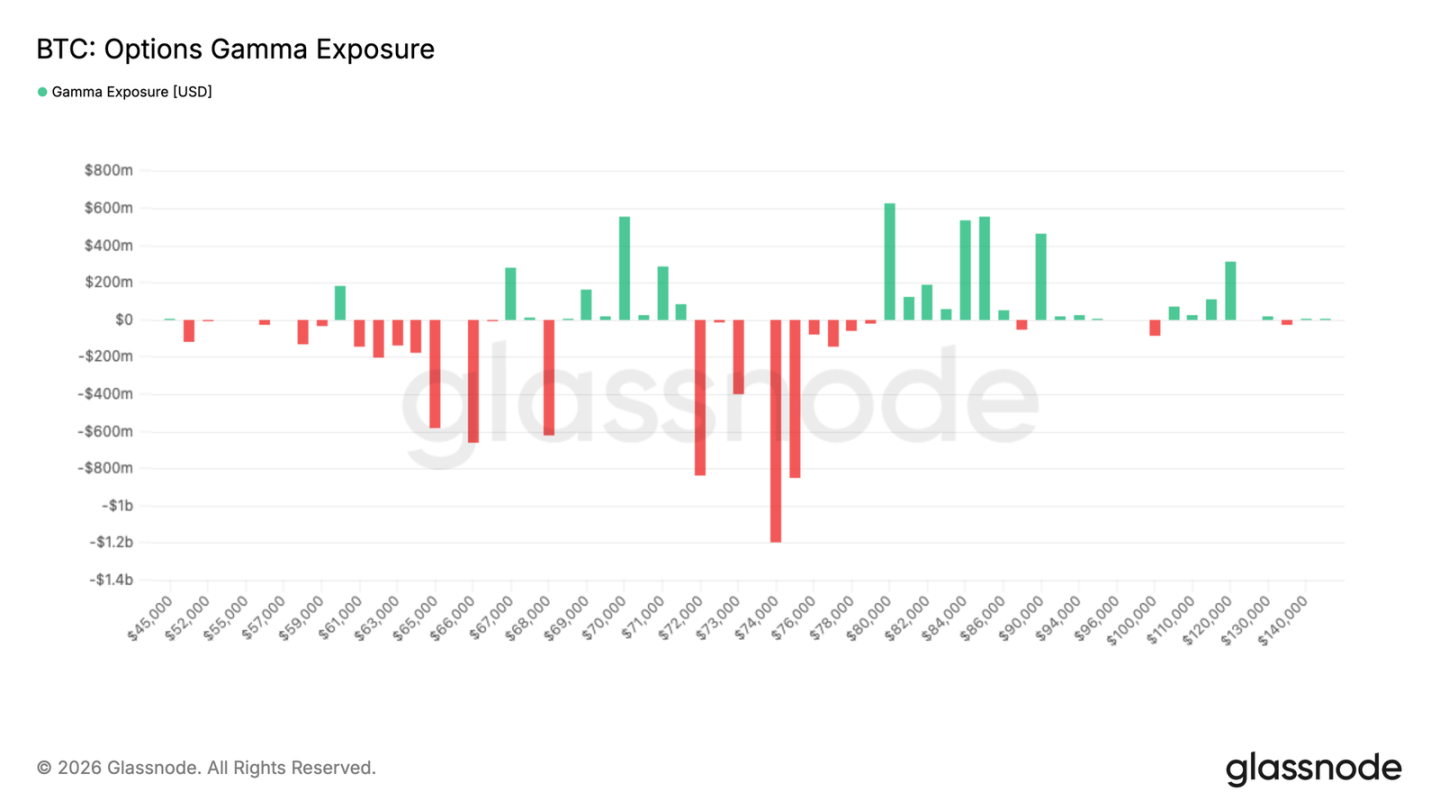
- When moving from pricing to actual market behavior, price fluctuations continue to ease. The market has stabilized after earlier turbulence, with reduced leverage and less aggressive volatility. However, this calmness comes with a decrease in participation, and trading volume has shrunk. Turning to market maker positions, there has been a significant change in gamma distribution compared to last week. Negative gamma is primarily above the current price, while a positive gamma region has formed between 69,000 and 71,500. This provides short-term downside support, as traders have an incentive to buy when prices fall within that range.
Overall, the market is transitioning to a more balanced structure. Downward fluctuations may be further suppressed in the short term, while resistance is accumulating above.
On-chain Insights
After weeks of geopolitical tension leading to increased uncertainty in energy, equity, and Bitcoin markets, initial signs of de-escalation are beginning to create space for a potential rebound above seventy thousand dollars.
In this context, this report shifts the focus from short-term price noise to examine the most direct on-chain resistance and support levels impacting the medium to long-term outlook, along with a broader assessment of investor behavior and sentiment.
Still within the Bear Market Value Range
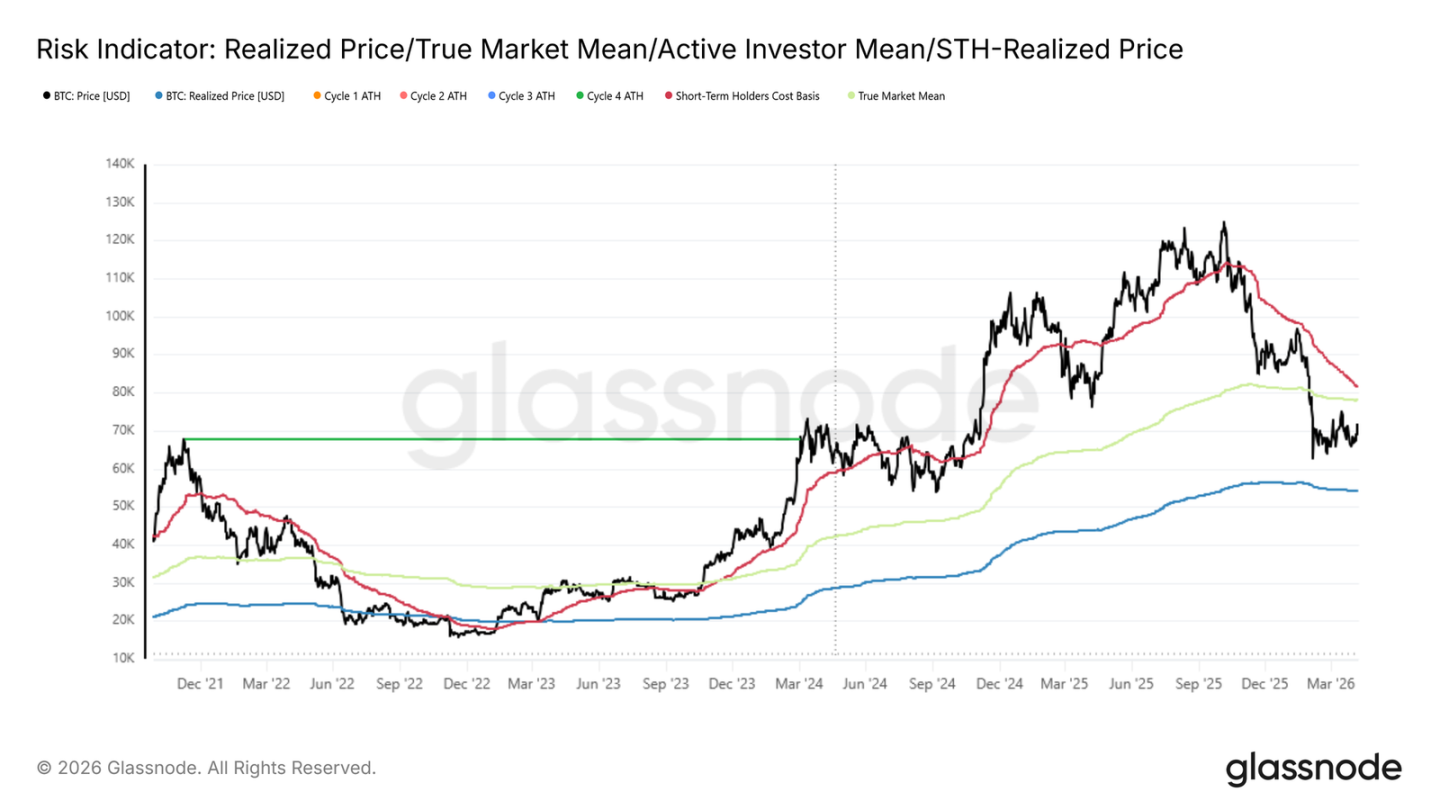
Based on the macro backdrop outlined above, comparing spot prices with key on-chain pricing models reveals that the market is structurally still within bear market territory.
The realized price of 54,000 represents the average buying cost for all circulating supply. The true market mean is 78,000, narrowing the calculation to include only tokens that are actively traded. These two prices collectively define the boundaries of the current bear market value range.
Historically, trading within this range usually indicates that the market has not transitioned to a sustainable recovery phase. Complicating matters, spot prices remain below the cost baseline for short-term holders, which is 81,600 dollars. This level represents the breakeven point for recent buyers overall, making it a particularly significant threshold. Until prices reclaim this level, the medium to long-term bias remains downward. Any rebound entering this area may face significant selling pressure from recent buyers looking to exit around breakeven or close to it.
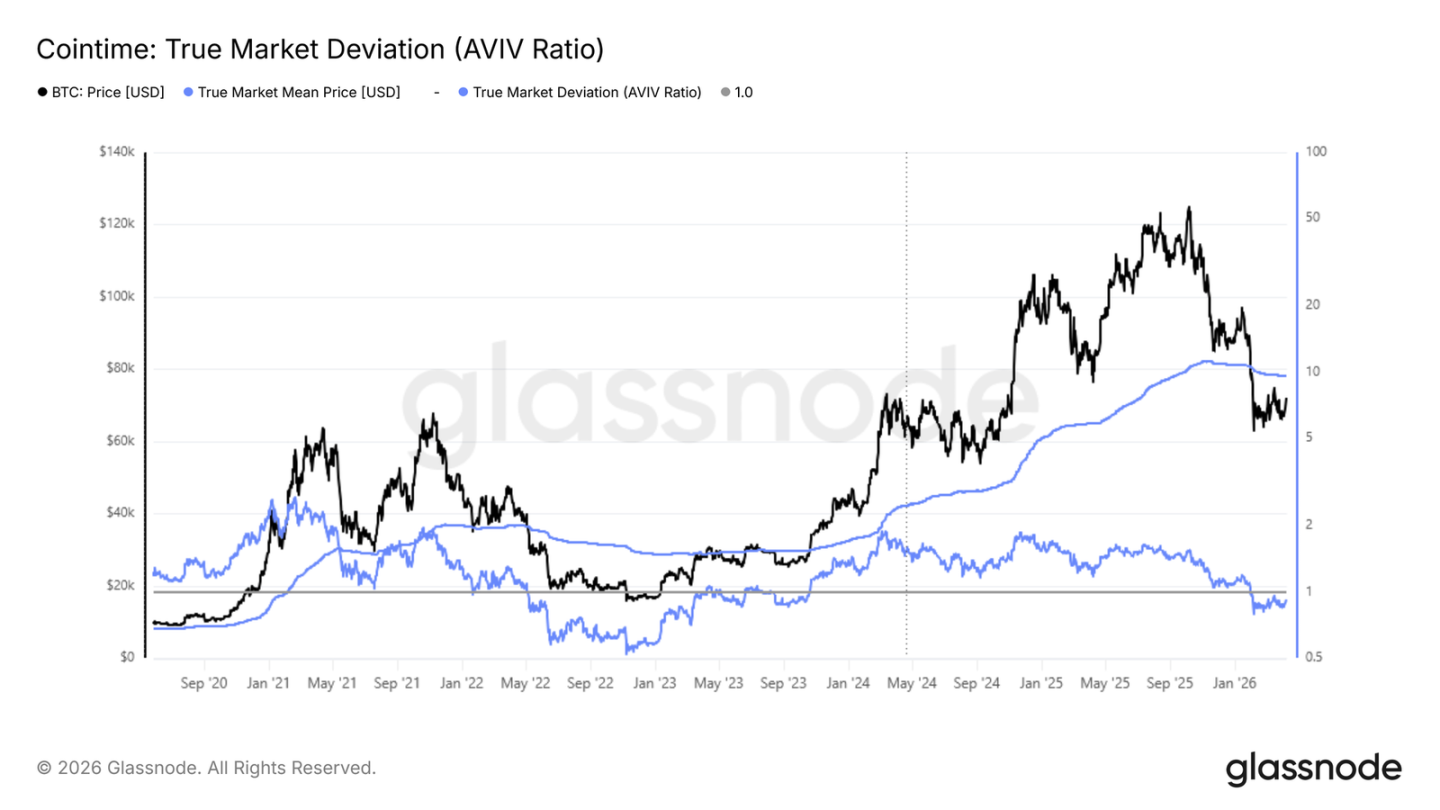
Using AVIV Indicator to Calibrate Bear Market Depth
Since the true market mean of 78,000 is likely the medium-term ceiling for any rebound, the AVIV ratio provides a precise quantitative perspective for comparing the current market state with past bear market cycles.
This indicator is defined as the ratio of the spot price to the true market mean. It is used to measure how far market prices deviate from the cost baseline of active investors, serving as a valuation barometer across different cycle stages.
The current ratio is 0.92 and has remained below 1 since early February. The AVIV ratio positions the current environment close to market conditions observed from May to June 2022. This confirms that we are in a bear market environment, although still significantly higher than the extremely low readings observed in Q3 and Q4 of 2022.
This comparison does not predict further deterioration in the market but provides a framework for calibrating the potential depth and duration of the current bear market phase based on similar historical precedents. The recovery timelines across different cycles have varied widely.
Progress of the Surrender Process is Key
Synthesizing the structural picture above, Bitcoin remains within the range fluctuations of a traditional bear market. A short-term rebound to the 78,000 true market mean is possible, but still lacks substantial support for a change in potential momentum.
Before a sustainable recovery can be realized, two conditions must be met.
- The first condition is stabilization of the cost baseline for short-term holders. This indicator is still in a downward trend.
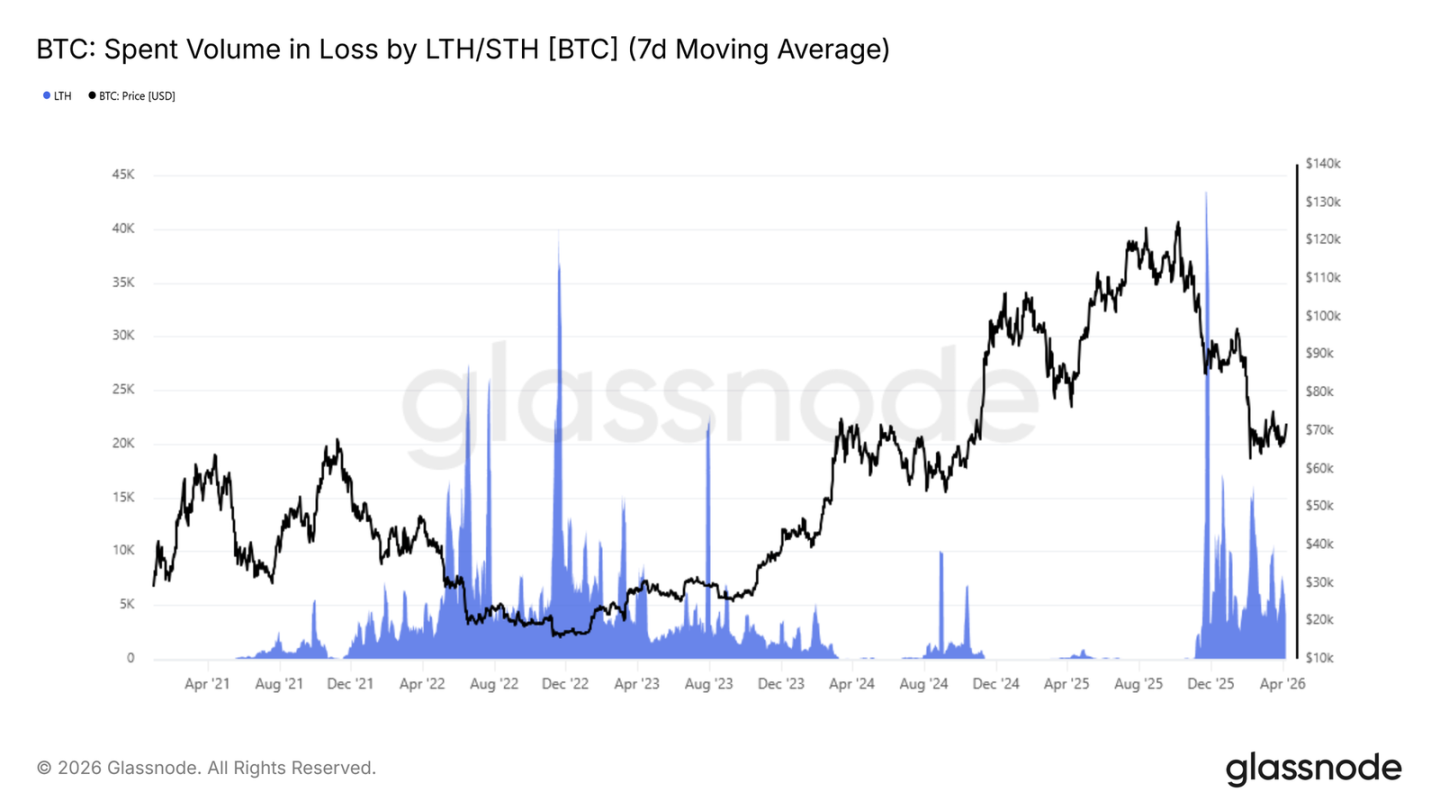
- The second condition is the significant abatement of realized loss pressure from investors who bought near cycle peaks.
The latter can be monitored through the seven-day moving average of realized loss amounts for long-term holders. Since November 2025, this indicator has remained above four thousand bitcoins per day. This reflects that top buyers are still surrendering and have not yet liquidated their loss positions. A continued decline of this indicator to below one thousand bitcoins per day, coupled with prices reclaiming the cost baseline for short-term holders of 81,600 dollars, would jointly constitute the most reliable on-chain confirmation signal. This indicates that the current bear market phase is transitioning toward a recovery structure in the prelude to a bull market.
Off-chain Insights
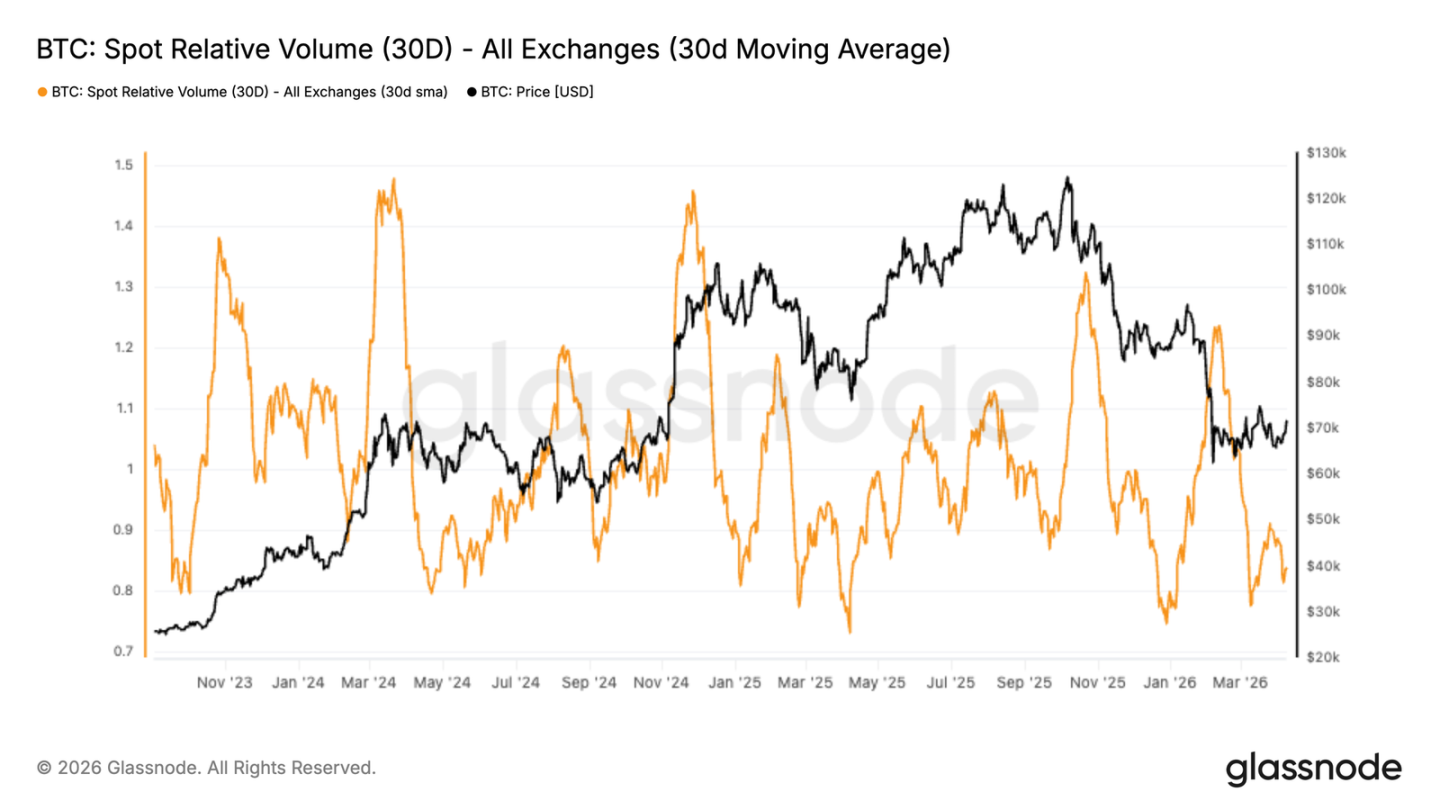
Spot Fund Flows Remain Weak
Spot activity remains weak. Binance's thirty-day relative trading volume is still below the baseline, hovering near the lower end of its range. Recent data shows only a small rebound, but no signs of significant return to participation.
While prices have successfully stabilized, this has been achieved in the absence of strong spot support. This indicates that the market is still driven by derivatives and short-term positions rather than sustained buying interest.
Before spot demand rises, any rebound may still appear weak and limited in sustainability. A noticeable expansion in trading volume would signal stronger confidence and a healthier foundation for ongoing price increases.
ETF Fund Flows Slightly Positive
Funds flow for the U.S. spot ETF is beginning to improve. The fourteen-day average has shifted back to slight net inflows after a long period of net outflows. The extent of this change is still small but significant directionally.
The previous continuous selling clearly indicated an obvious distribution phase, and this pressure appears to be easing now. There are initial signs of demand re-entering around current price levels.
If inflows continue to increase, they would provide stronger support for the market. Currently, this feels more like an initial stabilization rather than a full return of institutional demand.
Futures Trading Volume Dramatically Shrinking
Futures trading activity has significantly declined, with the thirty-day average turning downward and trending lower following the recent price drop. Trading volume has compressed back to its range lows, reflecting a notable decrease in derivative market participation.
This slowdown is accompanied by a reduction in open interest. This reinforces the view that leverage is not only being passively unwound but traders are also stepping back to observe rather than immediately re-engage. The recent rebound has lacked strong volume, indicating limited confidence in this upward move.
Currently, derivative activity remains sluggish, pointing to a calmer and less aggressive market environment. A rebound in futures trading volume would be an early signal of trader return and potential momentum rebuilding.
Implied Volatility Declining Across All Expirations
Looking first at implied volatility, option pricing has declined across the entire term curve. Short-term volatility has softened significantly, now returning to just over forty-one percent. The long-term volatility has also slightly declined, with six-month volatility around forty-five percent.
The announcement of a ceasefire agreement in Iran further depressed volatility, accelerating the volatility compression that had already occurred. This shift indicates that the market is pricing in a calmer recent environment. While there are signs of de-escalation in conflict, confidence remains limited, with participants less willing to pay a premium for protection or convexity exposure.
This points to a low-confidence backdrop, with traders not actively positioning for upcoming catalysts. Meanwhile, this repricing has made options more accessible for participation, helping to position ahead of known events. The key dynamic to watch is whether this compression will lead to a rekindling of activity or merely extend the current state of low participation.
Skew Signals Persistently Cautious
Despite the overall relief in volatility, the relative pricing of options still reflects a defensive bias. Although skew has slightly eased following the ceasefire announcement, with the put option side dropping from near twenty to just above ten percent, this adjustment seems more like a news-driven squeeze rather than a structural shift in demand between calls and puts.
The skew remains tilted toward put options, meaning that the price of downside protection is still higher than upside exposure. This indicates that participants are willing to reduce overall volatility exposure but are not willing to give up protection against adverse movements.
The combination of declining volatility and persistent put option demand suggests that the market is not positioned for a strong upward move but remains cautious about downside risks. Traders continue to prioritize protection.
Realized Volatility Continues to Decline
Shifting from pricing to actual market behavior, price fluctuations are continually easing. Bitcoin's thirty-day realized volatility is currently at forty-two point five percent, significantly below recent averages. This reflects that the market has calmed down after earlier turbulence, with reduced leverage and less aggressive volatility.
However, this calmness comes with a decrease in participation, and trading volume has also shrunk. Under these conditions, prices become more sensitive to incremental fund flows. This means relatively small trades can move the market but fail to establish a clear trend. With limited liquidity, price action is increasingly driven by short-term fund flows rather than sustained directional momentum.
This environment does not signal strength but points to a lack of participation. The market is reacting more passively rather than leading actively. With implied volatility also decreasing, the one-month volatility risk premium is currently close to zero. Historically, this structure has provided attractive entry points for volatility buyers.
Gamma Positioning Shifts to Provide Support Below Spot
Turning to dealer positions, there has been a significant change in gamma distribution compared to last week. Previously, the market was within a wide negative gamma range extending from the low forty thousand dollar area to eighty thousand dollars. This created conditions for traders to hedge, potentially amplifying price movements in either direction.
This structure has now evolved. Negative gamma is primarily located above the current price. Meanwhile, a positive gamma region has formed between 69,000 and 71,500 dollars. This provides short-term downside support, as traders have an incentive to buy when prices fall within that range.
Recent geopolitical developments have also rekindled interest in upside exposure. However, this is expressed through the spread structure. This explains why negative gamma has reappeared above further spot prices, especially beyond the eighty thousand dollar area.
Overall, the market is transitioning to a more balanced structure. Downward fluctuations are likely to be further suppressed in the short term, while resistance is accumulating above.
Conclusion
In the spot, futures, and options markets, the dominant theme is stabilization in the absence of strong confidence. Spot participation remains weak, while futures activity has significantly shrunk. Although flows from exchange-traded funds have slightly turned positive, the broader market still lacks the demand depth typically associated with more sustained recovery phases.
The options market echoes this message. Implied volatility has compressed across the entire term curve, but the skew still favors put options. This indicates that traders are willing to reduce volatility exposure but have not given up on downside protection. Meanwhile, realized volatility continues to ease, reflecting a calmer but thinner market backdrop. In this context, incremental fund flows may still exert excessive influence on prices.
In summary, the market appears to be shifting toward a clearer, more balanced structure following recent clearing but has not yet entered a fully positive constructive trend. Achieving this transition may require stronger spot demand, broader participation, and more decisive re-engagement from the derivatives market.
免责声明:本文章仅代表作者个人观点,不代表本平台的立场和观点。本文章仅供信息分享,不构成对任何人的任何投资建议。用户与作者之间的任何争议,与本平台无关。如网页中刊载的文章或图片涉及侵权,请提供相关的权利证明和身份证明发送邮件到support@aicoin.com,本平台相关工作人员将会进行核查。


