Cryptocurrency Academician: On April 10th, the inflection point for Ethereum's long and short positions is clear. As long as 2150 support holds, the main strategy is to go long! Latest market analysis reference
Ethereum's current price is 2210. In the short term, we should follow the trend. This wave moved from 1736 to 2200; how many people were afraid to get on at the bottom and chased high at the top, ultimately missing the opportunity? There are no myths in trading; only precise points and strict risk control. The market is now entering a main upward wave, do not chase high, buying on dips is key. Strictly execute stop losses, do not hold positions, do not be greedy, and take profits when you see them. The cryptocurrency space is not lacking in opportunities, but lacks the ability to seize them. Follow my thoughts, and I'll lead you to steadily profit from the market without missing out again!
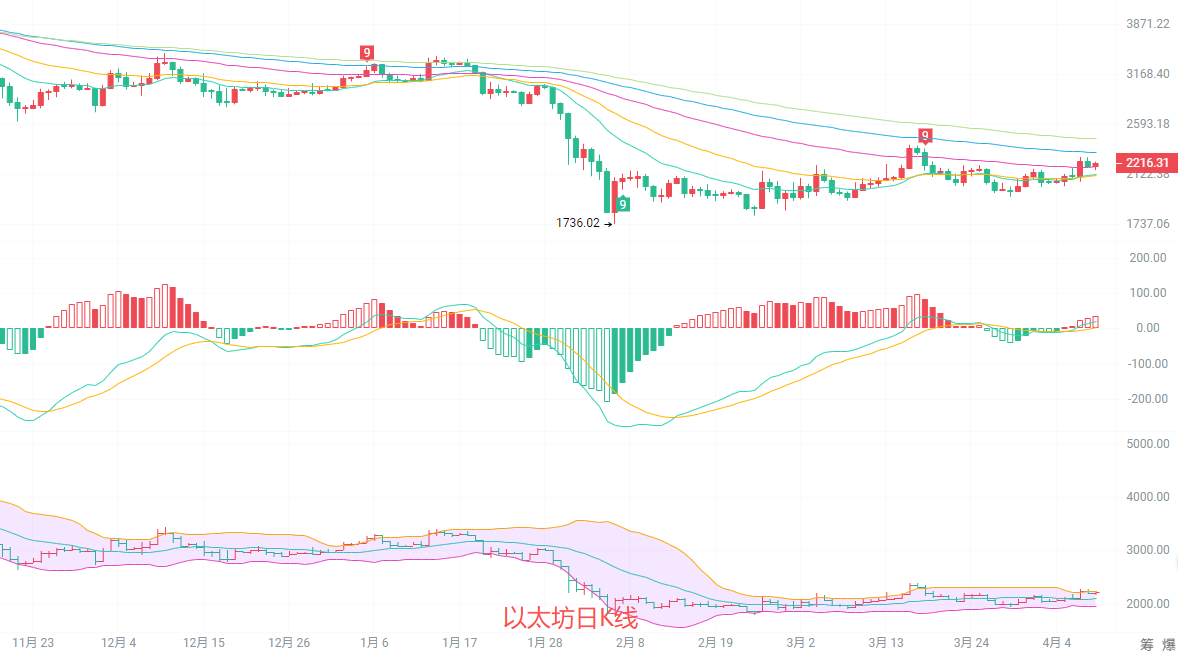
From the daily candlestick analysis, the highest during the session was 2230 and the lowest was 2156, continuing a strong rebound upward trend. The EMA moving average system has turned upward, with EMA15, EMA30, and EMA60 forming southern support. Prices have successfully stabilized above all periodic moving averages, breaking away from the weak area below the Bollinger Bands. In the MACD indicator, after the DIF and DEA golden cross, the red bars continue to expand, southern momentum has completely weakened, and there are strong signals for a northern counterattack. The upper Bollinger Band at 2239 serves as short-term resistance, while the lower band at 1953 is strong support. If the upper band is broken, it will open upward space above 2300.
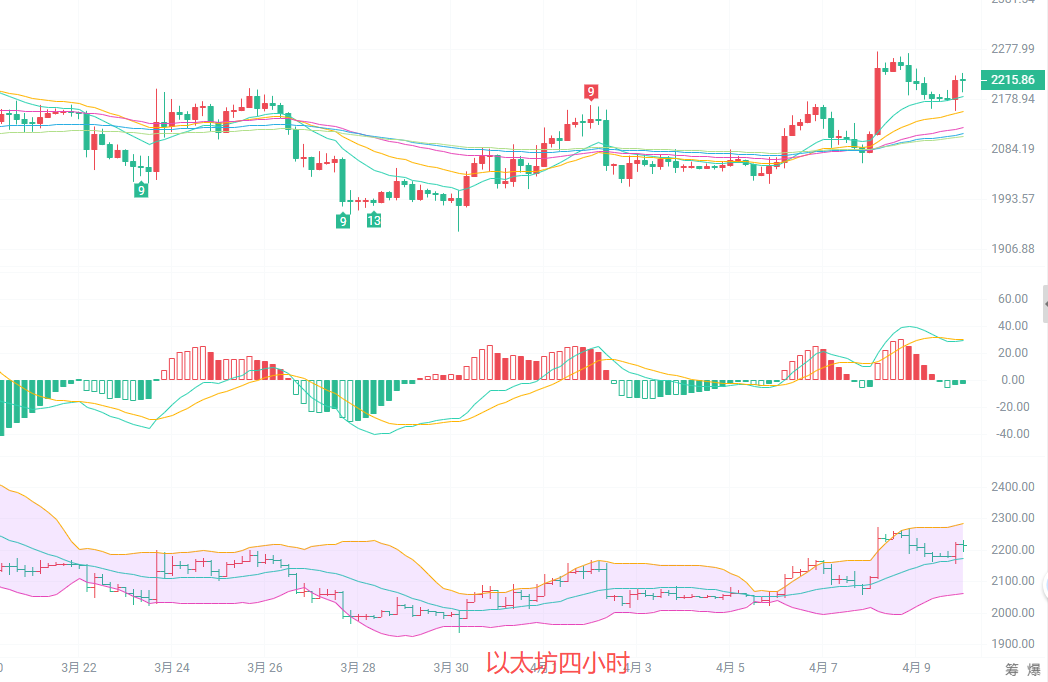
At the four-hour level, the price is oscillating upward around 2200 with continuous bullish candlesticks, successfully breaking the previous strong resistance at 2200. It has stabilized above EMA15, EMA30, and EMA60. Short-term moving averages are aligned northward, with significant support effect generating upward divergence. Prices are operating along the upper Bollinger Band, and the ascending channel is fully opened. In the MACD indicator, after the golden cross of DIF and DEA, the red bars continue to expand, showing sufficient northern momentum with a clear rebound trend. The upper Bollinger Band at 2283 is resistance, while the lower band at 2062 is strong support. A pullback to the middle band at 2170 is an excellent opportunity to go long.
Short-term reference: (The trading data has been updated; please consult the author for details)
From 2180 to 2190, go north with a stop loss at 2150, aiming for 2250 to 2300; if it breaks, then aim for 2350.
From 2300 to 2320, go south with a stop loss at 2350, aiming for 2250 to 2230.
Specific operations should be based on real-time market data. For more information, please consult the author. The publication of the article may have delays, suggestions are for reference only, and risks are borne by the reader.

Warm reminder: The content above is solely created by the author on the public account. Any advertisements at the end of the article and in the comment section are unrelated to the author. Please discern carefully, thank you for reading.
免责声明:本文章仅代表作者个人观点,不代表本平台的立场和观点。本文章仅供信息分享,不构成对任何人的任何投资建议。用户与作者之间的任何争议,与本平台无关。如网页中刊载的文章或图片涉及侵权,请提供相关的权利证明和身份证明发送邮件到support@aicoin.com,本平台相关工作人员将会进行核查。