Cryptocurrency Academy: On April 10th, Ethereum fluctuates in the afternoon without confusion! Technical analysis of three cycles clearly defines long and short positions and trading rhythm.
Understanding the North-South game of Ethereum starts with cycle resonance! Currently, the second in line has a price of 2186. The 4-hour cycle shows strong fluctuations, the 2-hour cycle has adjusted appropriately, and the 15-minute cycle is ready to take off. The signals from these three cycles corroborate each other, forming a complete trading logic. Those focused solely on a single cycle either chase highs and get stuck or cut losses and follow to the south. Actually, as long as you grasp the boundary point between north and south and combine it with the three major indicators: MACD, BOLL, and moving averages, you can precisely grasp the rhythm of the market. This article does not play tricks, it dissects from large cycles to small ones one by one, giving clear North-South entry points. Whether you are a short-term trader or a swing player, you will be able to find your direction in operations after reading.
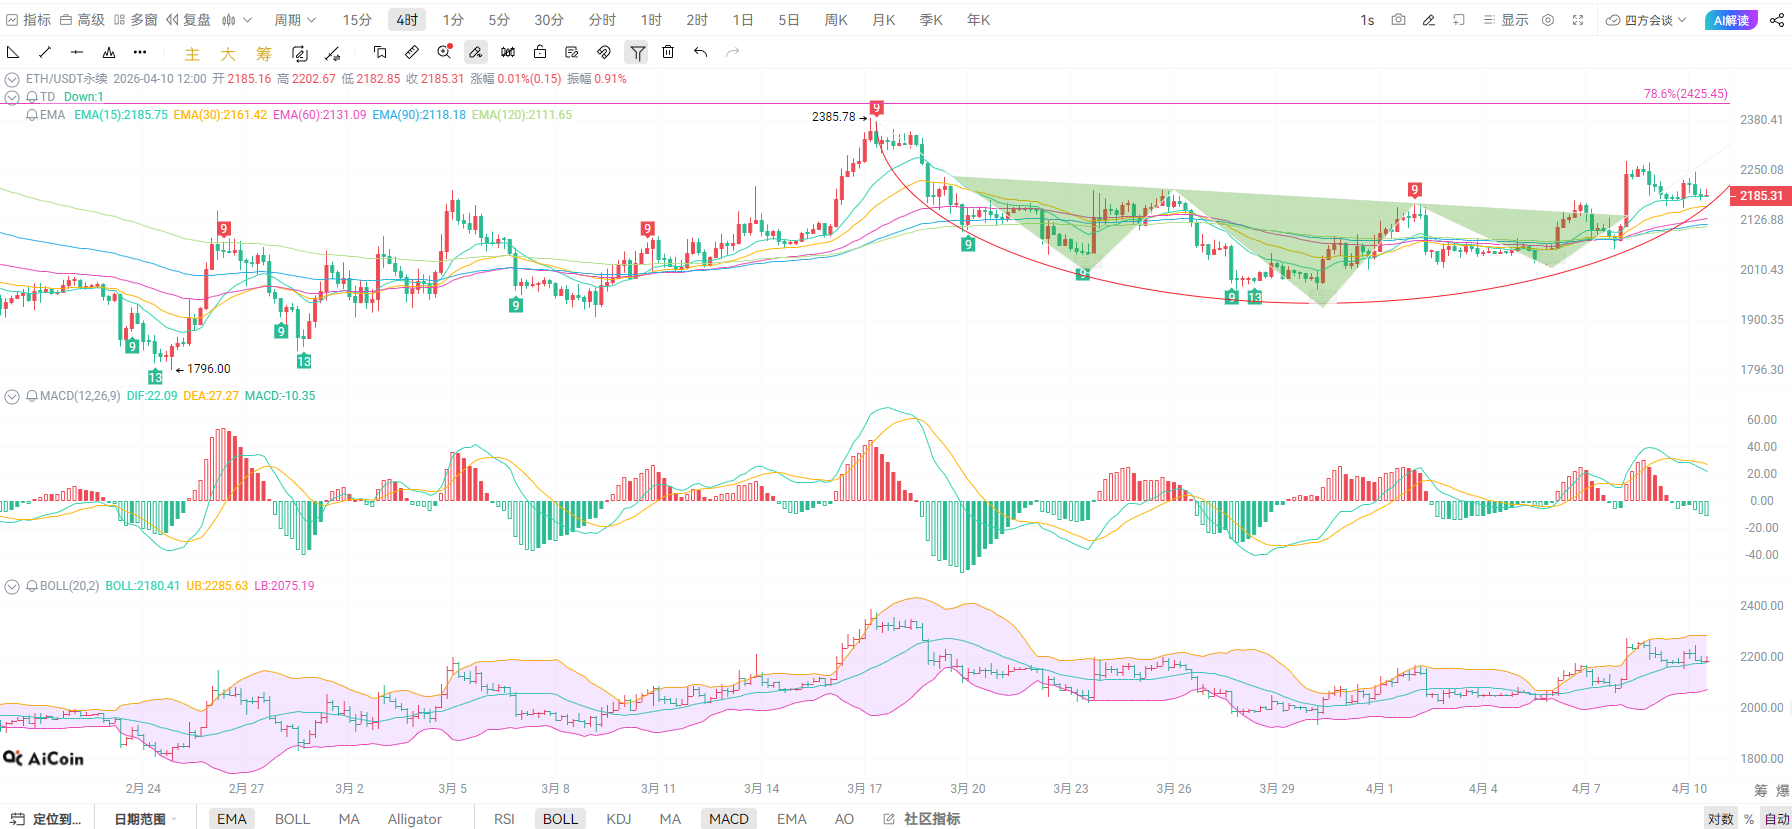
The core guidance of the 4-hour Ethereum trend indicates that the middle band of the Bollinger Bands at 2111 has become a long-term support, with the upper band at 2285 forming short-term pressure. The MACD indicator's DIF and DEA lines are above the zero axis, with a reduction in red bar momentum, indicating weakened upward momentum, yet no trend reversal signal has appeared. In the moving average system, EMA15, EMA30, and EMA60 are aligned upwards, showing clear long-term support. The current price is fluctuating around the middle track, which is a normal adjustment after the rise. As long as it does not break below the EMA15 support, the mid-term upward trend will not change. Later, pay attention to the breakout of the 2250 resistance level; if it breaks through, look to 2300, if it breaks down, look for a retest of the 2150 support.
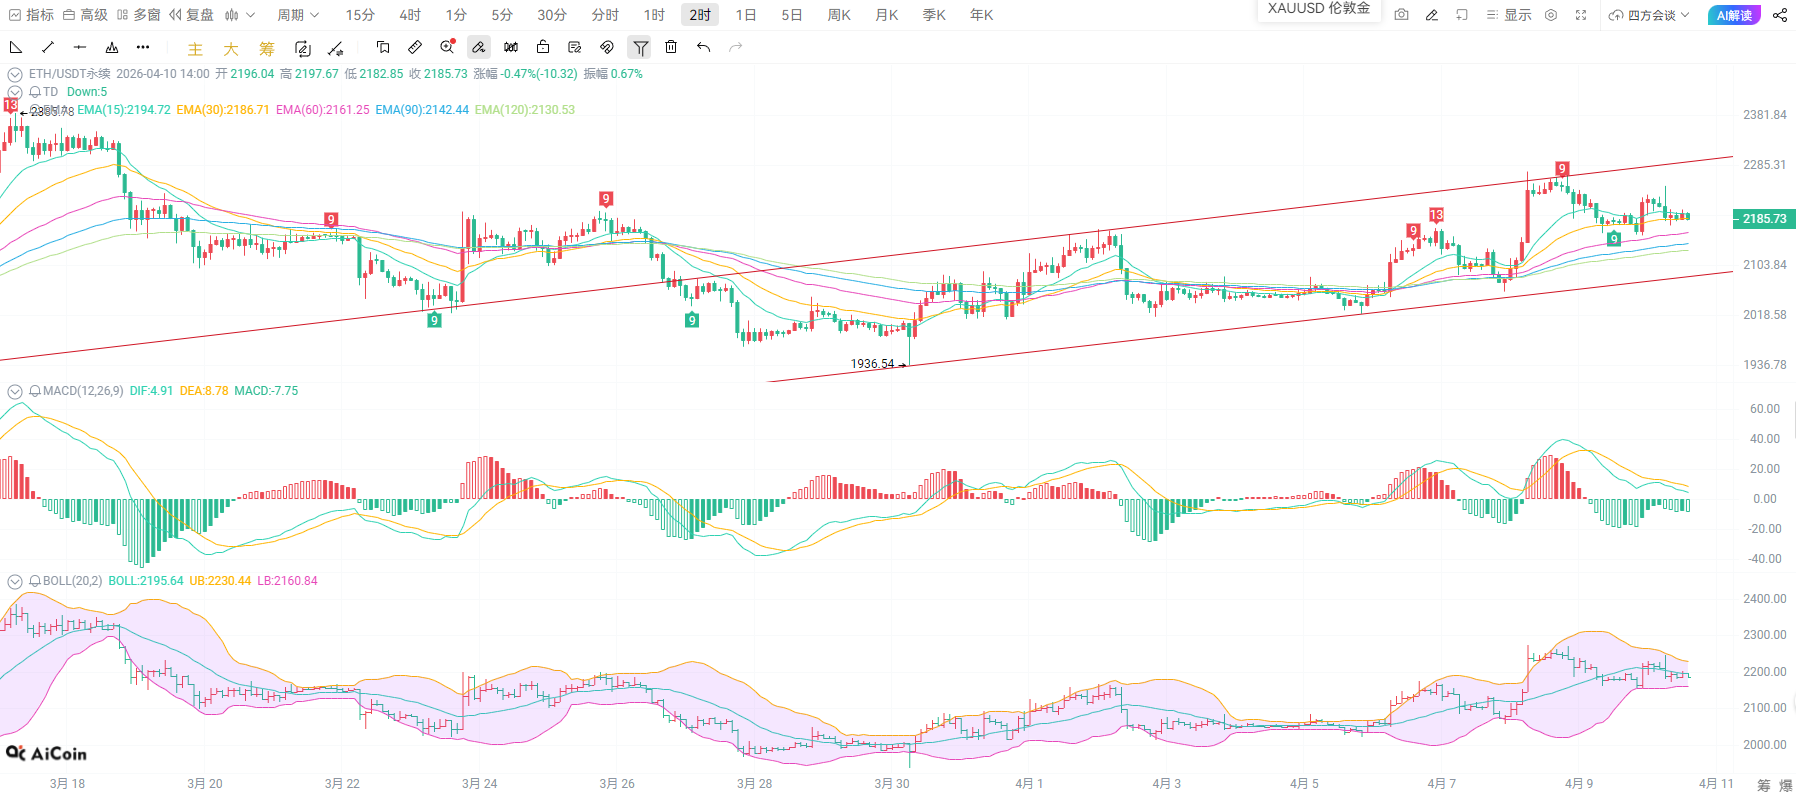
In the 2-hour cycle, the pullback has dropped from the high point of 2273 to 2186, with the middle band of the Bollinger Bands at 2161 becoming the critical boundary. The upper band at 2230 forms strong resistance, while the lower band at 2160 provides solid support. The MACD dual lines have crossed downwards from a high position and are beginning to reduce in volume, indicating that the downward momentum is about to diminish. In the moving average system, the short-term moving averages and price are closely integrated, and the forces of north and south are tending to balance. If the price rebounds above the middle track at 2186, it will initiate a new round of upward movement; if it breaks below the middle track, it will continue the pullback trend, targeting a drop to 2150.
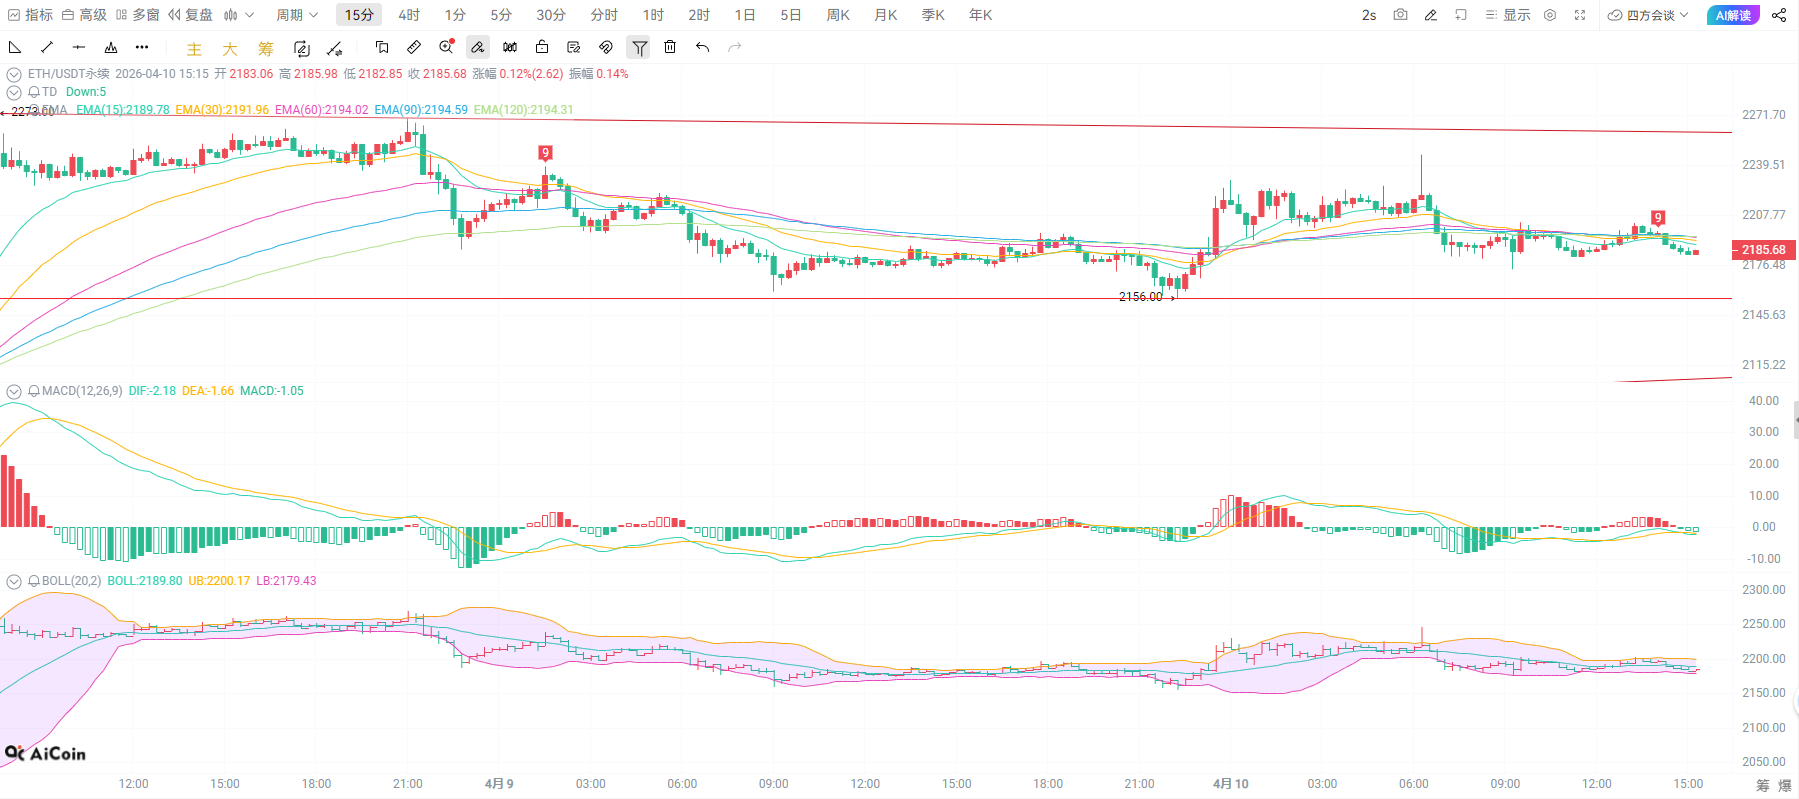
The 15-minute short cycle is a precise reference for short-term operations, with the middle band of the Bollinger Bands at 2190, the upper band at 2200, and the lower band at 2180 forming a narrow fluctuation range where both sides are in intense competition. The MACD dual lines have a golden cross upwards indicating a slight recovery in short-term northward movement, but with insufficient momentum. The moving averages exert short-term pressure on the price, and the candlestick pattern alternates between bullish and bearish, indicating no clear direction yet. This cycle is suitable for range trading, with a high sell-low buy range of 2180-2200. Follow the trend after breaking out of the range, and avoid frequent trading within the range.
Afternoon strategy reference:
Short-term entry: 2180-2185 northward, stop loss at 2165, target 2200-2210
Short-term entry: 2200-2205 southward, stop loss at 2215, target 2185-2180
Cycle resonance is the core of trading! Don't just stare at one cycle; the 4-hour sets the direction, the 2-hour determines the rhythm, and the 15-minute sets the points. Combining all three, your win rate will double. Additionally, ETH is linked to Bitcoin's trends; before the data is released tonight, try to trade with a light position and adjust your holdings based on the market after the data is established. Trading is not 100%, strict stop losses are the bottom line; don't let one mistake ruin all your arrangements. Maintain a steady mindset to profit long-term in the cryptocurrency circle!

Warm reminder: The above content is solely created by the author of the public account. Advertisements at the end of the article and in the comments section are unrelated to the author; please discern carefully. Thank you for reading.
免责声明:本文章仅代表作者个人观点,不代表本平台的立场和观点。本文章仅供信息分享,不构成对任何人的任何投资建议。用户与作者之间的任何争议,与本平台无关。如网页中刊载的文章或图片涉及侵权,请提供相关的权利证明和身份证明发送邮件到support@aicoin.com,本平台相关工作人员将会进行核查。