Crypto Circle Academician: On April 10, Bitcoin is poised to launch, the short cycle has completed its bottom formation, and aggressive low-buying strategies can aim for a quick rebound! Latest market analysis
The current price of Bitcoin is 71800, with a four-hour oscillation consolidation, a two-hour upward trend, and a fifteen-minute momentum build-up, the price is just at the bullish-bearish dividing point. Whether aiming for a short-term breakout or capturing a wave reversal, now is a great entry opportunity! Stop worrying about whether it will rise or fall; the indicators won’t lie. The Bollinger Bands are narrowing, MACD is diverging, and moving averages provide support, with three major signals resonating together, I present precise bullish-bearish points directly. Follow the rhythm, today you will either reap the full rebound profits or accurately avoid the risk of a pullback.
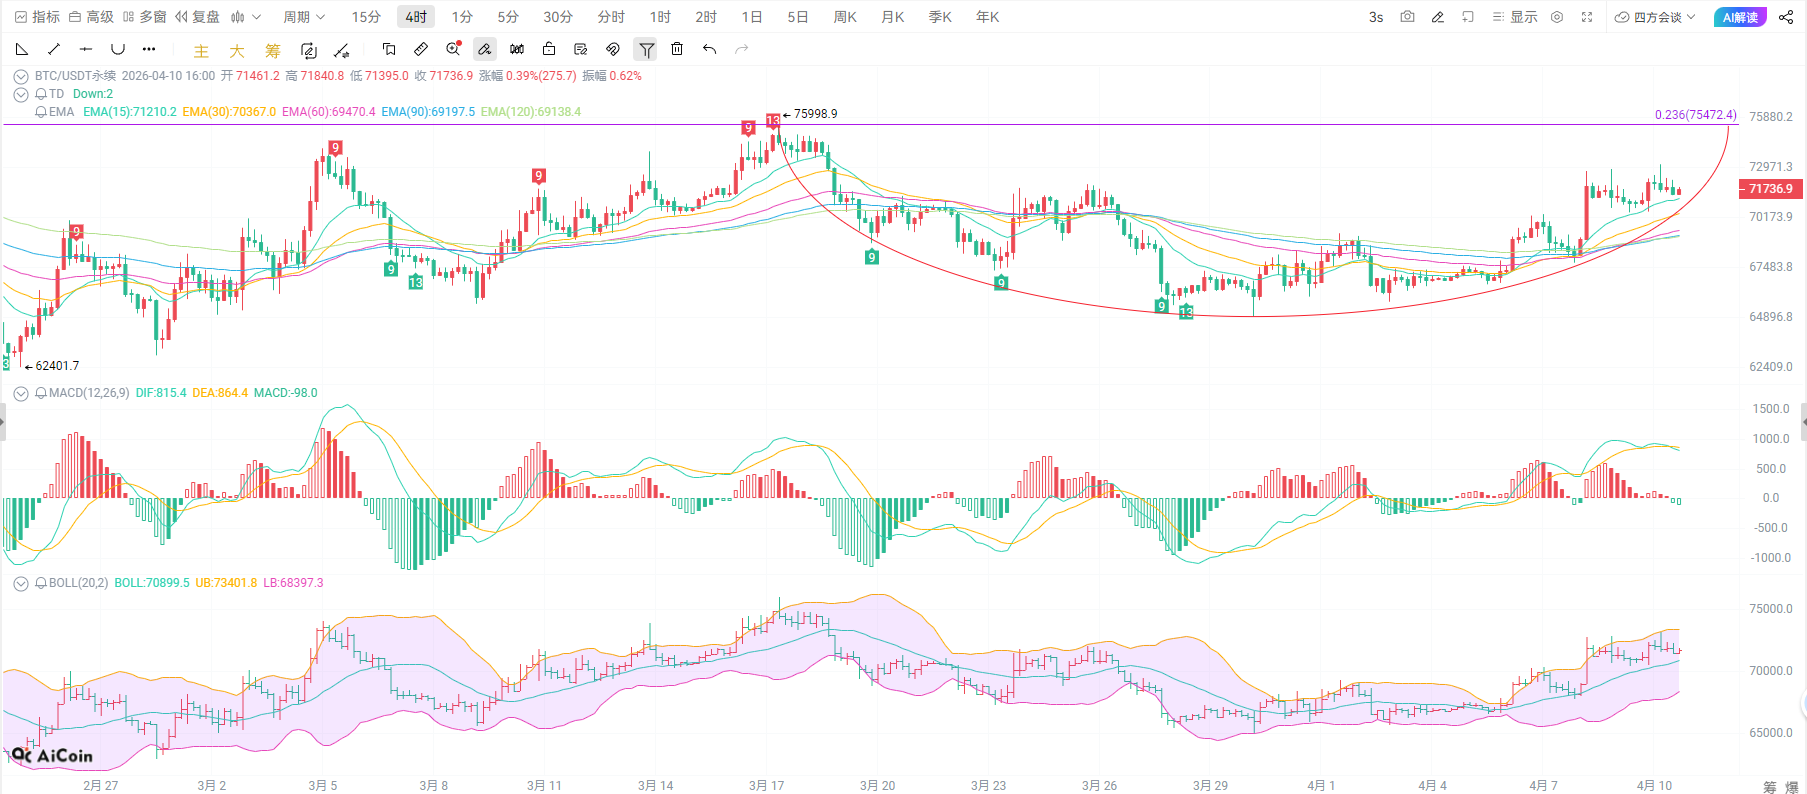
The four-hour cycle shows characteristics of oscillation and consolidation, with prices repeatedly oscillating between the 71000-73000 range. The expansion of the narrowing Bollinger Bands indicates an upcoming trend breakthrough. The MACD indicator’s red bars are shrinking but have not formed a death cross; the DIF and DEA dual lines are flattening at a high level, indicating that the upward momentum has not given up but is just building strength. The moving average system forms strong support, with the price repeatedly testing it without breaking down, indicating clear upward absorption. The current price is above the middle band, within a strong oscillation range. As long as the support at 71000 is not broken, the bullish trend will not reverse, and a subsequent breakthrough of the 73000 resistance level will likely start a unilateral rise, targeting the 75000 mark.
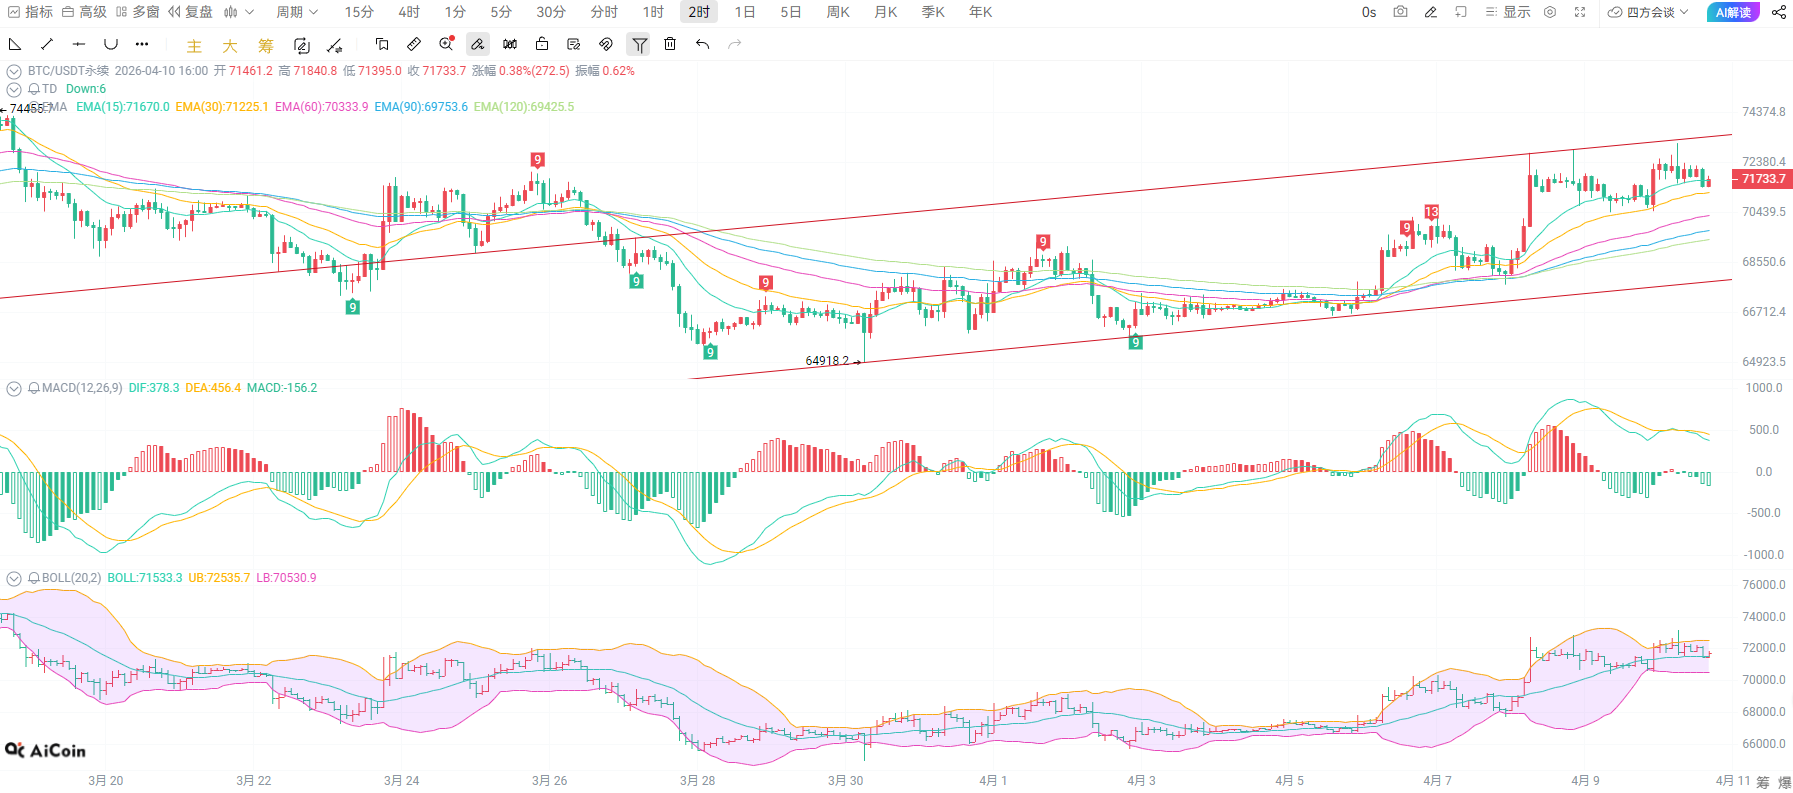
In the two-hour timeframe, it is in the pullback phase of a bullish trend, currently stabilizing around 71730. The middle band of the Bollinger Bands at 71533 serves as a key support level, with the lower band at 70530 offering very strong support. The MACD indicator shows a distinct decrease in the green bar’s momentum, and the DIF and DEA dual lines show an upward turning trend, with downward momentum about to exhaust. In the moving average system, the short-term EMA15 is trending upwards, while the long-term EMA120 has solid support, forming a pattern of support below and resistance above. The current price is just a step away from the middle band, representing a great opportunity for a rebound after an overshoot. If it can break through the 72000 resistance, it will quickly open up room for a rise, and aggressive traders may set up long positions in advance, betting on a rebound market.
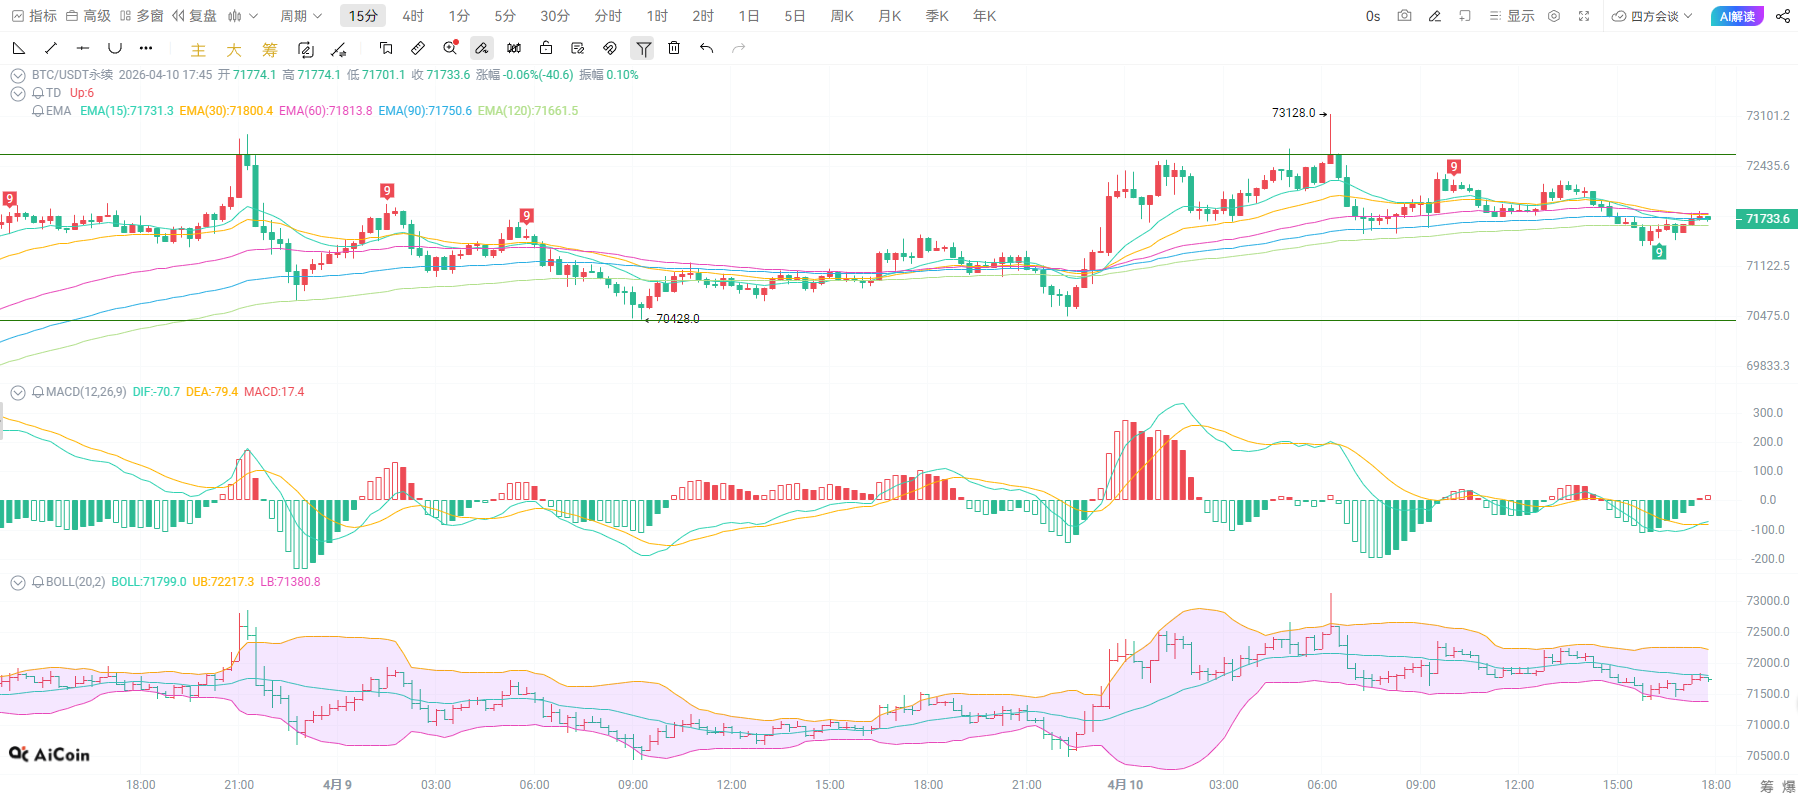
The fifteen-minute short cycle is the core of short-term trading strategies, with the Bollinger Bands showing signs of narrowing and then opening upwards, and the red bar momentum increasing moderately, with a short-term upward push beginning. The MACD dual lines golden cross indicates gradually strengthening bullish momentum. The EMA15 has started to turn upwards, and the candlesticks continue to form small upward bars, signaling a clear bottom formation. This cycle is currently at the eve of a launch; the 71400-71500 range is an excellent low-absorption position. As long as it stabilizes at 71800, it can follow the bullish trend to aim higher, with a short-term target of 72200. If broken, then it can look towards 72500. Do not miss this short-term opportunity.
For upward movement in the 71500-71000 range, stop loss at 70600, target 72500-73000
For downward movement in the 72500-72800 range, stop loss at 73000, target 71800-71500

Friendly Reminder: The above content is exclusively created by the author for the public account. The advertisements at the end of the article and in the comment section are not related to the author. Please exercise caution in distinguishing them. Thank you for reading.
免责声明:本文章仅代表作者个人观点,不代表本平台的立场和观点。本文章仅供信息分享,不构成对任何人的任何投资建议。用户与作者之间的任何争议,与本平台无关。如网页中刊载的文章或图片涉及侵权,请提供相关的权利证明和身份证明发送邮件到support@aicoin.com,本平台相关工作人员将会进行核查。