In the past 12 hours, global risk asset traders have been focused on three things: on April 9, US stocks closed higher amidst optimistic sentiments expecting a lasting ceasefire, but Iran immediately denied the ceasefire in the after-hours trading, causing oil prices to rebound. On April 10, at 8:30 AM Eastern Time, the US will announce March CP. Additionally, the implied volatility of the crypto market is quietly dropping to its lowest level since January.
Bitcoin four-hour chart
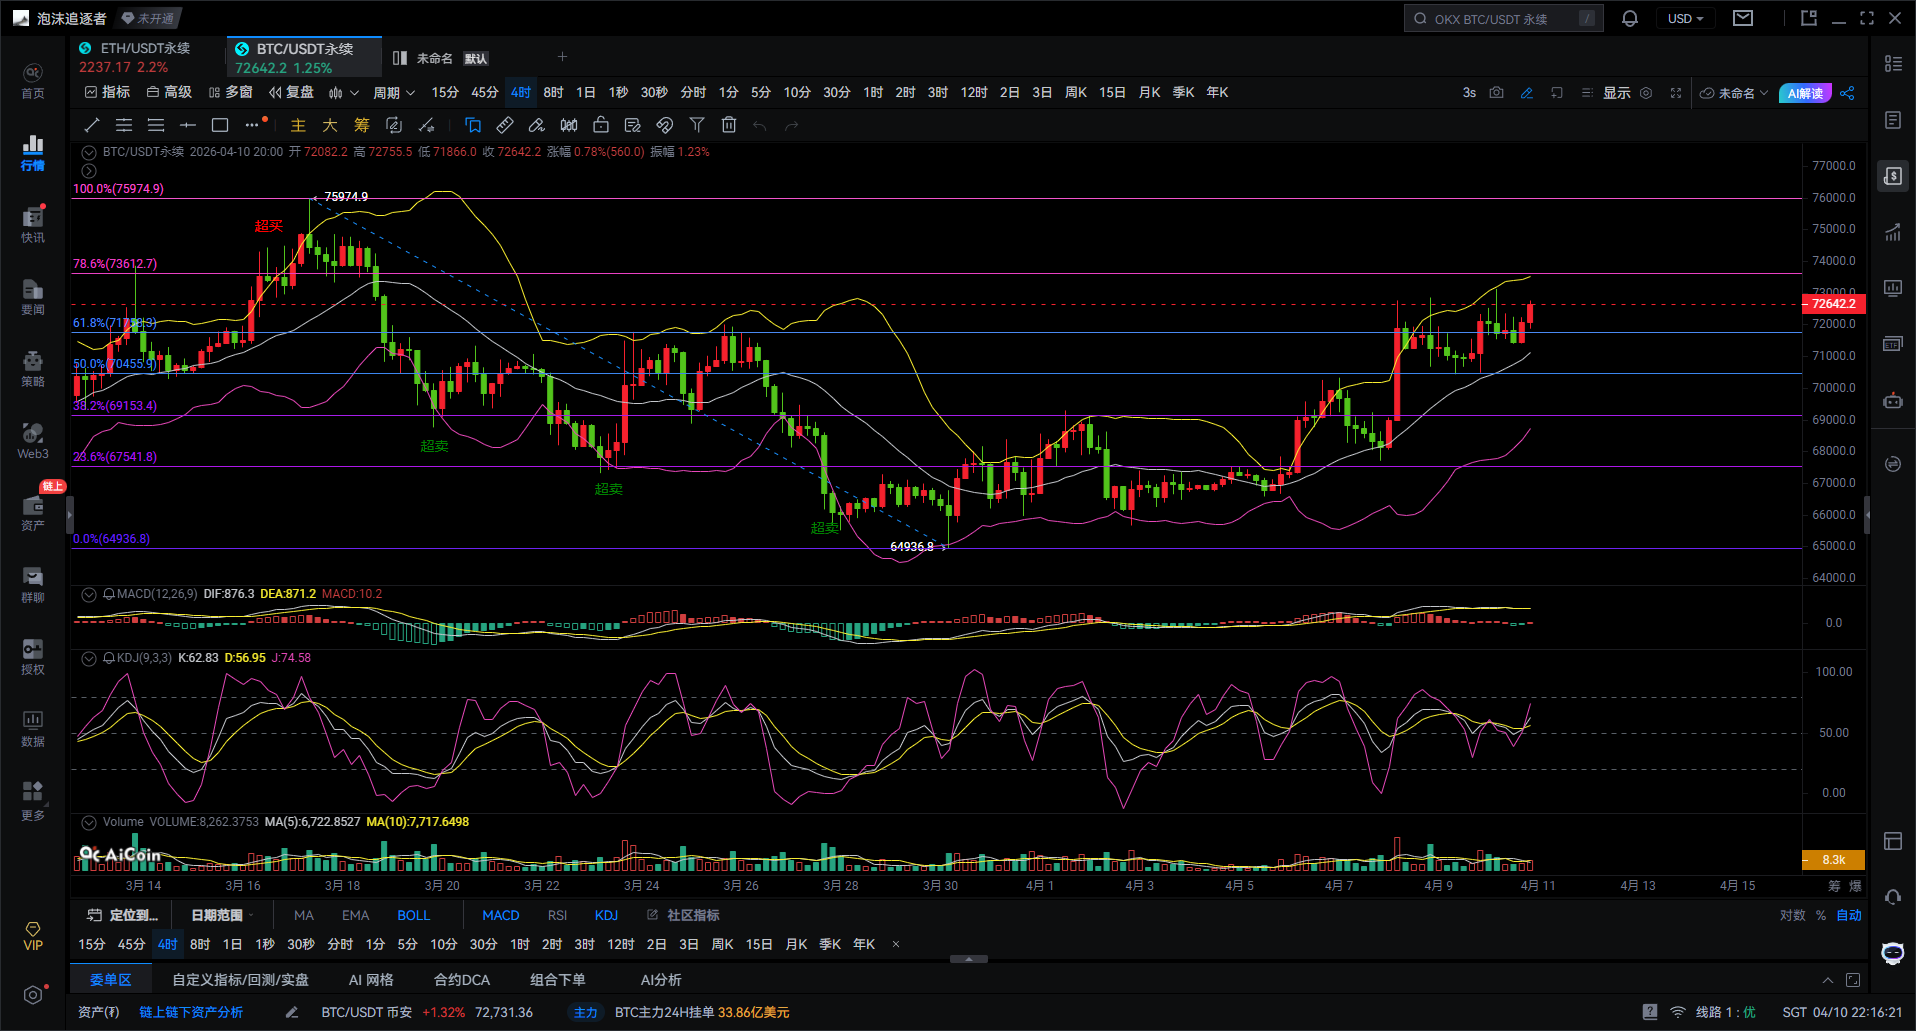
The expert will first give the conclusion: the current price has entered a "pressure zone for game playing." Although the bullish force is strong, a pullback may occur at any time. In summary: the trend is slightly bullish, but this is "the position where divergences should arise."
First, look at Fibonacci and structure. Key points to observe: the current price is around 72600, with resistance above at 73600 (corresponding to the Fibonacci 0.786 position) and support below at 71700 (corresponding to the 0.618 position). The current location is above the 0.618 support and is rallying toward the 0.786 resistance. The expert's judgment is: if it can stabilize above 73000, there is a chance to attack 73600, and further look towards 75000; if it cannot rise, it will retest the support at 71700.
Next, look at the Bollinger Bands indicator. The K-line is running close to the upper band, and the upper band is continuously opening upward. This indicates that the current upward trend is real and not a false breakout. However, it should be noted that being close to the upper band means strength, but it does not equate to a safe buying point here.
Next, analyze the MACD indicator. The MACD red histogram is still present but has clearly shortened, while the DIF and DEA lines are flattening at high levels. This translates to: the bullish force still exists, but it has begun to show signs of fatigue, and there are indications of weakening momentum ahead.
Then, look at the KDJ indicator. It has turned upward again in the mid-high area, forming neither a death cross nor an explosive upward move. This reflects a state of oscillation biased towards the bullish side, rather than a starting point for a major upward wave.
The most critical point to understand is: at this position, it is neither a bottom nor a trend starting point, but rather an area for price consolidation and gameplay after a spike.
The expert's trading strategy directly provides you with two usable options. The priority of the short strategy is relatively higher. The triggering condition is: when the price aggressively approaches the 73000-73600 zone, if a long upper shadow, a bearish engulfing candle, or a series of unsuccessful upward attacks appears. Meanwhile, the MACD red histogram continues to shorten, and KDJ forms a death cross at a high level. If all these conditions are met, you can consider shorting. Set the stop loss above 73800, with the target looking towards 71700-70500.
The long strategy must wait for a pullback. The triggering condition is: the price pulls back to the support level of 71700-70500, and after a spike downward, it stops falling, with a bullish line engulfing the previous bearish line or showing signs of increased volume. Only when these conditions are met should you consider going long.
So, can actions be taken now? The expert speaks frankly: it is currently unsuitable to chase long positions or to directly short. The correct action is: closely monitor the market and wait for a confirmed “signal K-line” to appear before taking action.
The expert's subjective judgment is: it is more likely that the price will first spike up towards 73000 and then show a pullback. The reason is that there is clear resistance above, while various technical indicators are beginning to show signs of dullness.
Finally, I want to say something very important: your current wins or losses do not depend on the judgment of the direction but on whether you patiently wait and execute clear trading signals.
Ethereum four-hour chart
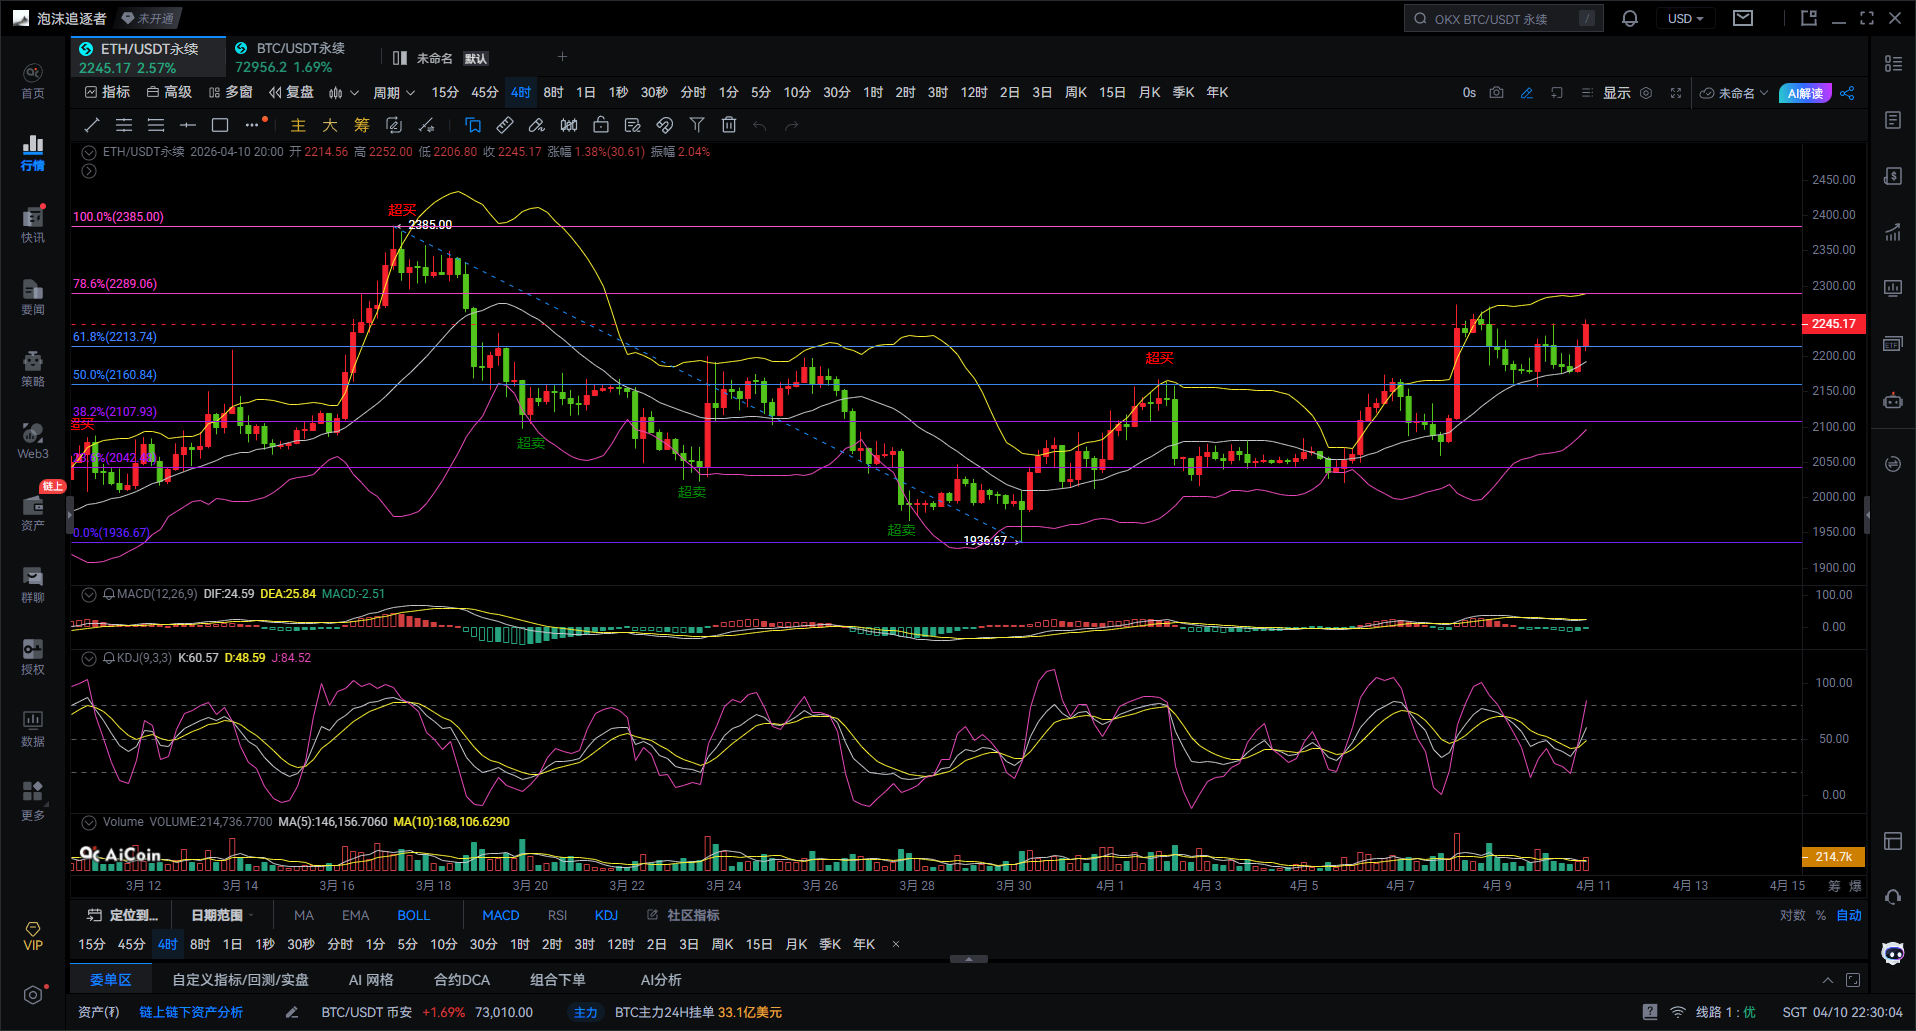
The core consists of three points: structure, sentiment, position.
The expert gives a conclusion first. At this position, it is a rebound continuation, overall slightly bullish, but it is already close to resistance; this is not a position for chasing.
First, look at the Fibonacci structure. Key points are clarified: the current price is around 2245. The upper pressure is at 2280-2300, which is the 0.786 position. The closest support below is at 2213, corresponding to 0.618. Strong support is at 2160, which is the 0.5 position. The current price is above 0.618, pushing toward the 0.786 resistance. The expert's judgment is: if it can break through 2300, a new upward segment will start; if it cannot rise, it has to pull back to find support at 2210 or even 2160.
Next, look at the Bollinger Bands. The current price is touching the upper band, and the upper band has begun to rise. What does this represent? It means that the current trend is a healthy increase. But the emphasis is: being close to the upper band only signifies strength, which is not a buy-in signal; on the contrary, it indicates that it may be slightly overheated in the short term.
Look at the MACD. The MACD red histogram is still there but has obviously shortened. The dual lines are flattening at high levels. Putting it in simple terms: the rise can still continue, but the momentum has begun to "dwindle," indicating insufficient follow-through.
Then, there’s the KDJ. The indicator has turned upward again, but it is already operating in the mid-high region. This displays typical oscillation upward characteristics rather than a strong initiation signal.
Now let’s talk about the core contradiction, which is the focus. At this position, the trend is bullish, but the position is already relatively high. This leads to two likely scenarios: either it breaks through the resistance level in one go, or it first washes down the price, clearing out the uncertain positions, and then attacks again.
Based on the above, the expert provides practical trading strategies for reference.
First, discuss the short position strategy, which might take priority at the current stage. Keep a close eye on the 2280-2300 pressure range. If a long upper shadow, bearish engulfing candle, or multiple failed upward assaults occur within this range, while the MACD red histogram continues to shorten and KDJ forms a death cross at a high level, then consider shorting. Set the stop loss above 2310. The target can be set toward 2210-2160.
Next, discuss the long position strategy; remember, only trade pullbacks, do not chase highs. Patiently wait for the price to return to the key support levels of 2210 or 2160. When a spike down occurs, followed by a quick recovery, with a bullish candle covering the previous bearish candle, or clear signs of volume stabilization, then it’s time to consider going long.
So, can action be taken at this price point? Let me speak plainly: do not chase long positions, nor do I recommend jumping straight into shorts. The correct action is: wait for a “confirmation K-line,” let the market show its own direction, and then place your bets.
What is the expert's subjective inclination towards the outcome? I think it is more likely to spike upward first, testing pressure around 2280, and then retreat under pressure, showing a pullback, and finally deciding on the true direction.
Finally, I will leave you with an important message: it is not that the market's direction is difficult to judge; often, it's because you are too impatient to enter. Waiting for the wind to come is more important than chasing it.
Giving you a hundred percent accurate advice is not as good as providing you with a correct mindset and trend. Teaching someone to fish is better than giving them a fish; the advice earns you a moment, while the mindset teaches you to earn for a lifetime!

Writing time: (2026-04-10, 22:30)
(Written by - Expert Talks Coins) Disclaimer: Online publication has delays, and the above suggestions are for reference only. Investment carries risks, and market participation requires caution!
免责声明:本文章仅代表作者个人观点,不代表本平台的立场和观点。本文章仅供信息分享,不构成对任何人的任何投资建议。用户与作者之间的任何争议,与本平台无关。如网页中刊载的文章或图片涉及侵权,请提供相关的权利证明和身份证明发送邮件到support@aicoin.com,本平台相关工作人员将会进行核查。