Currently, the large coin is stuck around 71,000, neither going up nor down, which is quite irritating. Many friends must be wondering: Has it dropped to the bottom? Can it be bottom-fished? Or should they decisively stop losses? If you have these three dilemmas, drop a yes in the comments, and I'll explain these three key signals thoroughly. Understand one, and you can avoid a pitfall once; grasp all three, and you can see the script of many market trends in advance.
First Signal: Coinbase Premium Index
Let me ask everyone: Who do you think is currently dominating the market? Is it Asian funds or American funds? The answer is clear; the major funds for BTC are primarily from the U.S., and the same goes for Ethereum. The simplest and most intuitive indicator to judge the movement of American funds is Coinbase Premium. A friend happened to mention Trump, so I must pull out this chart to discuss it.

As the leading compliant exchange in the U.S., Coinbase has a very critical rule: when Coinbase price > Binance price, it signifies that American players are willing to pay a higher cost to buy BTC. To put it plainly, American buying is entering the market.

Currently, this premium has officially turned positive, and we need to specifically watch the price difference and the authentication data from CB exchange.


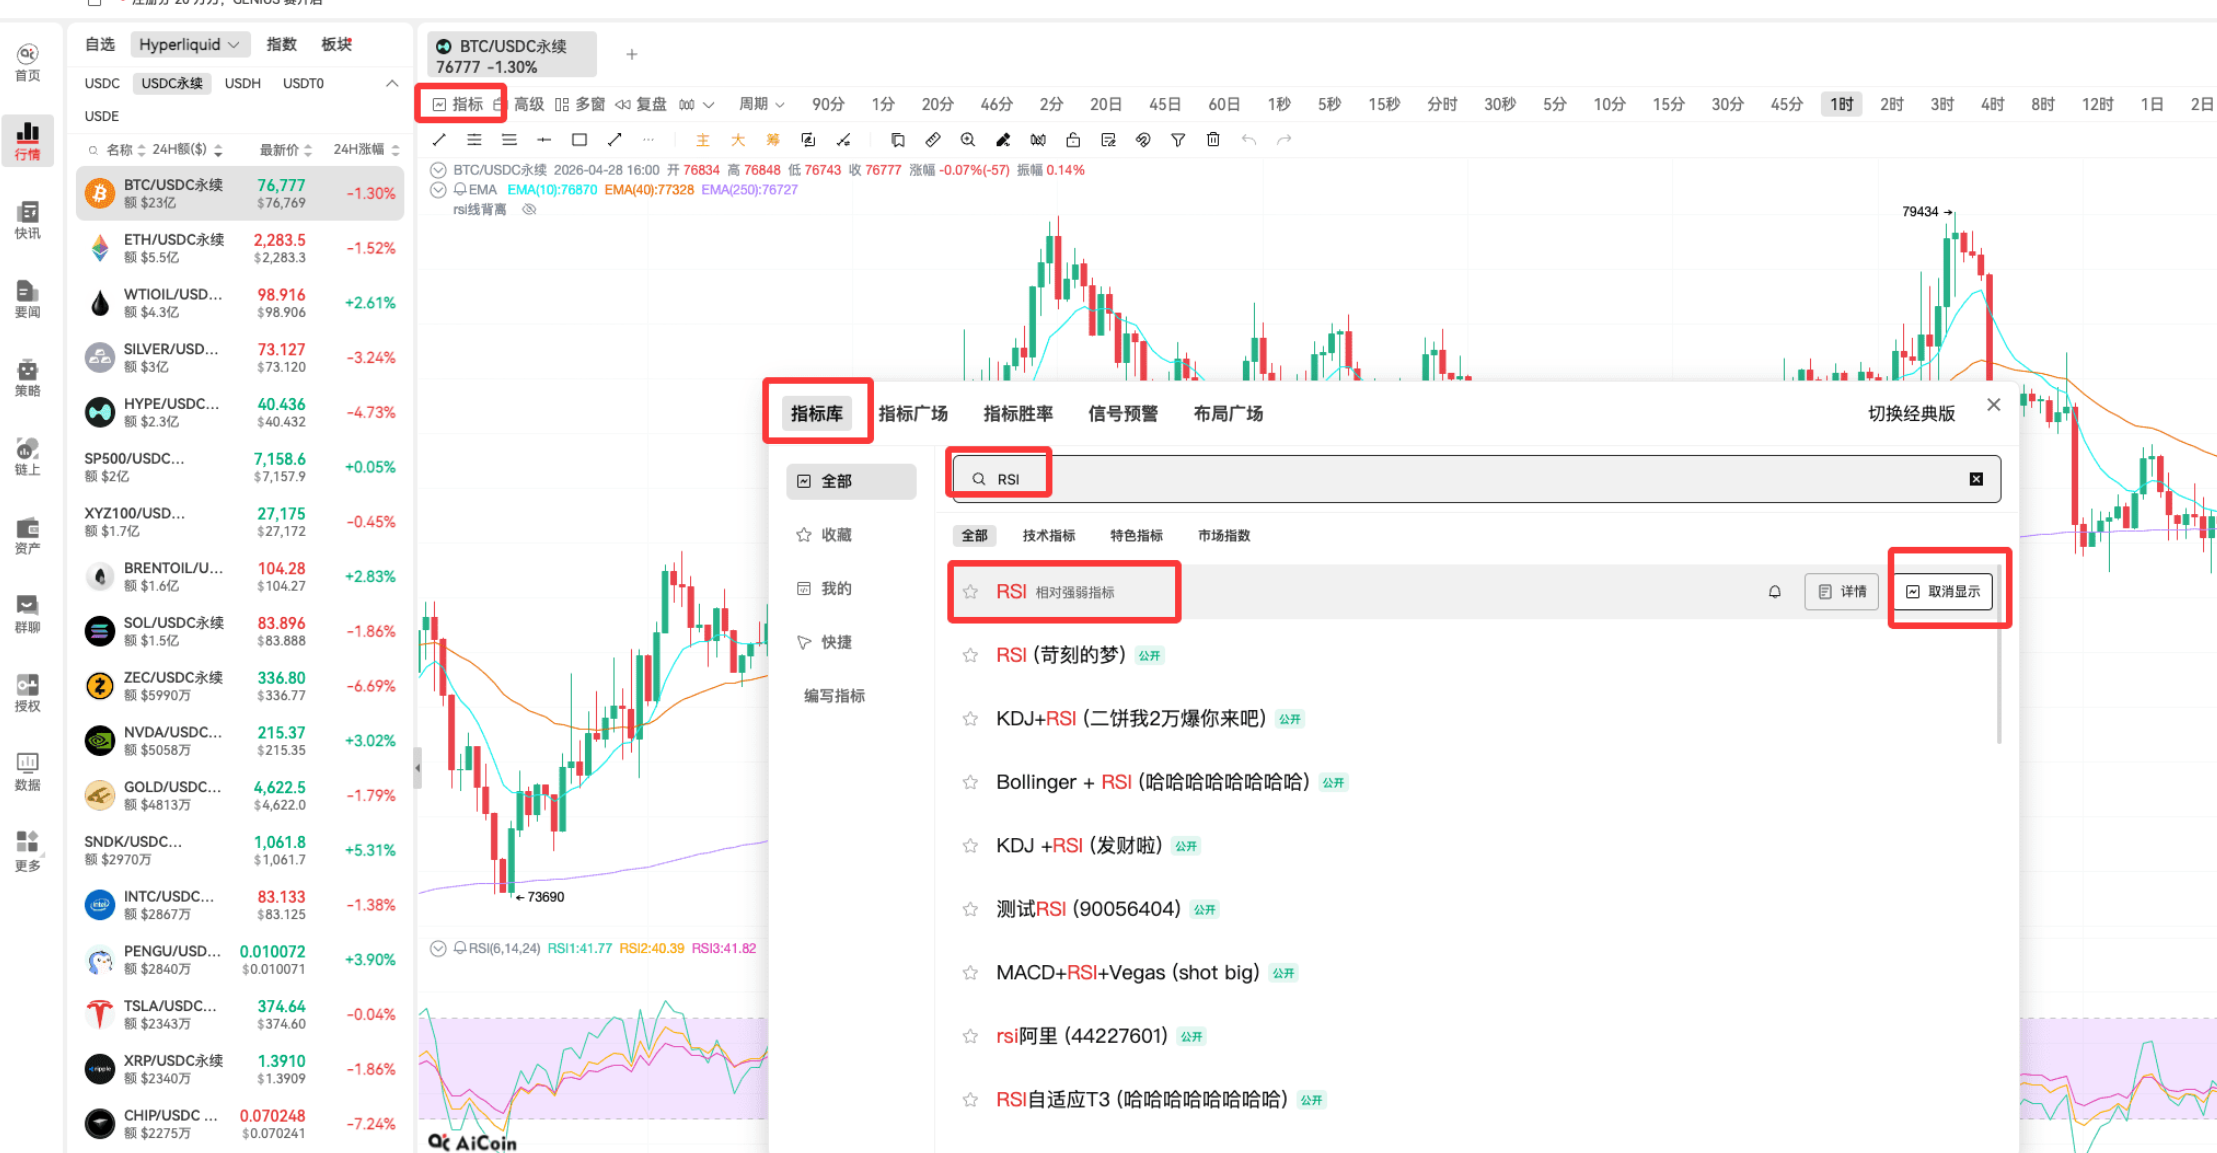
This premium index can also be viewed directly on the corresponding index page. It's not just that the premium has turned positive; there have also been dense main force transactions on Coinbase, and even Coinbase's ETH has rarely seen large concentrated transactions. The combination of these two signals is sufficient to show that the on-site funds are genuinely entering the layout with real money. If you want to see the main force transactions, use the PRO function; just enable the "Large Transactions" indicator in the indicator library to visually see that the current funds have started to speculate in advance; unless a black swan event occurs, it's hard for the trend to easily reverse.


Second Signal: Liquidation Heat Map

This indicator is simply to help you see in the market, which position has the most leveraged funds piled up. It is a completely free indicator that can be used by checking it directly in the indicator library.

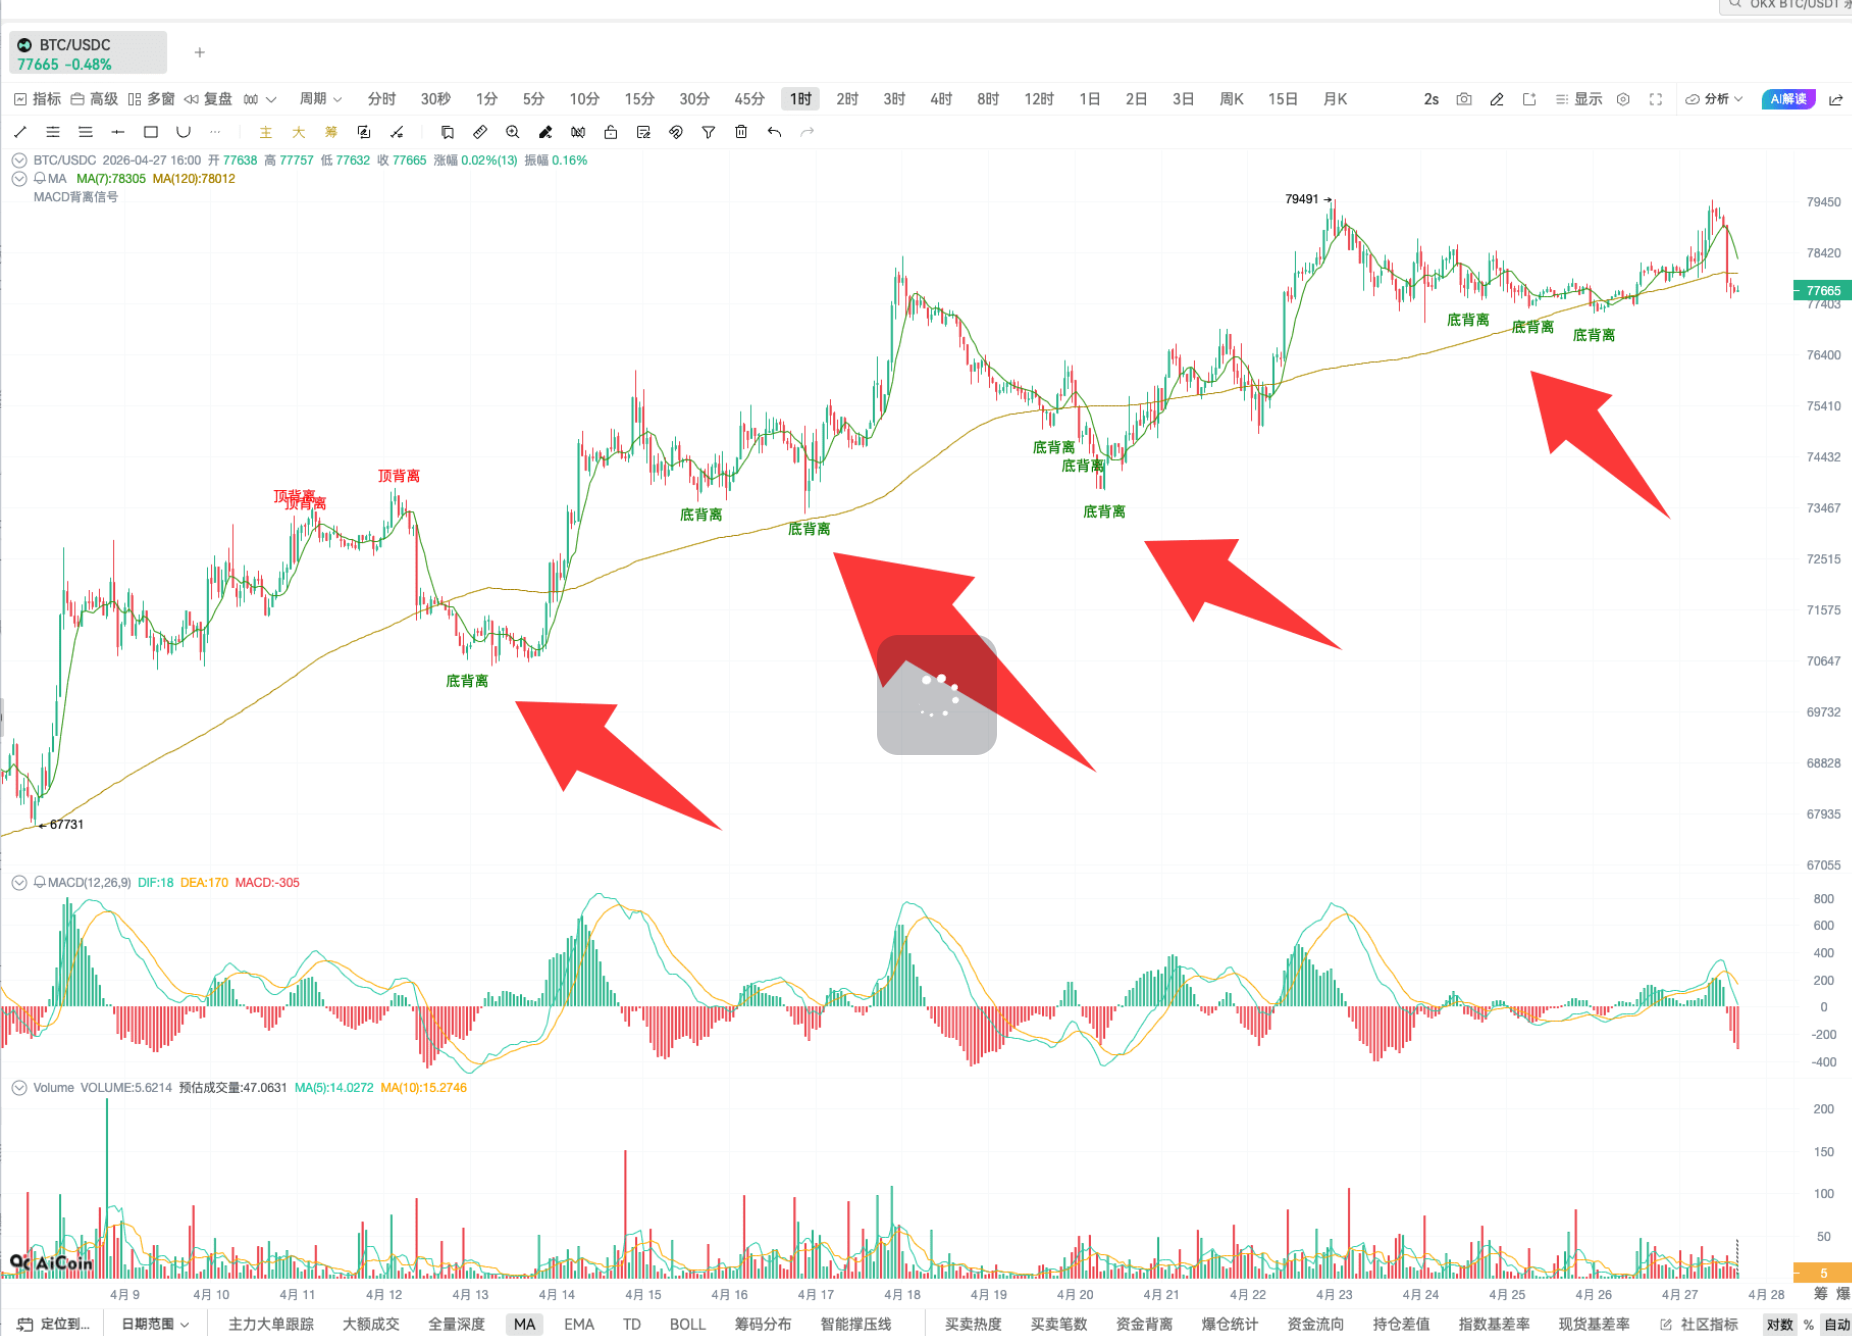
To understand the liquidation heat map, the core is to focus on the magnetic zone, which is the area with the darkest color. This position acts like a liquidity magnet in the market; once the price approaches, it can easily trigger a series of liquidations. Of course, this is just a reference estimate and needs to be combined with the third signal discussed next for comprehensive judgment, but it still holds high reference value. After all, the main force likes to slam the price into the densest liquidation area, which concentrates leveraged funds, sufficient liquidity, and plenty of cheap chips. The key is to see whether the liquidation zone overlaps with the main force’s order area. I usually pair it with the chip distribution chart to find support and resistance and to determine the range of volatility, which is particularly useful. If there is a situation where the lower part is a liquidation dense area, with the main force placing a large number of buy orders below, it indicates that the main force plans to acquire here, and vice versa.

Just like the tweet I sent on the 11th, the identified resistance zone accurately materialized, leading to a direct short squeeze that pushed the large coin all the way to 73.7K.
Third Signal: Main Force Orders & Order Wall

The main force order wall is a wall of "funds" formed by one or more main forces placing dense orders within a fixed range. This wall is of crucial significance, directly representing the main force's real target range. A giant buy order wall appearing below usually means the main force wants to acquire here, and the trend is likely to drop first and then rise; a giant sell order wall appearing above generally indicates that the main force is preparing to sell here, often resulting in the trend rising first and then falling.
Here I want to highlight the Binance ETH order wall; its reference win rate is particularly high. The range where the main force aggressively bets is usually where the price can be expected to move next. The core focuses on two points: the range where the main force is densely betting and which side has the larger order amount. The stronger side is the next target price. The order area and the liquidation magnetic area may not necessarily overlap, but once they do overlap, it becomes an extremely clear liquidity target. The lower liquidation zone + buy order wall = main force's acquisition area; upper liquidation zone + sell order wall = main force's unloading area. A few days ago when the large coin was dropping, I tweeted that the target was at 71.3K~71.1K, which was calculated through the liquidation magnetic zone + main force buy order position. However, it's important to note that the main force's orders are dynamic; for example, the previously mentioned buy orders were withdrawn by the main force that night and new ones placed at a lower position to acquire, so it’s essential to look at the order data in real-time.

Quickly summarizing today's key points: First, Coinbase premium focuses on whether U.S. funds are entering the market; second, the liquidation heat map identifies the market’s liquidation dense area; third, the main force order wall looks at where the main force is about to act.
In fact, free tools are sufficient; Coinbase premium + liquidation heat map can already help you capture quite a bit of key information. However, if you want to track main force orders, multi-platform fund movements, and overlapping signals of liquidation and orders more clearly, you can opt for our PRO features. It not only includes main force behavior analysis but also offers chip distribution, AI-written indicators, second-level cycles, combination K-lines, and many practical benefits.
Currently, the main force has placed a large order exceeding 40 million, but the duration is very short, raising strong suspicions of being a bait order. By the way, that big shot with a target of 1 billion currently has an empty position, with a position scale exceeding 200 million dollars. When the market rose over the weekend, a big V speculated whether his position would be liquidated, but from the transactions, there were only sell orders, not liquidated long positions. I responded to that big V at the time that he hadn't been liquidated at all. Later, this target guy also tweeted to confirm that the position still exists.

So, by using our large order tracking indicator, you can clearly trace the hanging orders and transaction movements of such big shots.
This article represents the author's personal views and does not reflect the stance or views of this platform. This article is for information sharing only and does not constitute any investment advice for anyone.
免责声明:本文章仅代表作者个人观点,不代表本平台的立场和观点。本文章仅供信息分享,不构成对任何人的任何投资建议。用户与作者之间的任何争议,与本平台无关。如网页中刊载的文章或图片涉及侵权,请提供相关的权利证明和身份证明发送邮件到support@aicoin.com,本平台相关工作人员将会进行核查。