Crypto Circle Academician: The short-term adjustment of Ethereum on April 15 does not change the mid-term bullish pattern, the daily level upward structure remains healthy! Latest market analysis and operational suggestions
The current price of Ethereum is 2335, and many crypto friends are struggling with whether to go now or stay? Many people always hesitate before the market starts, chase high after it starts, panic and cut losses during pullbacks, and in the end, they don’t make any money and their mindset collapses first. In fact, the crypto circle is not that complicated, there’s no need to listen to all kinds of gossip, and there’s no need to gamble on luck. By identifying trends and guarding key levels well, you can avoid most pitfalls. Today, I will break down the market of Ethereum clearly, and after reading, you will know how to respond, just copy the homework.
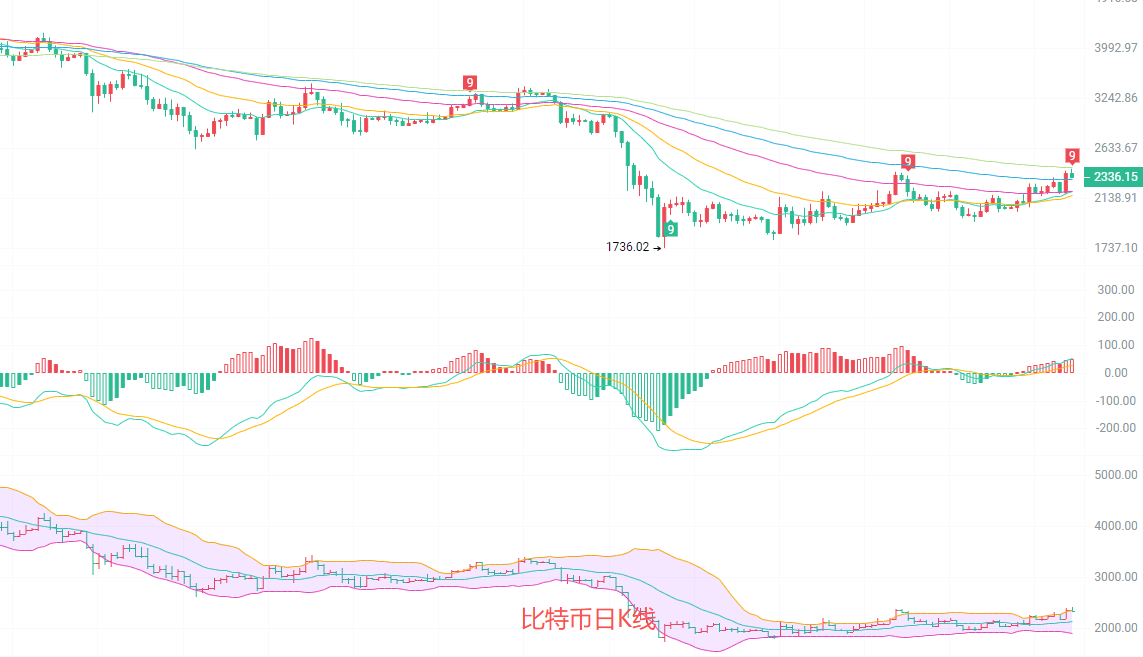
After the daily candle low point of 1736 rebounded, it successfully stood above multiple EMA moving averages, forming a clear bottoming-up pattern. The MACD red bars continue to enlarge, bullish momentum dominates, with DIF and DEA continuously rising above the zero axis, showing no signs of reversing; the Bollinger Bands have shifted from convergence to opening, with price approaching the upper Bollinger Band, indicating that the upward trend at the daily level is continuing. The key support below is near the middle track of the Bollinger Bands at 2160. If it doesn't break, the bullish trend is hard to reverse.
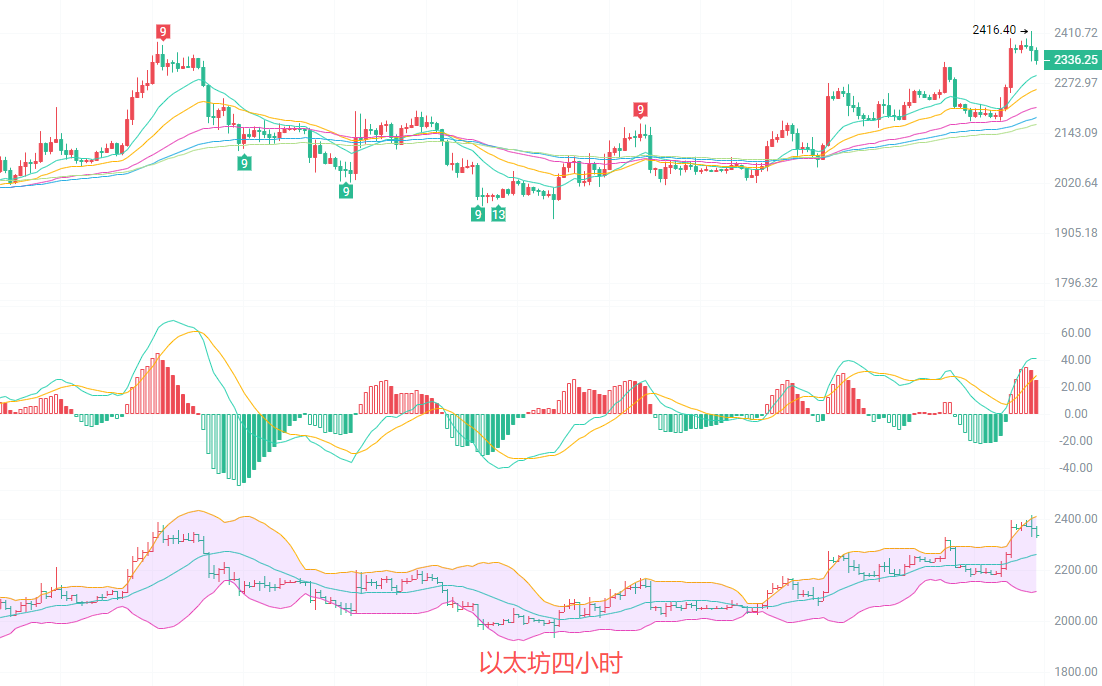
In the four-hour candlestick chart, you can see the moving average system maintains a bullish arrangement, with EMA15, EMA30, and EMA60 rising sequentially, and support layers rising. Although the MACD red bars have slightly decreased in volume, they remain above the zero axis. DIF and DEA have not formed a death cross, indicating that bullish momentum has not exhausted; the Bollinger Bands are opening upwards, with price running between the middle track and the upper track, with short-term pressure forming near the upper track at 2411 and support at the lower track at 2115, making the probability of the current trend continuing relatively high.
Short-term reference: (The operational data has been updated, please consult the author for details)
Buying in the range of 2290 to 2310 with a stop-loss at 2250, targeting 2365 to 2400, and if it breaks, look at 2440.
Selling in the range of 2380 to 2400 with a stop-loss at 2440, targeting 2320 to 2290, and if it breaks, look at 2260.
Specific operations depend on real-time market data. For more detailed information, you can consult the author. There may be a delay in article publication, so the suggestions are for reference only, and risks are self-borne.

Friendly reminder: The above content is only created by the author's public account, the advertisements at the end of the article and in the comment area are unrelated to the author, please discern carefully, thank you for reading.
免责声明:本文章仅代表作者个人观点,不代表本平台的立场和观点。本文章仅供信息分享,不构成对任何人的任何投资建议。用户与作者之间的任何争议,与本平台无关。如网页中刊载的文章或图片涉及侵权,请提供相关的权利证明和身份证明发送邮件到support@aicoin.com,本平台相关工作人员将会进行核查。