It is estimated that many veteran players can't contain their excitement upon seeing the title. Right now is a good buying point at a low position, with EMA support in place and MACD synchronously breaking through. Next, I will thoroughly explain this trading strategy; this is highly likely a great opportunity not to be missed recently!
Today, we will use EMA to lock in buying points and then use MACD for auxiliary judgment. There are indeed too many opportunities in the market. Let’s first take a look at a few core targets; this market dividend must be shared with you all.
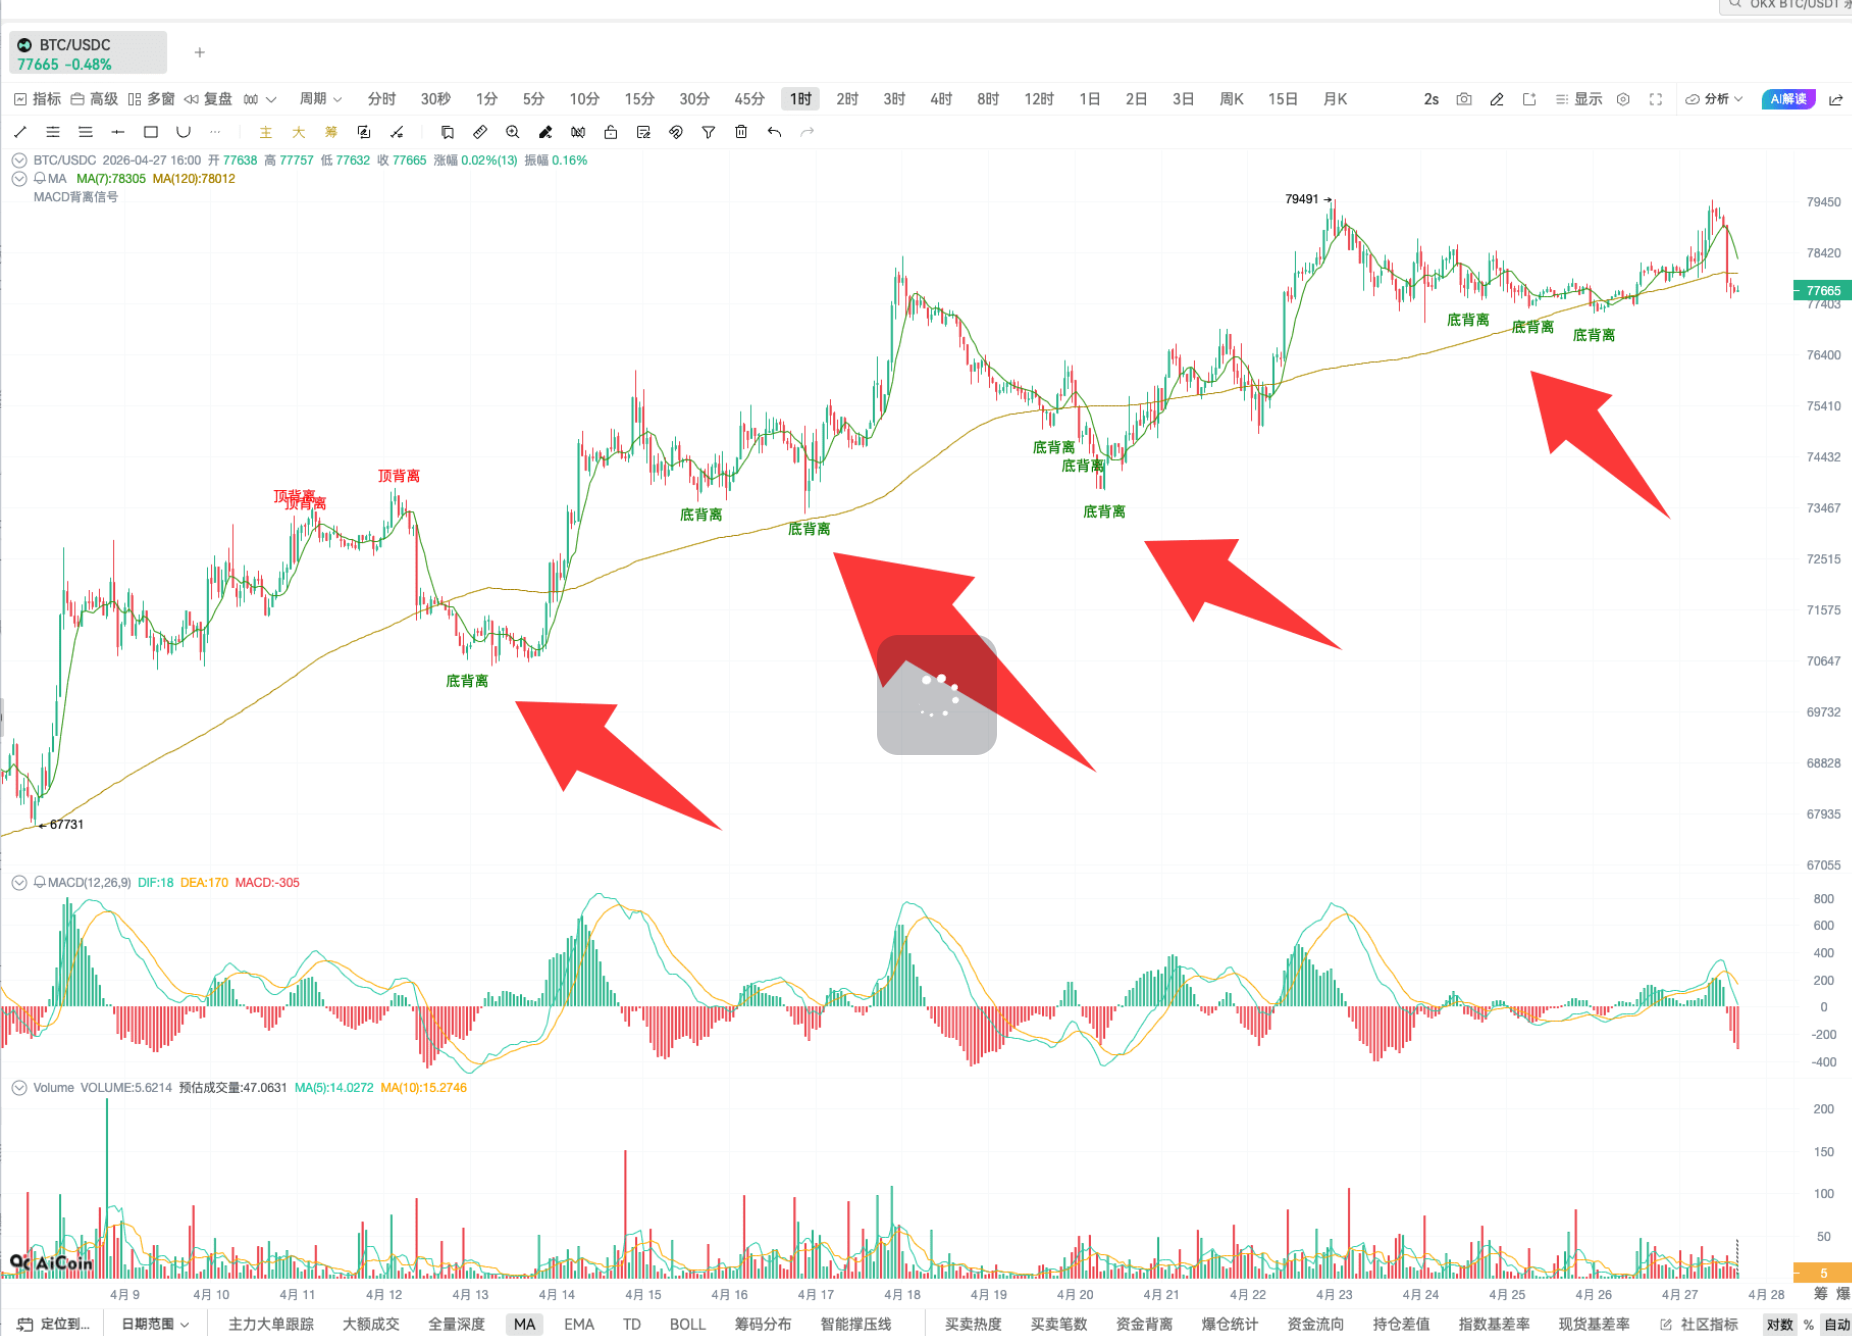
First, let’s look at BTC, which has formed a classic round bottom signal. From a technical perspective, this is an excellent entry opportunity, with moving averages synchronously forming a round bottom. Old players naturally understand the significance of this, and new friends, don’t rush; I will break it down in detail later.


But the good show doesn’t stop here; there is another high-quality coin that has also released an entry signal, which is HYPE. During this period, I have been following this coin's trend in my livestreams and analysis articles. It has risen from over twenty to over forty, and the upward trend hasn’t ended yet. I will analyze it in depth later; interested friends, don’t go away; let’s unlock methods to capture such market trends together.
By the way, for oil and similar commodities, let’s put them aside for now as the K-line trends are chaotic and the technical patterns are completely unclear. Moreover, with Trump-related policies being frequently changing, it's advisable to consider shorting in the short term, while going long should be approached with caution.

Seeing so many clear buying points, are you feeling excited? I certainly can’t contain myself when I see this kind of market, let’s officially enter the technical practical phase next.
First, let me ask everyone: Do you all understand the basic logic of EMA? Let me quickly summarize it for you: MA is the simple moving average, calculated by summing up values over a certain period and then taking the average; EMA is the exponential moving average, which places more weight on recent prices and weakens earlier data. Single-day prices are hard to reflect the true market sentiment, and moving averages can solve this problem. An upward MA indicates optimistic market sentiment, while a downward one leans towards pessimism.
In comparison, EMA responds more quickly to price reversals, while MA shows significant lag. For short-term traders, EMA is definitely the preferred tool. If you want to enter the market quickly and accurately at the bottom, you should rely on EMA.

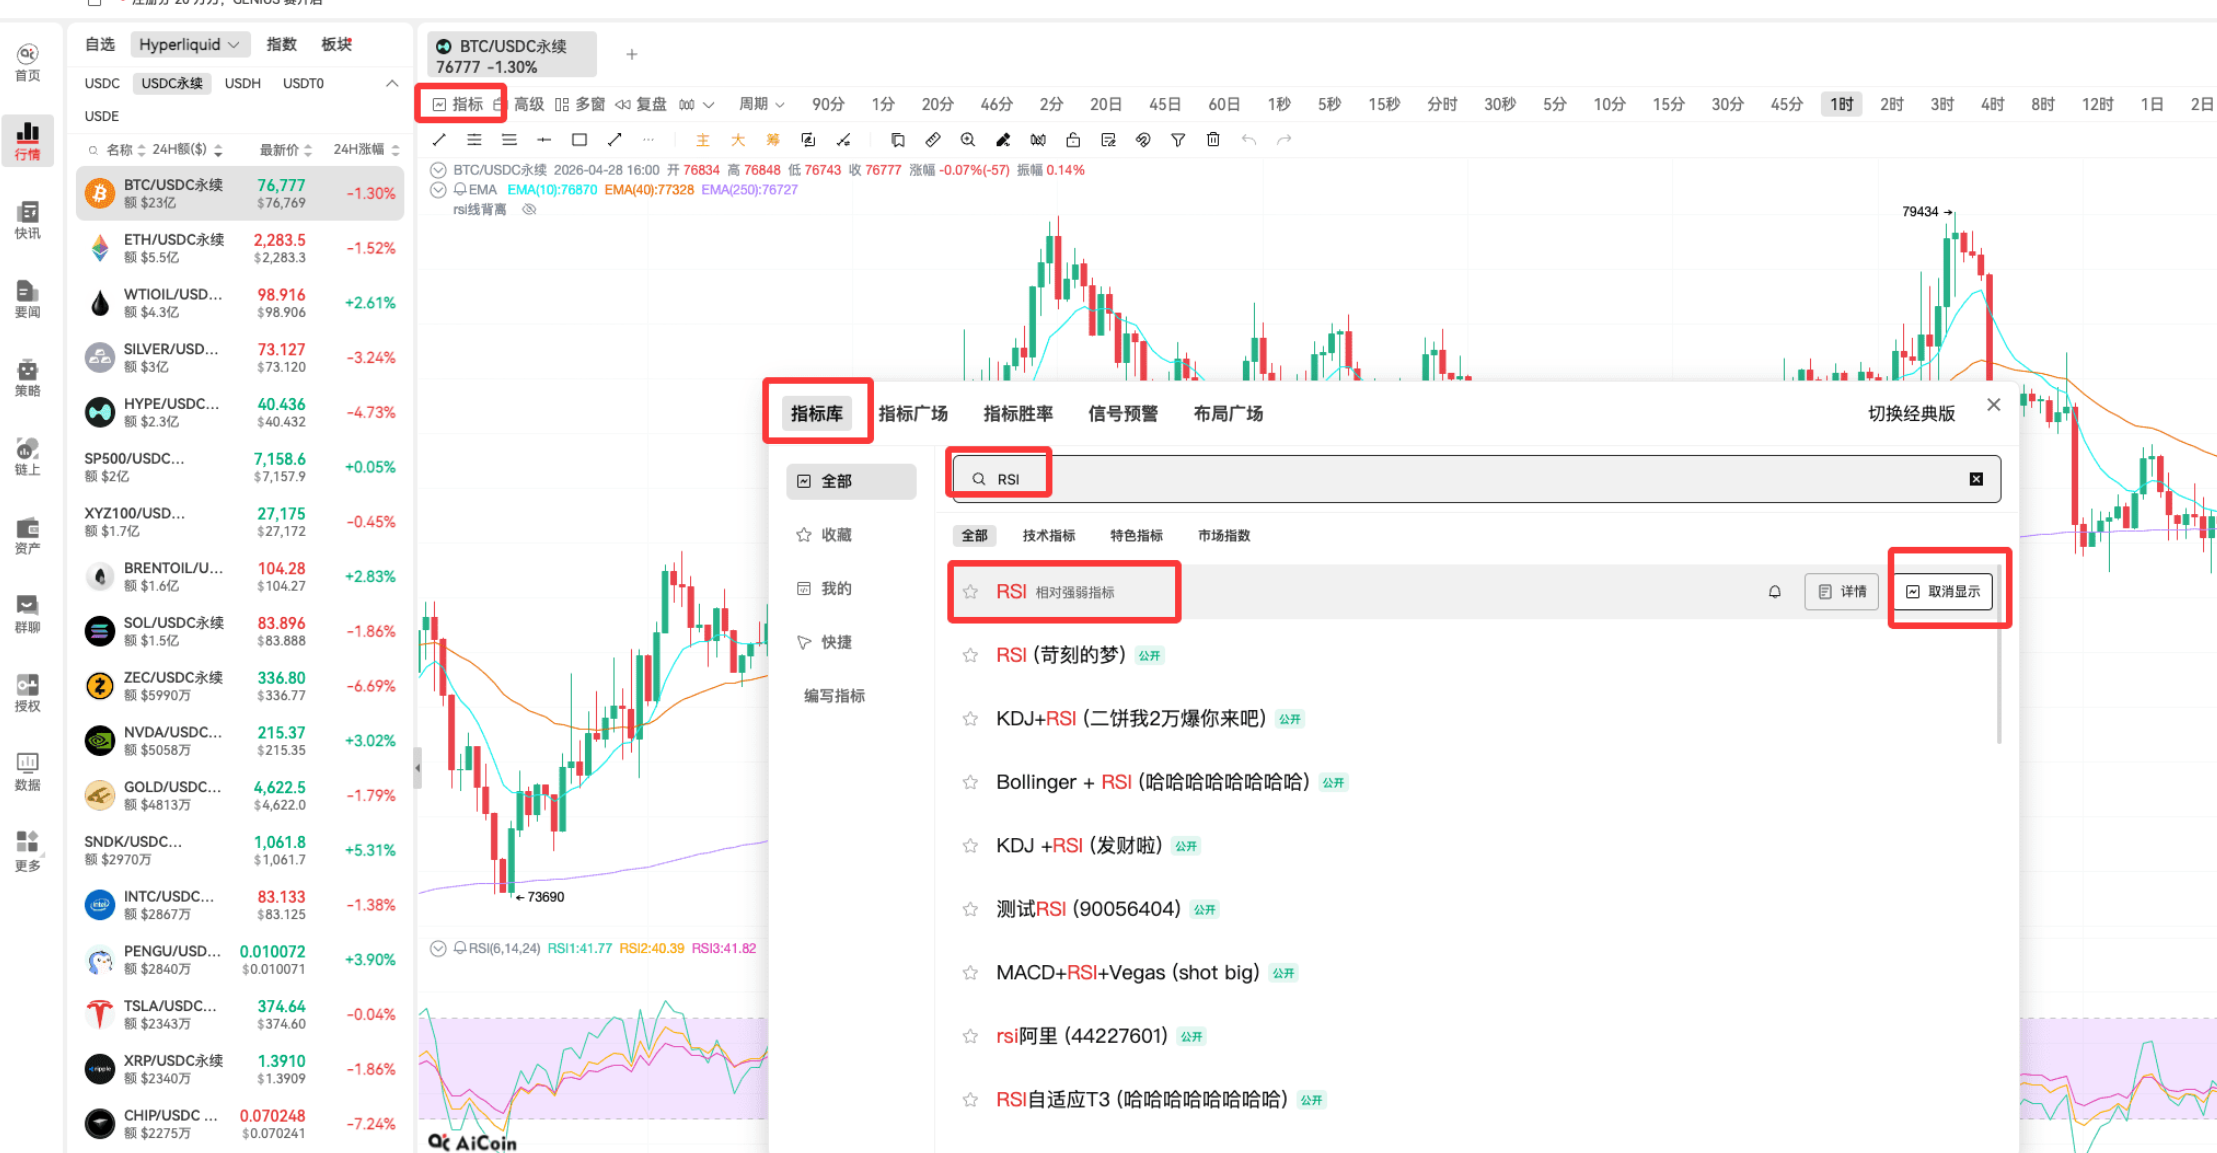
Everyone should directly select this indicator; I will set the parameters for you. From now on, we will use the same parameters and strategy, which is also an exclusive benefit for AiCoin users.

Directly set EMA parameters: 10, 40, 250. Those who find it can respond in the comment section. If you haven't found EMA yet, please don’t make me anxious. Some may wonder why their K-line shows both MA and EMA simultaneously; I specifically cleared the EMA indicator before the live broadcast to make it easier for everyone to follow along.

Now let’s hide the MA indicator; isn’t the chart much clearer? This is also the core reason I recommend everyone to use EMA as the priority given the current market; entering the market at the bottom, EMA is an essential tool.

How specifically should it be used? Remember this core technique: use EMA250 as the support and resistance line for the major trend; this is also the core reference for the round bottom signal I have repeatedly mentioned recently. A round bottom is a key signal for the market to gather energy at the bottom, indicating that after testing the bottom, the price is preparing to start an upward move. From a fundamental and capital perspective, this stage often represents the main force quietly accumulating positions.
Once the round bottom releases a buying signal, it means the main force is about to start the market; smart investors will board the train before the main force lifts the price. While the main force is gathering energy, we observe, and when the main force exerts itself, we gain profits in sync, and these subtle signs can all be accurately captured through EMA.

Back to BTC, the question in everyone's mind is exactly what I am going to explain next. How to judge the strength of the round bottom? There is a clear method for this; this position is the first buying point of the round bottom and the earliest entry opportunity.

Let me also predict the market for you; the second buying point of the round bottom will most likely appear at this position, very close to the EMA250 support. After all, market breakthroughs rarely lead to straight-line rises; the second buying point usually forms in reliance on this moving average.

To give a similar example using HYPE, although it cannot be called a classic example, the logic is completely consistent. Even if you miss the first buying point of the round bottom, you can still capture profits at the second buying point. To put it simply, the first buying point is like having the first sip of hot soup.

Do you understand the role of EMA250? The core is to judge the support and resistance of the major trend. Friends who understand this can respond in the comments, and we will continue discussing more refined buying points.
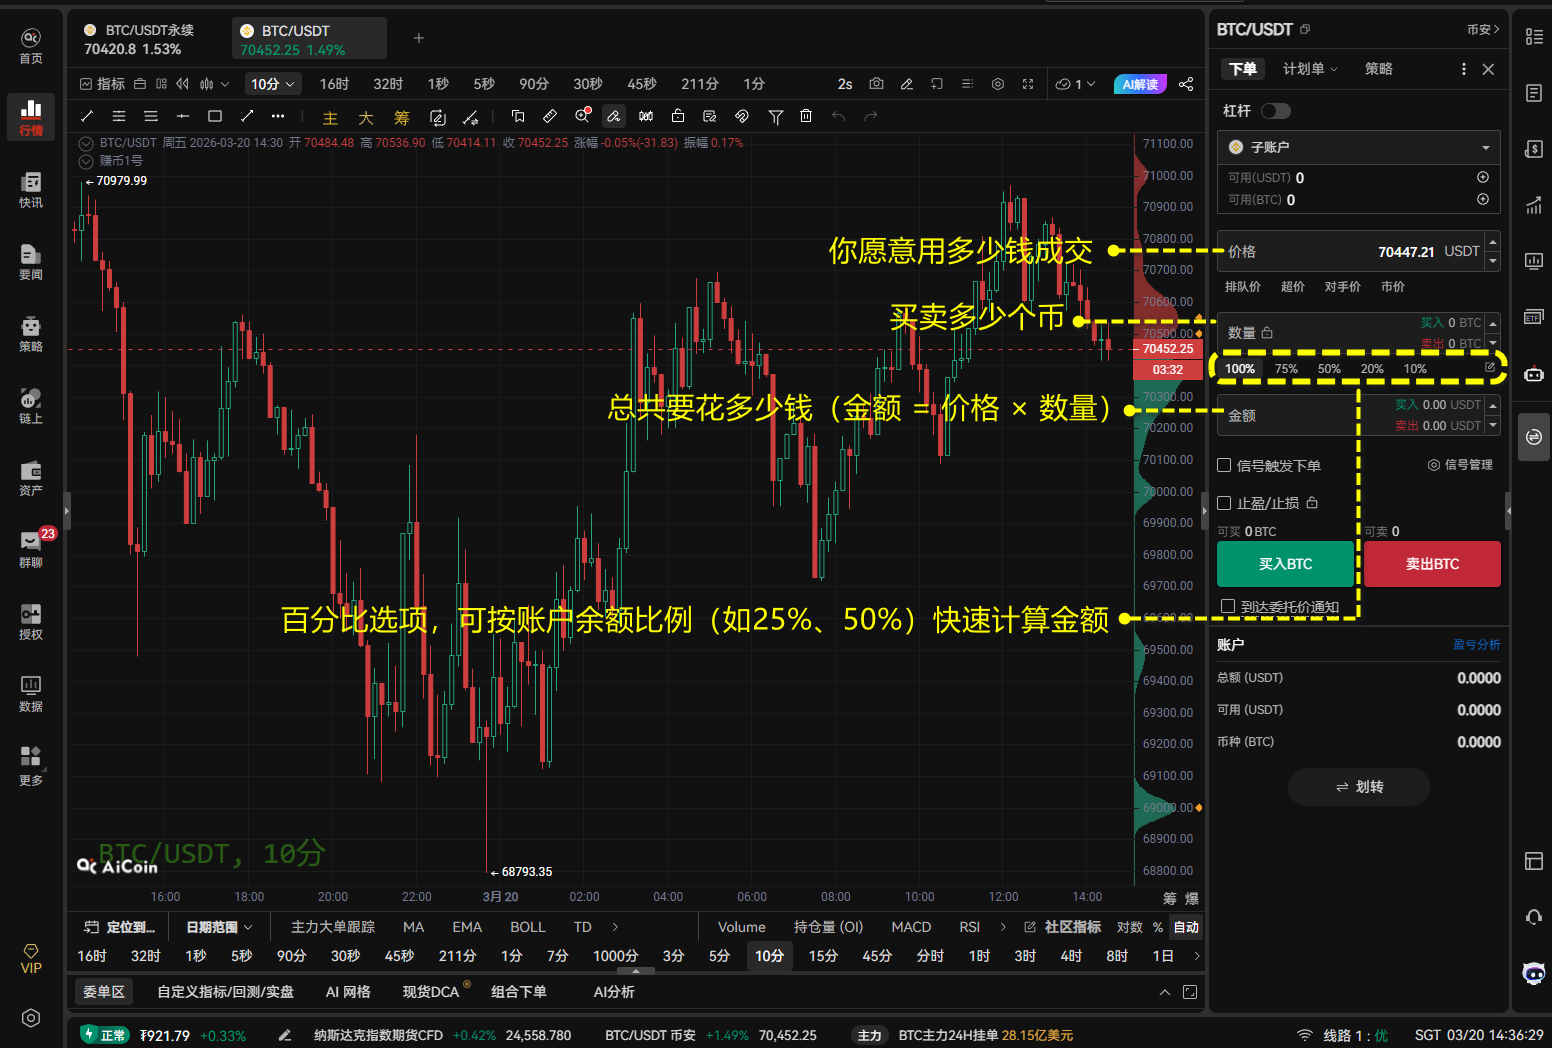
After locking in the round bottom signal, how do we enter the market precisely? Many friends in the circle like to go all in, but most do so mindlessly. If you master this precise buying point strategy, the success rate of going all in will significantly increase. Unfortunately, many people do not have the opportunity to learn this method, unlike you all who can sit down and listen to technical insights.
After discussing EMA250, how do we use the other two moving averages? It’s actually very simple; just look at golden crosses and death crosses. A round bottom pattern combined with a golden cross is a definitive buying point.
Let’s look at a practical example; the BTC 1-hour K-line has formed a strong upward trend with high confirmation. EMA10 and EMA40 formed golden crosses twice on the EMA250 support line, which is also why I am particularly excited today. The probability of BTC continuing to rise is extremely high, and the three moving averages can accurately capture the BTC trend.

The basic logic of golden crosses and death crosses is simply stated: golden cross: EMA10 crosses above EMA40; death cross: EMA10 crosses below EMA40.
The operation logic is clear at a glance. In addition to BTC, many other coins have also shown the same buying point signals, and I’ll show you one by one; this EMA strategy can capture them all.

For friends looking to invest in gold, now is a good buying point (Image 14). After gold prices retraced, they formed a round bottom, and the first buying point has appeared; silver has also formed a standard round bottom pattern. If you have a Hyperliquid account, you can also pay attention to the US stock indices, which have also released round bottom buying signals and show very strong trends.

There are indeed too many opportunities in the market. Let’s take another look at ETH; there is only one statement: the trend is extremely strong! Seeing such high-quality technical signals, who wouldn’t be excited? I can’t help but turn down the air conditioning temperature another notch.

Has everyone mastered this EMA buying point strategy? Friends who understand can interact in the comments.
For friends who don’t have a Hyperliquid account yet, I strongly recommend opening one; it is the leading exchange in the DEX track, with efficient trading and top-notch market depth. A large amount of US institutional capital is trading on this platform.
Directly open the official trading page: https://app.hyperliquid.xyz/join/AICOIN88. Click the Connect button in the upper right corner to link your wallet; binding your OKX wallet will allow you to trade directly, and the operation is very simple. 
I won’t elaborate further on other matters. I sincerely hope that all trading friends can capture their own market dividends through today’s sharing.
This article only represents the author's personal views and does not represent the position and views of this platform. This article is for information sharing only and does not constitute any investment advice to anyone.
免责声明:本文章仅代表作者个人观点,不代表本平台的立场和观点。本文章仅供信息分享,不构成对任何人的任何投资建议。用户与作者之间的任何争议,与本平台无关。如网页中刊载的文章或图片涉及侵权,请提供相关的权利证明和身份证明发送邮件到support@aicoin.com,本平台相关工作人员将会进行核查。