Cryptocurrency Scholar: The rebound space for Bitcoin on April 16 is limited, key stop-loss and take-profit points highlighted! Latest market analysis and trading suggestions
The current price of Bitcoin is 74200. Many people are calling for a bull market during this rebound, but is it really stable? Today, I'll use real-time data from the daily and 4-hour charts to cool your enthusiasm and thoroughly discuss potential risk signals as well as support and resistance levels. Don’t let short-term bullish candles cloud your judgment; clarify the trends and risks before deciding whether to enter the market. Otherwise, chasing entries means picking up the bill. After reading this piece, you’ll know how to avoid pitfalls! I’ll explain everything from trends to indicators, with clear stop-loss and entry points. No fluff, only actionable insights. After reading, you’ll know how to approach your strategy without guessing directions or getting stopped out repeatedly!
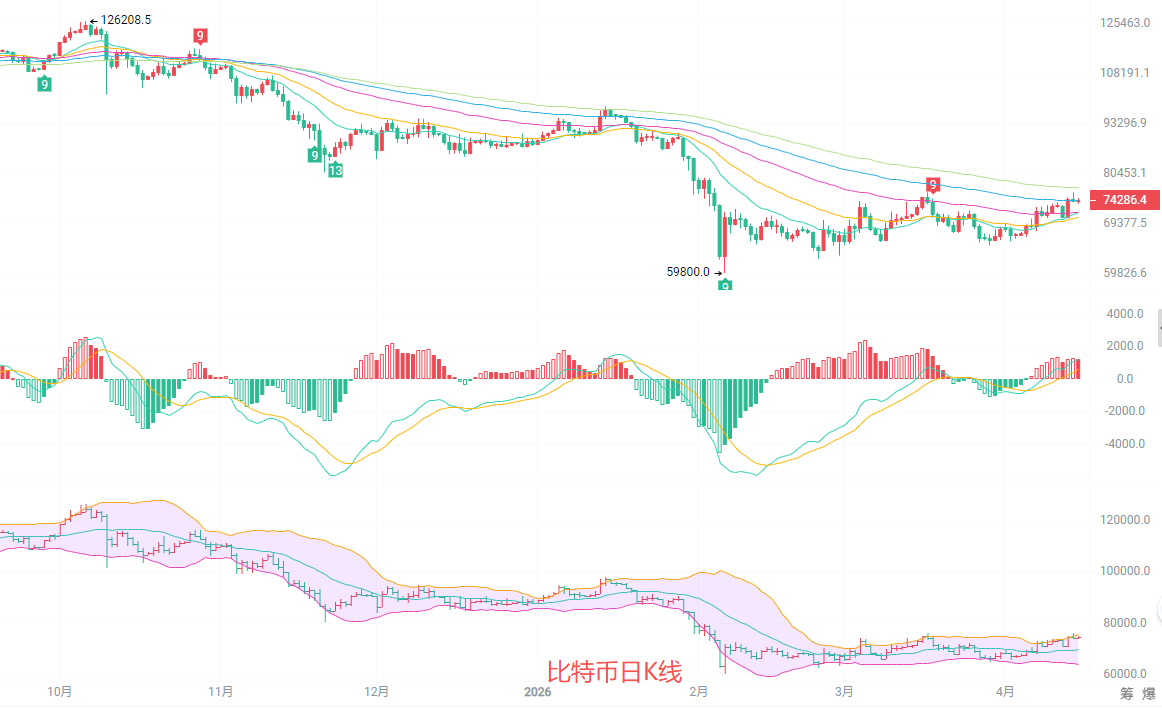
The daily K-line is in a rebound recovery phase after a decline. The price is stable above the EMA15 moving average, and the EMA15 and EMA30 have formed a golden cross upward, indicating a shift in short-term trend from weak to strong. The MACD red bars continue to expand, with the DIF and DEA above the zero line, indicating that bullish momentum is gradually being released. The middle line of the Bollinger Bands is turning upward; after a quick pullback to the middle line, the price surged, showing strong support below, with a high probability of continuing an oscillating upward trend in the short term.
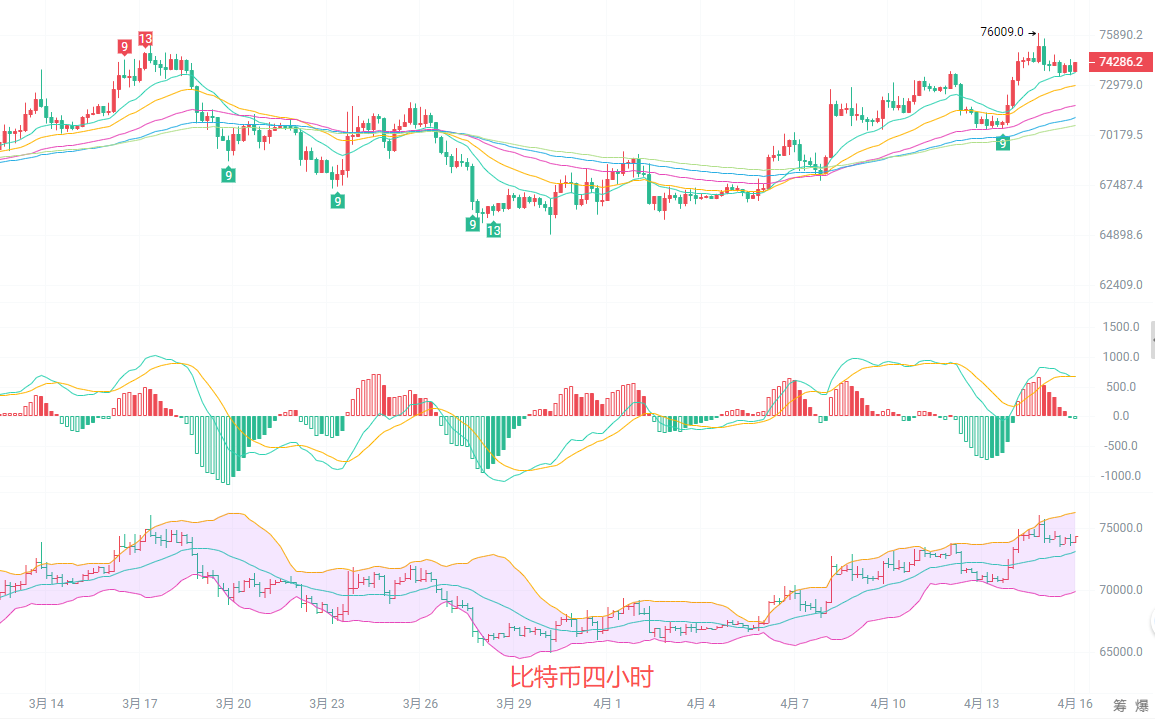
The 4-hour K-line has formed a standard ascending channel, with prices steadily rising relying on the EMA15 moving average. Each time it pulls back to the moving average, it quickly recovers, indicating a very healthy bullish rhythm. Although the MACD red bars have shrunk, they remain above the zero line, showing no obvious bearish signals. The upper line of the Bollinger Bands has been tested multiple times, and the current price is near the upper line, indicating a need for slight pullbacks to gather strength. However, the overall upward trend has not been broken, and pullbacks present buying opportunities.
Short-term strategy reference: Follow the long-term trend with small stop-losses for quick in-and-out trading.
For buying at 73500 to 73000, set a stop-loss at 72200 and target 75500 to 76500.
For selling at 76000 to 76500, set a stop-loss at 77200 and target 74100 to 73000.
In the cryptocurrency world, the quick-minded eat meat, the later-comers get soup, and the oblivious end up picking up the bill.
Specific operations should be based on real-time data from the market. For more detailed information, you can consult the author. There may be delays in article publication; these suggestions are for reference only, and risks are to be borne by the reader.

Friendly reminder: The above content is solely created by the author of this public account. Advertisements at the end of the article and in the comments section are unrelated to the author. Please be cautious in distinguishing these, and thank you for reading.
免责声明:本文章仅代表作者个人观点,不代表本平台的立场和观点。本文章仅供信息分享,不构成对任何人的任何投资建议。用户与作者之间的任何争议,与本平台无关。如网页中刊载的文章或图片涉及侵权,请提供相关的权利证明和身份证明发送邮件到support@aicoin.com,本平台相关工作人员将会进行核查。