Cryptocurrency Scholar: After the high-level pullback of Ethereum on April 19, where are the opportunities? The K line structure tells you who is stronger, long or short! Latest market analysis and trading suggestions
The current price of Ethereum is 2353, having dropped from 2463 back to 2353. Many crypto friends were already confused when they found me after the drop! Those who bought high are stuck, and short sellers are afraid it will rise again, getting hit from both sides. In the current market, don’t let temporary rises and falls cloud your judgment. Always use stop-loss in contract trading; don’t hold onto losing positions, as it will only make you sink deeper. The market is always right; the only wrong is our operations. Keep a steady rhythm, manage risks well, and you can steadily profit in the cryptocurrency space and go further.
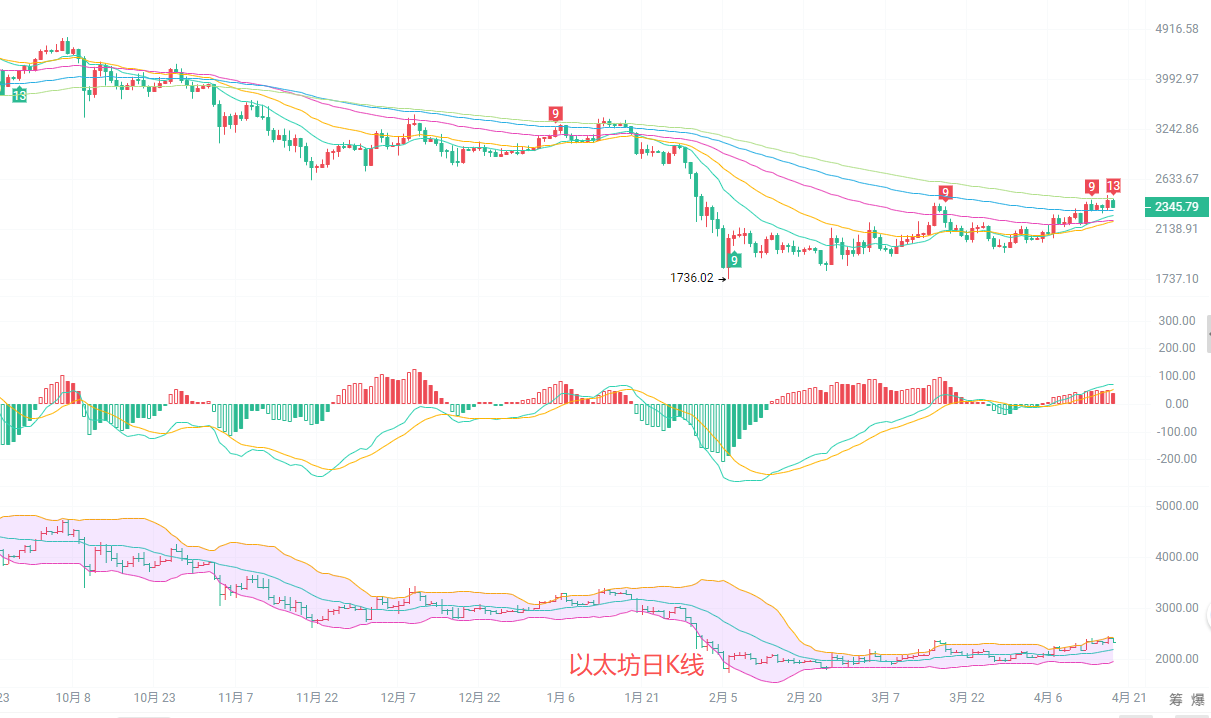
The daily K-line has closed as a bearish line with a long upper shadow, with the price retracting from the upper Bollinger Band. Although the Bollinger Band's opening has not contracted, the pace of increase is clearly slowing down. The MACD red bar continues to shorten, and the difference between DIF and DEA is narrowing, indicating a gradual decline in upward momentum. The moving average system is still arranged upward, and the EMA60 line at 2222 forms strong support. As long as this level is not broken, the upward trend will not be destroyed.
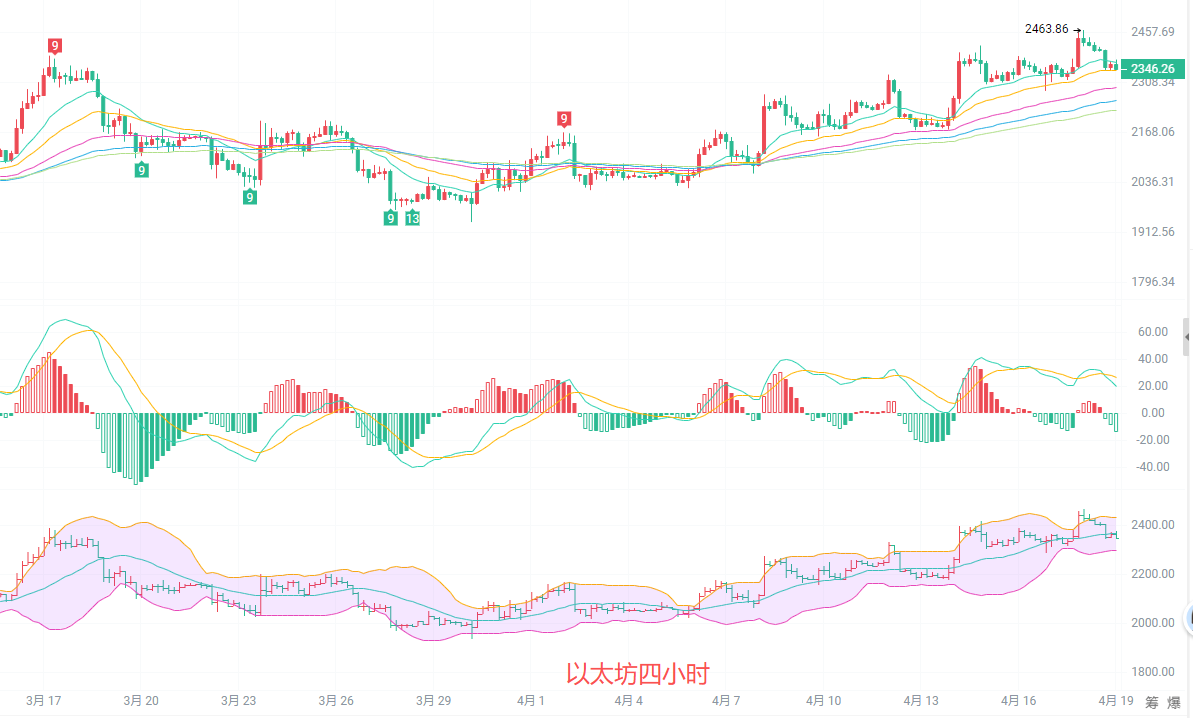
The four-hour chart shows the formation of a double top prototype, currently breaking below the EMA15 line and oscillating near the EMA30 line, with clear pressure from the upper Bollinger Band. The MACD indicator has formed a dead cross, with green bars beginning to increase, favoring short-term downward momentum. If the support near the Bollinger Band middle line at 2365 is lost, it may further retrace to the 2290 level. The current trend is a corrective pullback after an increase, and caution is needed for the risk of a deeper pullback before a clear reversal signal appears. We will operate according to a consolidation mindset for now.
Short-term reference: (Practical data has been updated; please consult the author for details)
For a move from 2280 to 2320 upwards, with a stop-loss at 2250, target at 2370 to 2400; if broken, look toward 2430
For a move from 2370 to 2400 downwards, with a stop-loss at 2435, target at 2310 to 2280; if broken, look toward 2240
Specific operations should be based on real-time market data; for more information, please consult the author. There may be a delay in article publication; suggestions are for reference only, and risks are borne by the individual

Warm reminder: The content above is solely created by the author of the public account. The advertisements at the end of the article and in the comment section are unrelated to the author. Please identify carefully; thank you for reading.
免责声明:本文章仅代表作者个人观点,不代表本平台的立场和观点。本文章仅供信息分享,不构成对任何人的任何投资建议。用户与作者之间的任何争议,与本平台无关。如网页中刊载的文章或图片涉及侵权,请提供相关的权利证明和身份证明发送邮件到support@aicoin.com,本平台相关工作人员将会进行核查。