Coin Sea Riding Waves: April 21 Ethereum (ETH) Market Analysis Reference:

Ethereum's intraday market continues to fluctuate within a range. Observing the daily candlestick chart, Ethereum is still in an upward trend on the daily level. The current price is supported by the middle band of the Bollinger Bands and is fluctuating around 2325. The Bollinger Bands are still expanding, with the upper band at 2462 forming strong resistance. The EMA moving average system is in a bullish arrangement, and the short-term moving averages are still providing support below the price, but the long-term EMA 120 is above the price, forming downward pressure. In terms of momentum, the MACD histogram is continuously shortening, and although the DIF and DEA are still above the zero line, they have started to turn downward, indicating that the upward momentum is gradually diminishing; the RSI and KDJ indicators have both retreated from high levels to the neutral zone, showing that the bullish strength is temporarily consolidating, and there is a short-term need to retest support. If it cannot quickly recover the previous high, it is very likely to maintain high-level fluctuations.
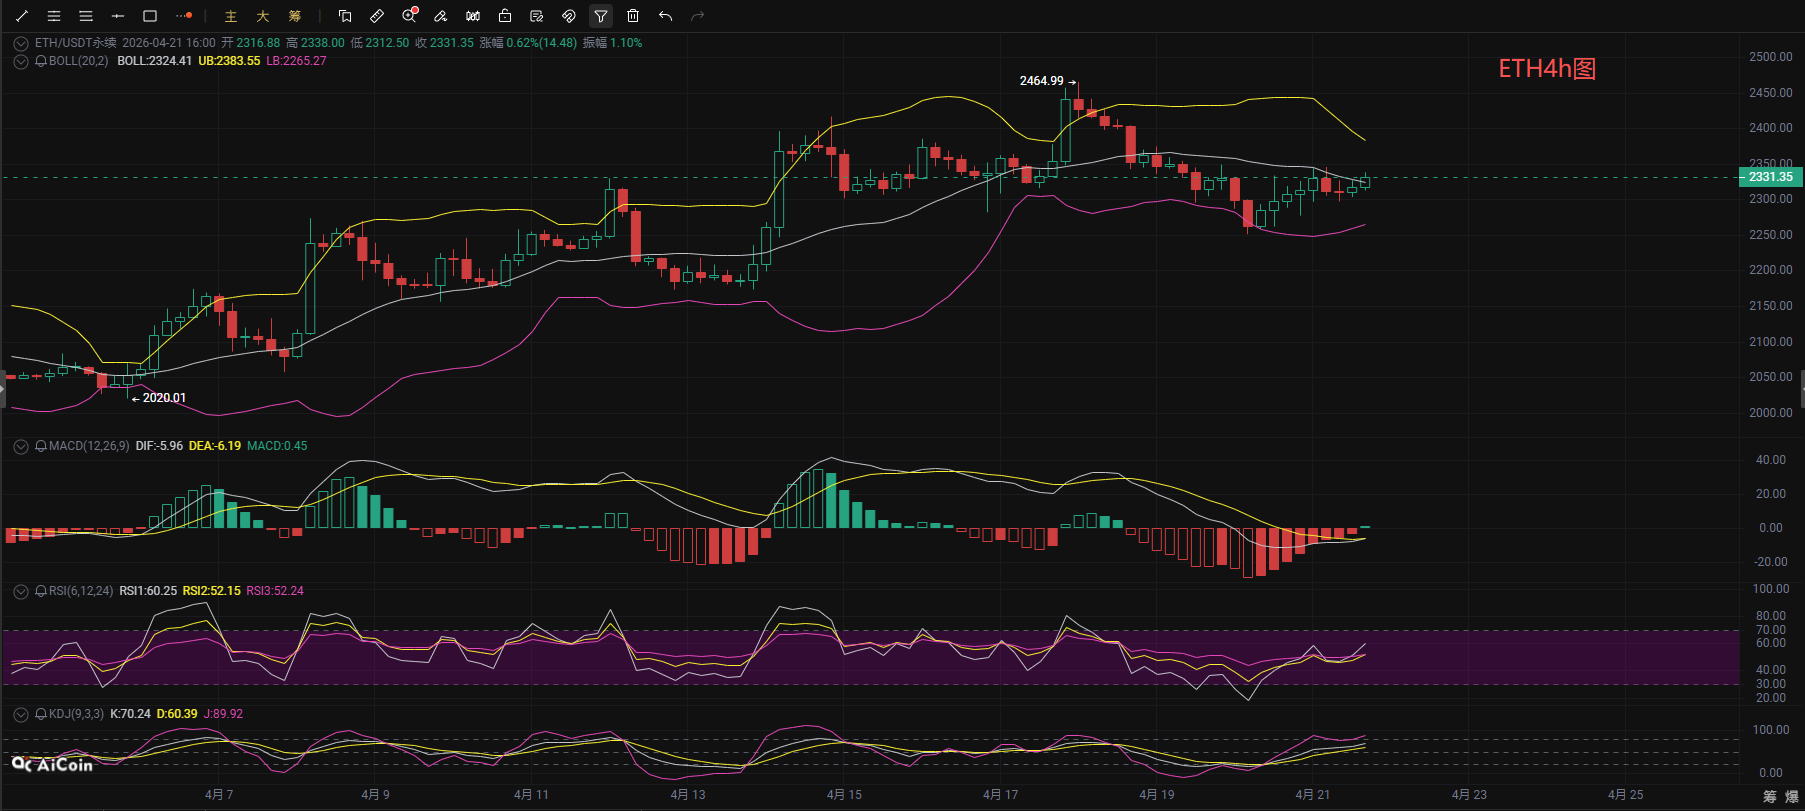
From the perspective of a short-term hourly chart, the 4-hour level is in a stabilization phase after a pullback, with the price consolidating in a narrow range near the middle band of the Bollinger Bands. The upper and lower bands of the Bollinger Bands are narrowing, compressing the fluctuation range to 2264-2382. The EMA moving average system has turned flat from its decline. Although the current price is above the short-term moving averages, it has not stabilized. The MACD has turned positive from negative, and the DIF and DEA show signs of forming a golden cross below the zero line. Bearish momentum has almost been completely released, and short-term bulls are beginning to attempt a counterattack. The RSI and KDJ indicators are turning upward from low levels, and the KDJ's J line has entered the edge of the overbought region, indicating that short-term rebound momentum is accumulating. The primary resistance above is near 2380, and if it breaks through, it is expected to return to the daily upward channel; otherwise, it may again test the stage low of 2250. In terms of operations, it is recommended to sell high and buy low based on support and resistance levels, strictly implement take-profit and stop-loss strategies, and refrain from chasing trends blindly.
Coin Sea Riding Waves: April 21 Short-Term Reference for Ethereum:
Short Position: Sell in the 2400-2370 range, stop loss of 30 points, target at 2350-2300,
Long Position: Buy in the 2260-2090 range, stop loss of 30 points, target at 2310-2370,
【The above analysis and strategies are for reference only. Please bear the risks yourself. The release of the article may have delays, and strategies may not be timely. Do not operate blindly】

This article content is authored and shared by【Coin Sea Riding Waves】, representing personal views only. The article may have delays in transmission and is for reference only. Please do not operate blindly! Want to get more daily real-time signals? Then follow my public account! Here, you can learn technical analyses online and understand knowledge related to exiting strategies. I have years of research experience in the market and focus on the overall trends in the cryptocurrency space. Mainly responsible for analyzing and guiding investment operations for BTC, ETH, SOL, BCH, and other currencies. Welcome to study and research together.
免责声明:本文章仅代表作者个人观点,不代表本平台的立场和观点。本文章仅供信息分享,不构成对任何人的任何投资建议。用户与作者之间的任何争议,与本平台无关。如网页中刊载的文章或图片涉及侵权,请提供相关的权利证明和身份证明发送邮件到support@aicoin.com,本平台相关工作人员将会进行核查。