Coin Waves: 4.23 Ethereum (ETH) Market Analysis Reference:
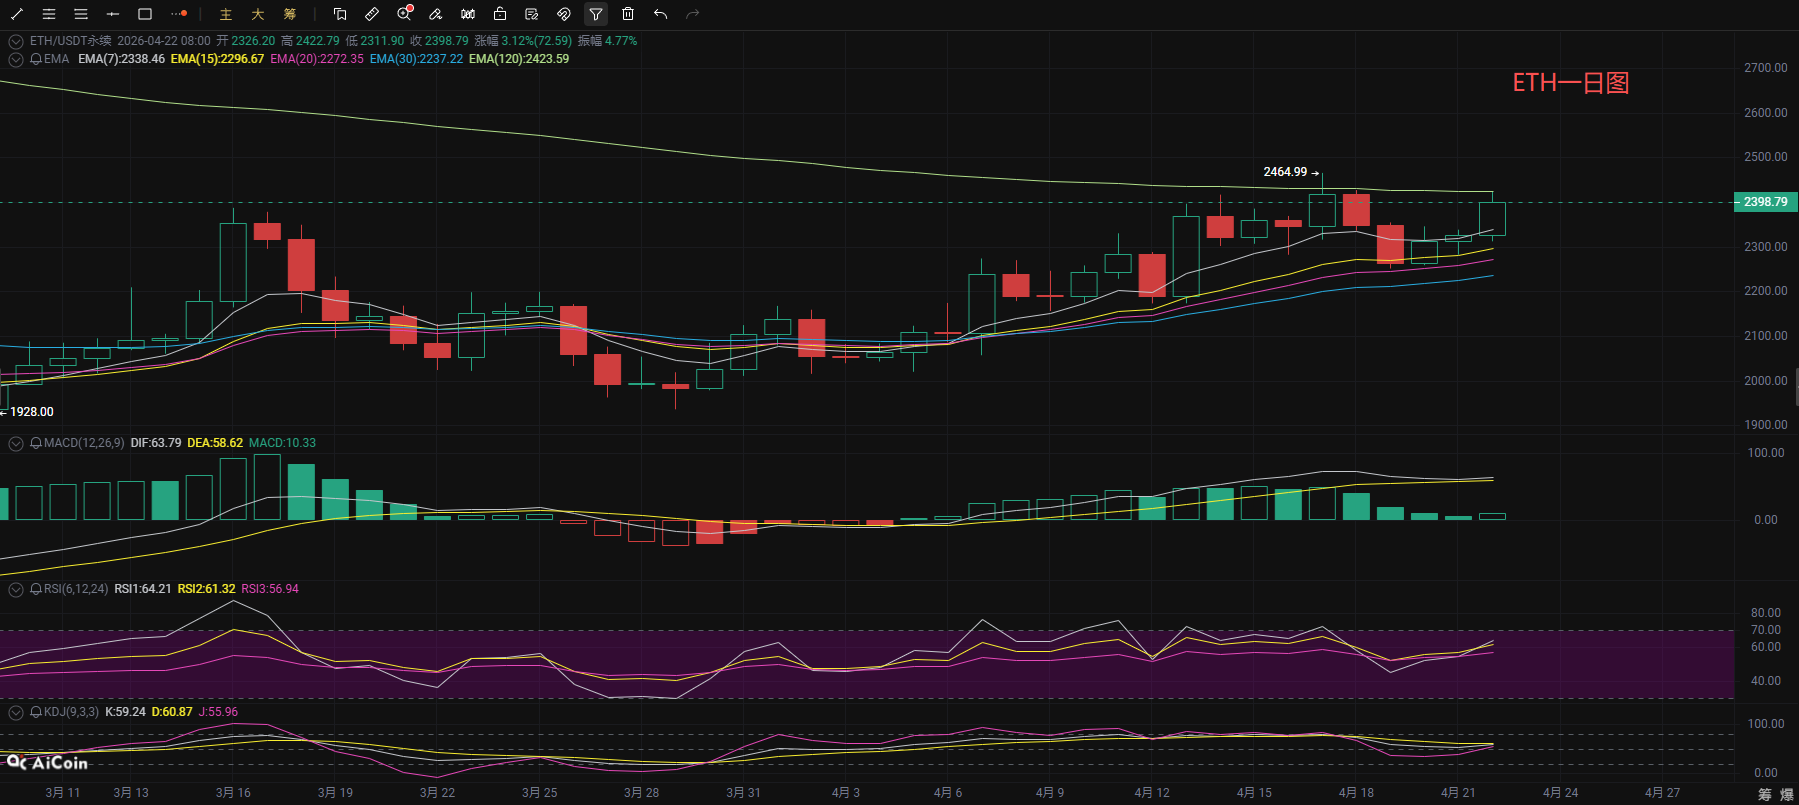
Ethereum's daily chart is in a fluctuating upward channel, with the price steadily rising based on the middle line of the Bollinger Bands. The moving averages are in a bullish arrangement, and the support level is gradually moving up; the MACD indicator maintains a golden cross above the zero axis. Although the red bars have slightly contracted, there are no obvious bearish signals. The RSI and KDJ indicators remain in a neutral to strong range, and have not yet entered an extreme overbought area. Overall, the rising structure at the daily level remains intact, and there is a high probability that it will continue a strong upward trend with high-level fluctuations in the short term. The key support is located near the middle line of the Bollinger Bands and the EMA15 moving average. As long as this support is not effectively broken, there is still momentum to challenge previous highs.
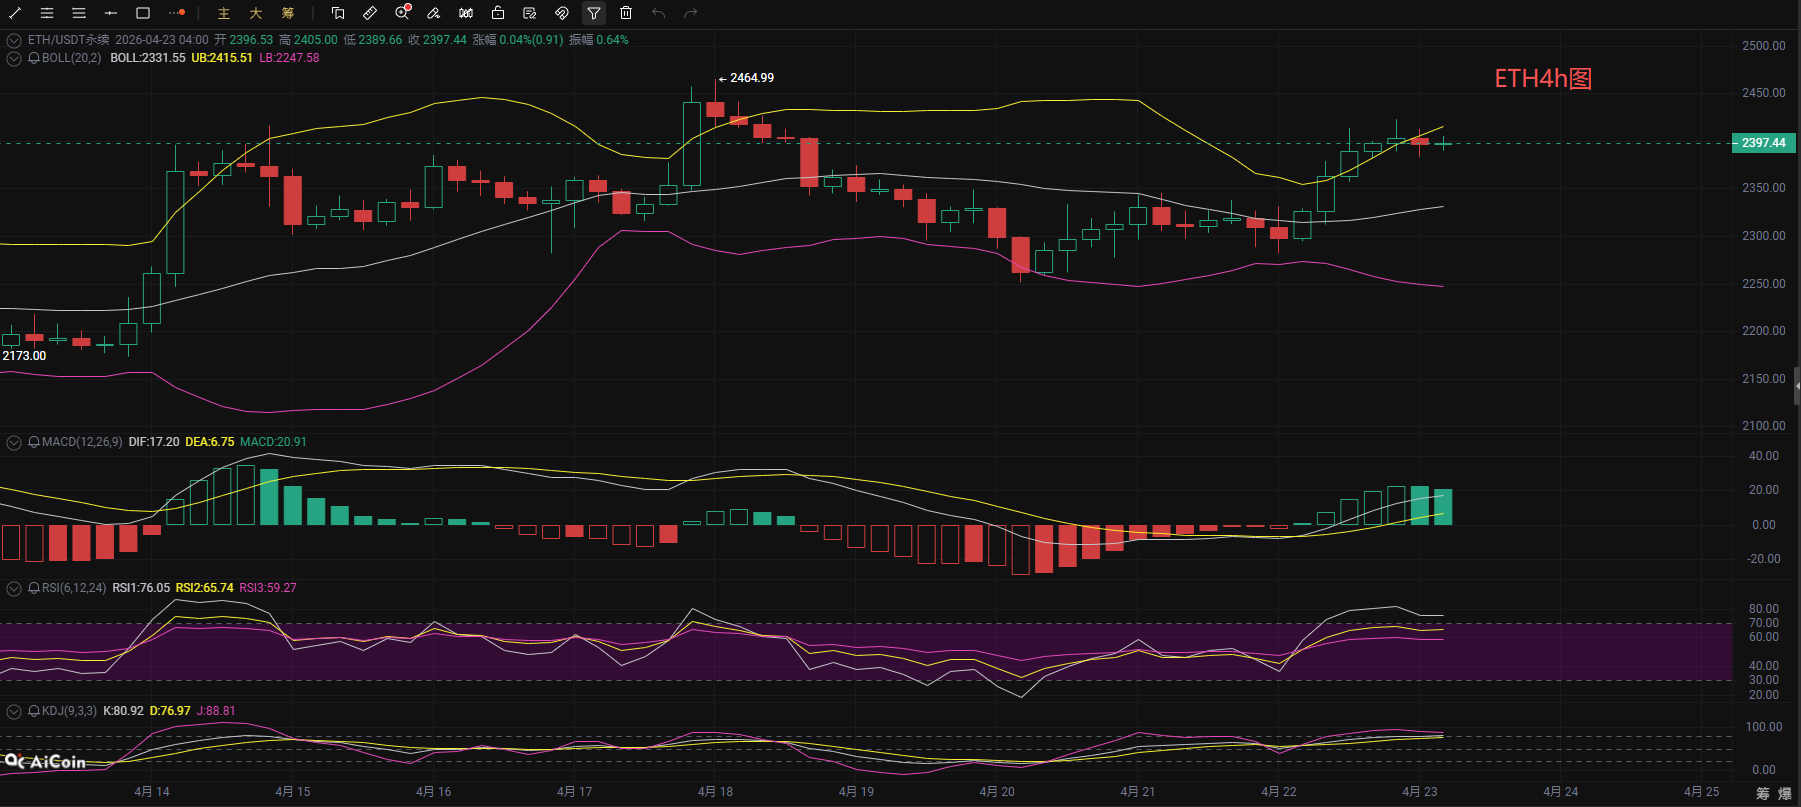
From the observation of the short-term hourly chart, Ethereum's price on the 4-hour level is repeatedly under pressure near the upper line of the Bollinger Bands, which maintains an opening expansion. The MACD is gradually shortening, and bullish momentum has weakened, but the DIF and DEA still maintain a golden cross; the RSI indicator has slightly retreated from a high position, and although the KDJ indicator is close to the overbought area, it has not yet formed a death cross, overall it is in a high-level consolidation phase. The key support below looks to the EMA15 (2360). If it effectively breaks down, it will test the strength of the Bollinger Bands middle line (2330) support. If it stabilizes here, it is likely to rebound after a backtrack to restart the upward trend.
Coin Waves: 4.23 Ethereum Short-term Reference:
Short Position: Sell in the 2450-2420 range, stop loss 30 points, target 2400-2350,
Long Position: Buy in the 2330-2360 range, stop loss 30 points, target 2380-2420,
【The above analysis and strategy are for reference only. Please bear the risk. The article's review and publication may be delayed, and the strategy may not be timely. Do not operate blindly】

The content of this article is originally shared by 【Coin Waves】 and represents personal views only. The publication of the article has a delay, is for reference only, and should not be operated blindly! Want to get more real-time daily signals? Then follow my public account! Here, you can engage in online technical learning and also learn about knowledge related to exiting positions. I have many years of research experience in the market and focus on the major trends in cryptocurrency. I am mainly responsible for analyzing and guiding investment operations for BTC, ETH, SOL, BCH, and other coins. Welcome to study and research together.
免责声明:本文章仅代表作者个人观点,不代表本平台的立场和观点。本文章仅供信息分享,不构成对任何人的任何投资建议。用户与作者之间的任何争议,与本平台无关。如网页中刊载的文章或图片涉及侵权,请提供相关的权利证明和身份证明发送邮件到support@aicoin.com,本平台相关工作人员将会进行核查。