Summary
• Over the past week, the market has fluctuated upwards amid easing geopolitical conflicts and stable liquidity expectations, with a sharp drop in oil prices, a decline in VIX, and a weakening dollar, collectively boosting risk appetite, leading to a rebound in crypto assets back into an upward range.
• There has been a significant recovery in funding, with both BTC and ETH ETFs experiencing strong net inflows, as institutional funds have refocused on leading products, favoring low-fee and high-liquidity assets.
• The trading structure shows characteristics of "energy dominance, on-chain active differentiation," with a high proportion of traditional financial (TradFi) crude oil and other commodities, and a notable rebound in decentralized exchange (DEX) trading volume.
• There has been a rebalancing in the internal structure of stablecoins and DeFi, with withdraws from yield-bearing and protocol-based stablecoins, while LST protocols received a return of funds.
• Security incidents have caused a chain reaction, leading to de-leveraging and soaring interest rates in lending protocols like Aave.
• The derivatives market continues to exhibit a pattern of "short squeeze congestion but rising prices," with negative funding rates diverging from price increases, accumulating squeeze momentum.
1. Market Focus Interpretation
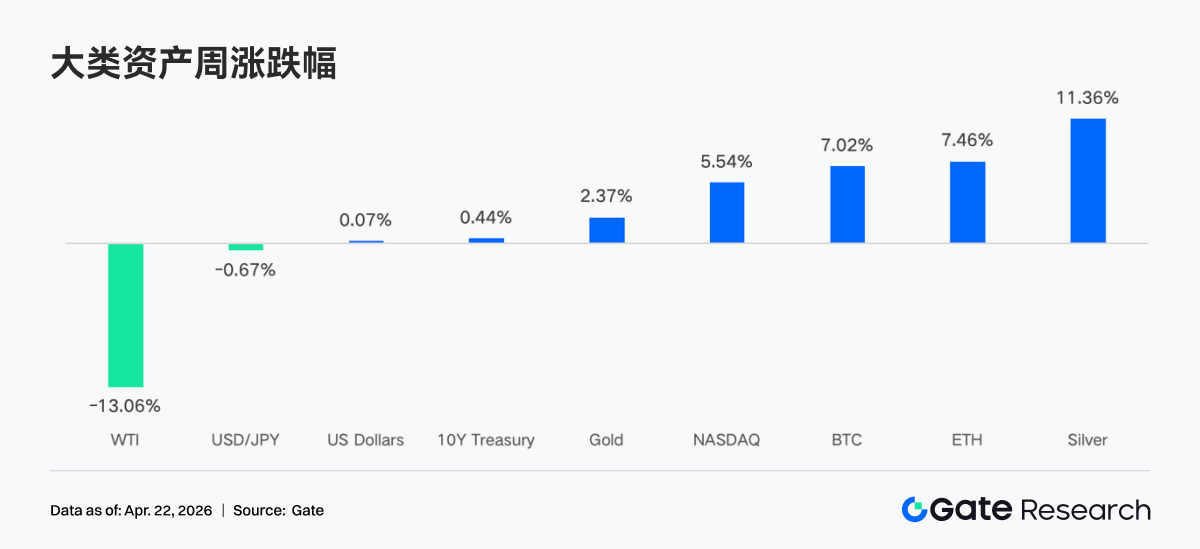
The global cryptocurrency market exhibits a fluctuating trend amidst complex interwoven macroeconomic signals. On Friday, the trade war situation had eased somewhat, but on Saturday an attempt was made to reverse this trend. Iranian Foreign Minister Amir-Abdollahian announced that during the ceasefire between Israel and Lebanon, the Strait of Hormuz would be "completely open" to all merchant ships. Trump swiftly confirmed that the strait was "completely open and can transit at any time." Thanks to the market's optimistic expectations for a Middle East peace agreement, oil prices plummeted by 10%. The crypto market rebounded, with ETFs continuing to realize net inflows. U.S. stocks rebounded from their lows and reached historical highs, with the S&P 500 index rising 11% over 11 trading days since March 30, and hitting an all-time high of $7,162 last Friday. The VIX index fell to 17.48, reaching its lowest level since late February, indicating that the market has substantially repriced war risks. The 10-year U.S. Treasury yield closed around 4.28%, down from April's high of 4.44%. The dollar index fell below 98 for the first time since January.
According to the International Monetary Fund (IMF) World Economic Outlook released on April 16, 2026, the forecast for global economic growth has been lowered to 3.1% due to the ongoing conflicts in the Middle East and the transmission of geopolitical risks, which has weakened the overall liquidity expectations for risk assets. The Fed's actions remain the core driver of the market; currently, the market has largely priced in a 98% chance that the Fed will maintain interest rates at the April 29 meeting. Additionally, the confirmation hearing for Fed Chair nominee Waller is scheduled for April 21, and his hawkish or dovish policy tendencies will directly affect market liquidity in the coming weeks.
2. Liquidity Analysis
2.1 BTC ETFs Create Largest Positive Weekly Flow in Months
Last week, BTC ETF experienced significant intraday fluctuations, with strong net inflows from April 14 to 15, reaching $411.4M and $186.1M, respectively. On April 17, amid a combination of risk-off and bottom-buying sentiment, an astonishing net inflow of $663.9M was recorded in a single day. The weekly net inflow for BTC ETFs was approximately $996.4M, and the Ethereum ETF's weekly net inflow was $275.8M. On comparison, the flow situation for BTC ETFs last week showed significant improvement from the previous week, marking the largest positive week since mid-January, with overall sentiment quickly shifting between risk-off and bottom-buying, ultimately favoring bulls.
Top products by BTC ETF net flow:
1. IBIT (BlackRock) Weekly net inflow of $906.0M
2. ARKB (Ark & 21Shares) Weekly net inflow of $98.5M
Top products by ETH ETF net flow:
1. FETH (Fidelity) Weekly net inflow of $126.0M
2. ETHA (BlackRock) Weekly net inflow of $99.2M
Institutional funds showed a clear trend of concentration last week. BlackRock's IBIT remains the main draw, collecting $906.0M in a single week, with cumulative net inflows approaching $64.63B. In contrast, Fidelity's FBTC faced a net outflow of $104.0M, indicating a battle for funds among different institutional products. On the Ethereum side, Fidelity's FETH performed well with a net inflow of $126.0M leading, while Grayscale's ETHE continued to face a net outflow pressure of $16.67M. This differentiation indicates that institutional investors are placing more importance on fee structures and liquidity depth when choosing products.
Currently, the total assets under management (AUM) of bitcoin ETFs have strongly surpassed the $101.45B mark, with ETF net assets accounting for 6.55% of bitcoin's total market value. For Ethereum spot ETFs, the total net asset value has reached $14.26B, with ETF net assets representing 4.87% of Ethereum's total market value.
2.2 TradFi Liquidity
In the past week, the TradFi Perpetual DEX trading structure has noticeably shifted towards crude oil varieties, with CL and Brent maintaining a high proportion but making a slight retreat from previous levels, remaining the dominant forces overall; meanwhile, WTI has slightly rebounded, and the energy sector continues to be strong. In precious metals, the proportions of gold and silver have seen some recovery but still remain below previous highs, indicating a marginal weakening of risk-off demand. Stock indices and foreign exchange proportions are relatively stable, and the market overall presents a pattern of "energy dominance with balanced contributions from other assets."
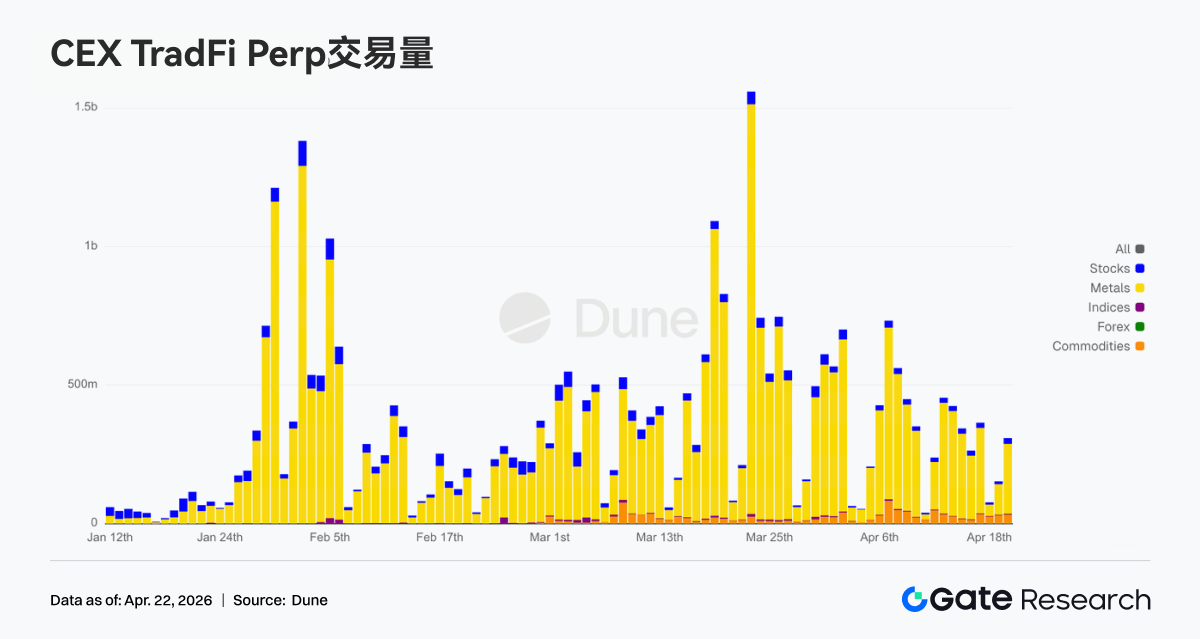
In the past week, daily trading volume in CEX TradFi perpetual contracts ranged mostly between $250M and $450M, a significant drop from the approximately $750M peak at the beginning of April, characteristic of a contraction posture after high-level fluctuations. Structurally, metals continue to be the absolute main force, with stocks being the second major contributor. The proportion of commodities has moderately increased since the end of March, while stock indices and foreign exchange volumes remain relatively small. In the cycle's later stage, daily trading volume rebounded to around $450M, reflecting that after volatility converged, funds remain concentrated in rotation among sectors like metals, and TradFi activity is gradually returning to a normal trading rhythm after extreme fluctuations.
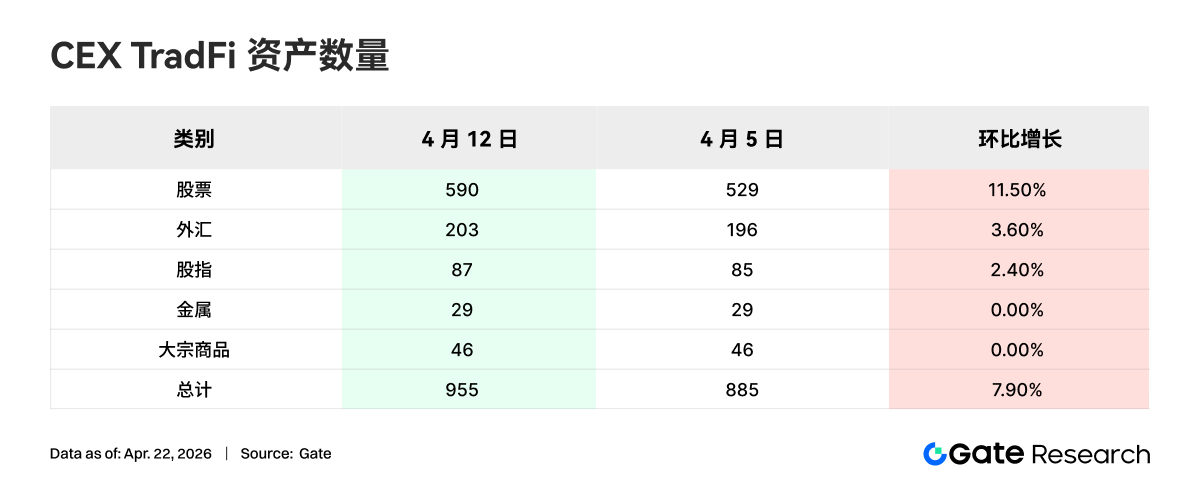
In the past week, the number of asset classes in CEX TradFi has expanded further, with three mainstream CEXs increasing the total number of TradFi asset classes (only counting TradFi and CFD segments, excluding perpetual contracts) from 885 to 955, a week-over-week increase of 7.9%. Among them, stock categories saw the most significant growth, rising from 529 to 590, a week-over-week growth of 11.5%; of which Gate stocks in TradFi increased by 16, a week-over-week increase of 6.5%.
We selected the highest trading volume XAUT in TradFi to analyze its order book depth (Delta). Over the past week, XAUT's spot orders within a ±1% price spread shifted from being dominated by selling pressure to thickening buying pressure: In early to mid-April, during the price testing and consolidation phase, liquidity Delta was significantly negative multiple times, with sell orders piling up more noticeably near the current price; as prices rebounded from approximately $4,640 and solidified at high levels around $4,780–$4,820, Delta turned positive, with a significant spike close to approximately $900,000 near the cycle's end, indicating a relative increase in near-term buying depth.
3. On-chain Data Insights
3.1 BNB Chain Meme Active, PancakeSwap Trading Volume Doubles
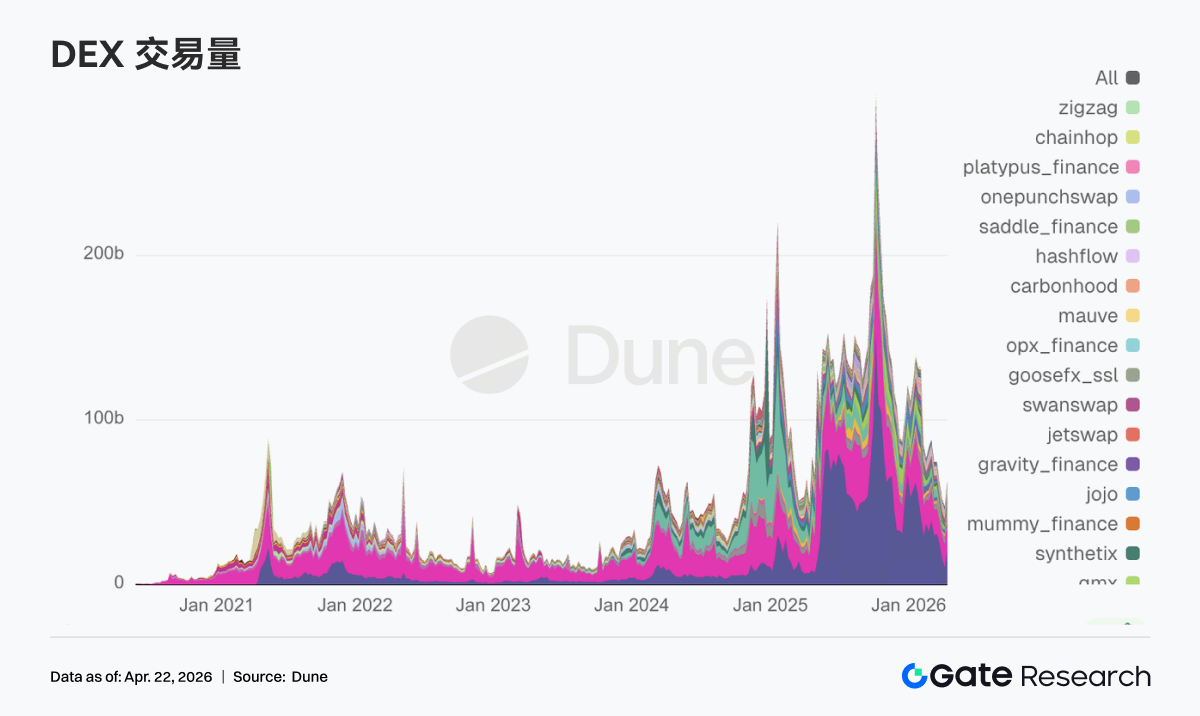
The trading enthusiasm and market value for BNB Chain Meme, represented by "Binance Life," have significantly increased, with PancakeSwap’s weekly trading volume rising to $21 billion, nearly doubling from the previous week, reclaiming its position as the top DEX in trading volume. At the same time, major DEX pools like Uniswap, Aerodrome, Curve, and Fluid have also seen varying degrees of trading increase. There remains trading demand within Solana, indicating that short-term speculation is still present; however, capital preferences for memes have shifted towards the BNB Chain network, which is more closely associated with exchanges.
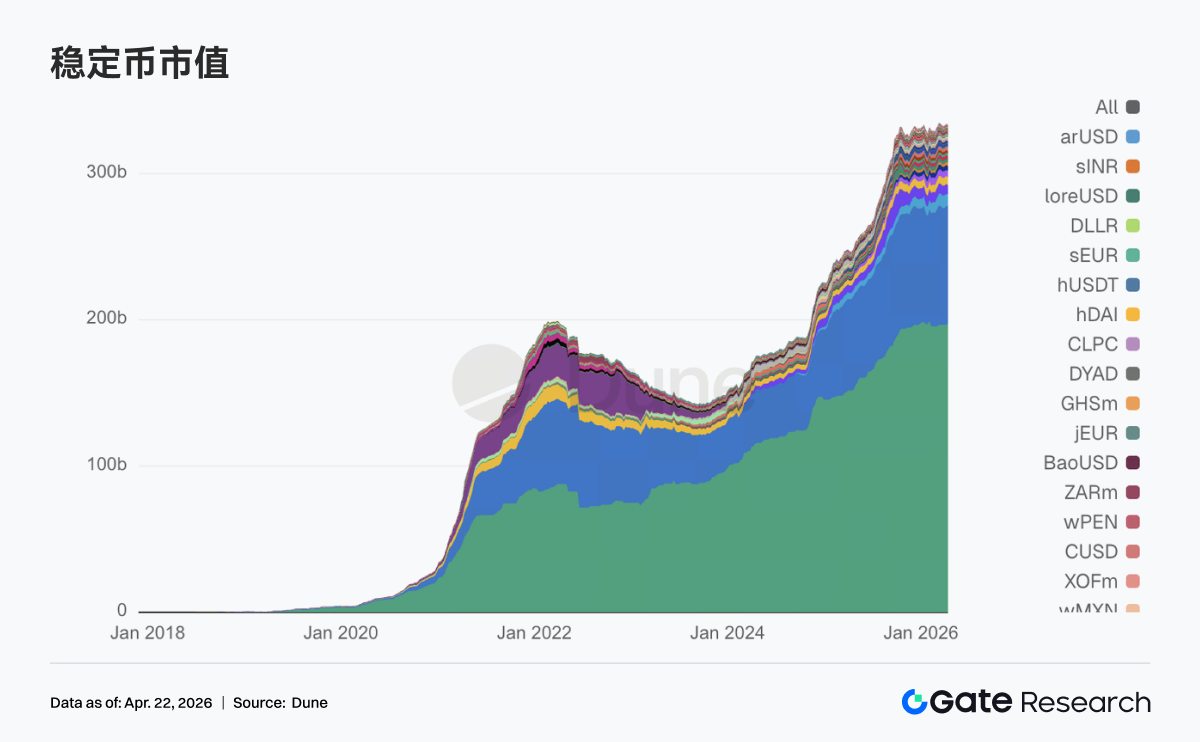
3.2 Stablecoin Sector Fluctuates at High Levels, Some Funds Withdraw from Yield-bearing and Protocol-based Stablecoins
The total amount of stablecoins has not experienced severe contraction, but there has been clear internal reshuffling, as stablecoins that previously attracted funds based on yield have generally reduced their positions this week. USDT increased by approximately $1.02 billion compared to the previous week; USDC slightly retreated and did not expand along with USDT. Due to the recent frequent security incidents, there has been a noticeable withdrawal from the DeFi original side. USDS dropped from $8.56 billion to $7.80 billion, USDe fell from $6.70 billion to $6.41 billion, and DAI also slightly declined. However, payment-type and institutional-grade stablecoins remained unaffected, with PYUSD and USDG showing slight growth.
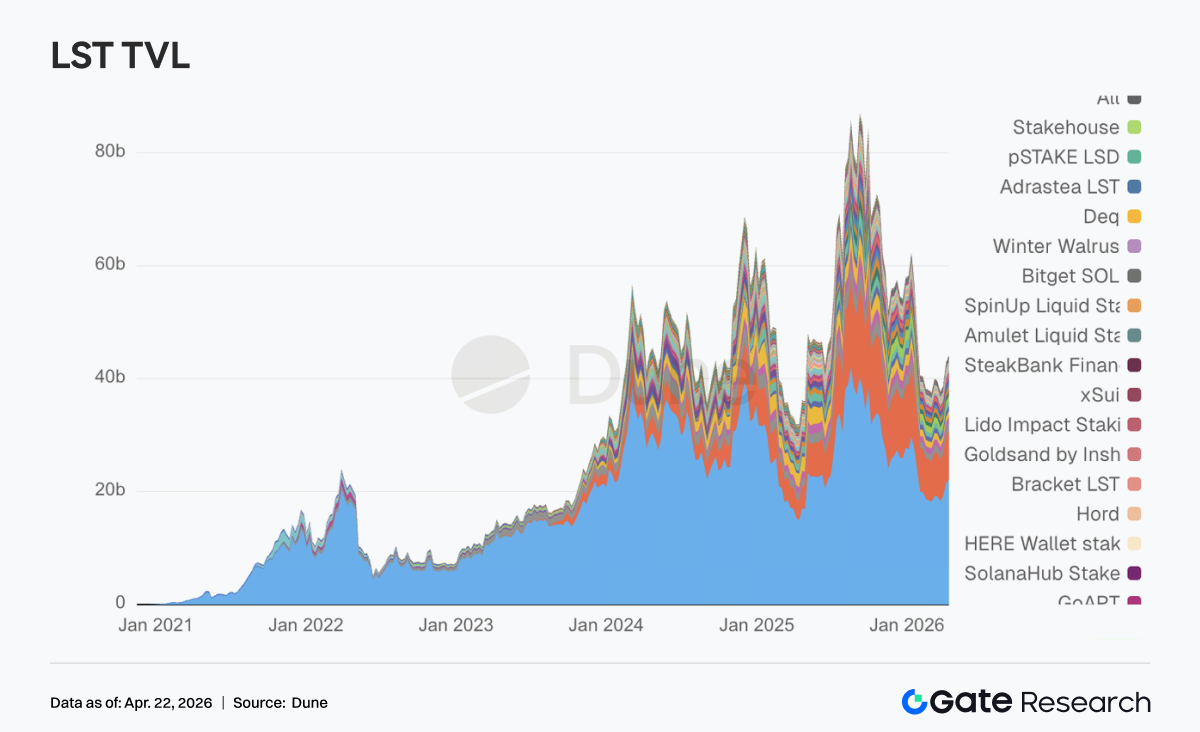
3.3 LST Not Dragged Down by rsETH Incident, Funds Instead Lean Towards Leading Protocols
Despite an incident involving nearly $300 million in funds at the LRT protocol KelpDAO related to rsETH over the weekend, the LST sector proved more resilient than expected, with most leading protocols showing stepped-up activity. Leading ETH LSTs like Lido and Rocket Pool saw inflows of hundreds of millions or tens of millions of dollars. On the SOL side, Sanctum Validator LSTs and Jupiter Staked SOL both exhibited growth, with only Jito seeing a slight decline. This indicates that DeFi players in the market have matured, displaying no excessive panic and instead separating pricing for standardized staking assets that combine cross-chain, cross-chain packaging, and re-staking leverage. The issue with KelpDAO relates to risks involving LRTs like rsETH combined with cross-chain bridging, while traditional ETH LSTs and mainstream SOL LSTs have not been categorized as high-risk assets, and indeed attracted fund inflows.
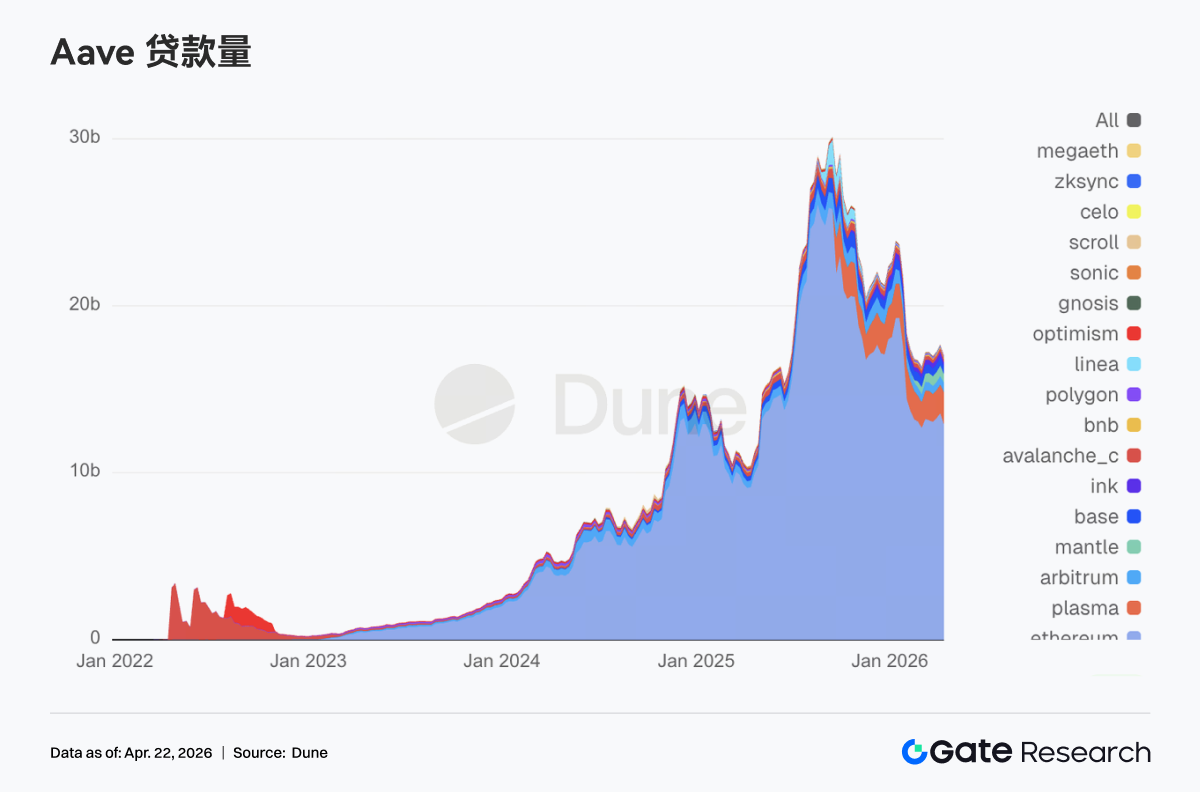
3.4 KelpDAO Incident Significantly Impacts Aave, Lending Funds Withdraw from Main Market
Aave's total loan balance has significantly receded, ending a steady upward trend. Lending scenarios in core networks like Ethereum main market, Mantle, and Base have seen several hundred million dollars in de-leveraging. Aave froze rsETH collateral over the weekend and implemented protective restrictions on WETH across Core, Prime, Arbitrum, Base, Mantle, and Linea. Despite Aave's contract itself not being breached and the issue stemming from KelpDAO's rsETH cross-chain bridge, Aave, as the largest lending pool, bore the most direct chain reactions, further triggering market concerns due to black hats extracting hundreds of millions in potential bad debts using rsETH as collateral. Thus, the V4 Hub-and-Spoke risk isolation framework previously promoted by Aave Labs has suddenly shifted from architectural upgrades to a pressing market need for revaluation.
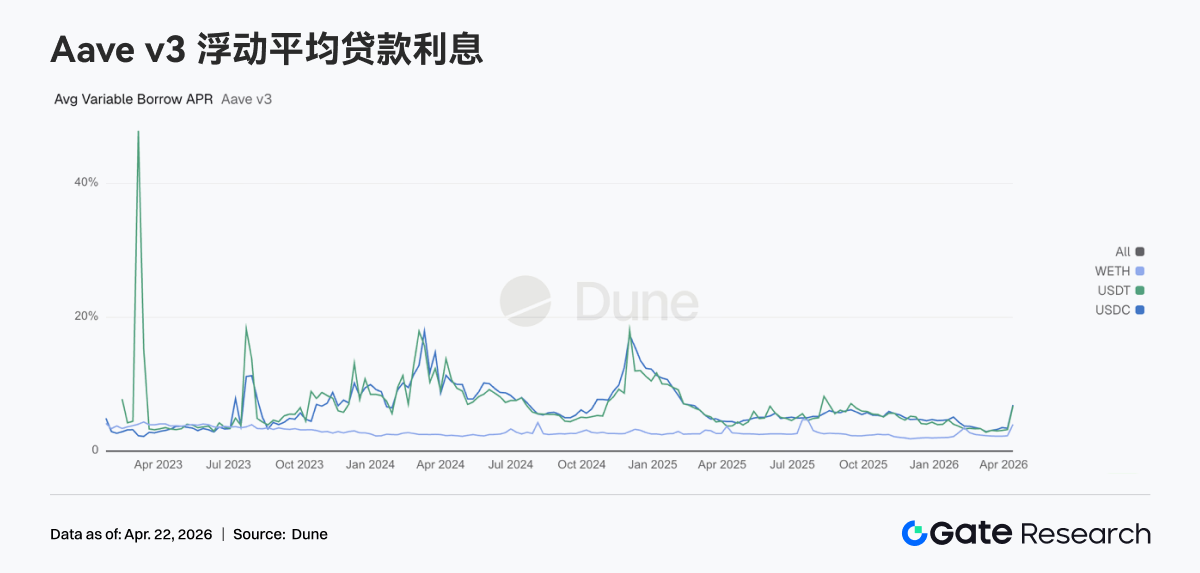
3.5 Security Event Impact, Core Asset Lending Rates of Aave Rise Collectively under Chain Reactions
The rates on the lending side reflect the instantaneous tension during the impact. The average floating borrowing APR for USDC jumped from 3.42% directly to 6.91%, USDT rose from 3.22% to 6.76%, and WETH also climbed from 2.29% to 4.00%. Following the rsETH incident, Aave bore bad debts as market panic spread, liquidity and funds quickly withdrew from Aave, with WETH and stablecoin pools in the main market thinning out, reaching even 100% utilization, leaving almost no liquidity. Aave's risk team adjusted the WETH rate models for Arbitrum, Base, Mantle, and Linea as an emergency response, reducing the costs of borrowing at full utilization from 8.5%-10.5% down to 3%, which further confirmed the tense liquidity situation at that time. The rate spike this week reflects the complete projection of an external black swan penetrating Aave funding rates.
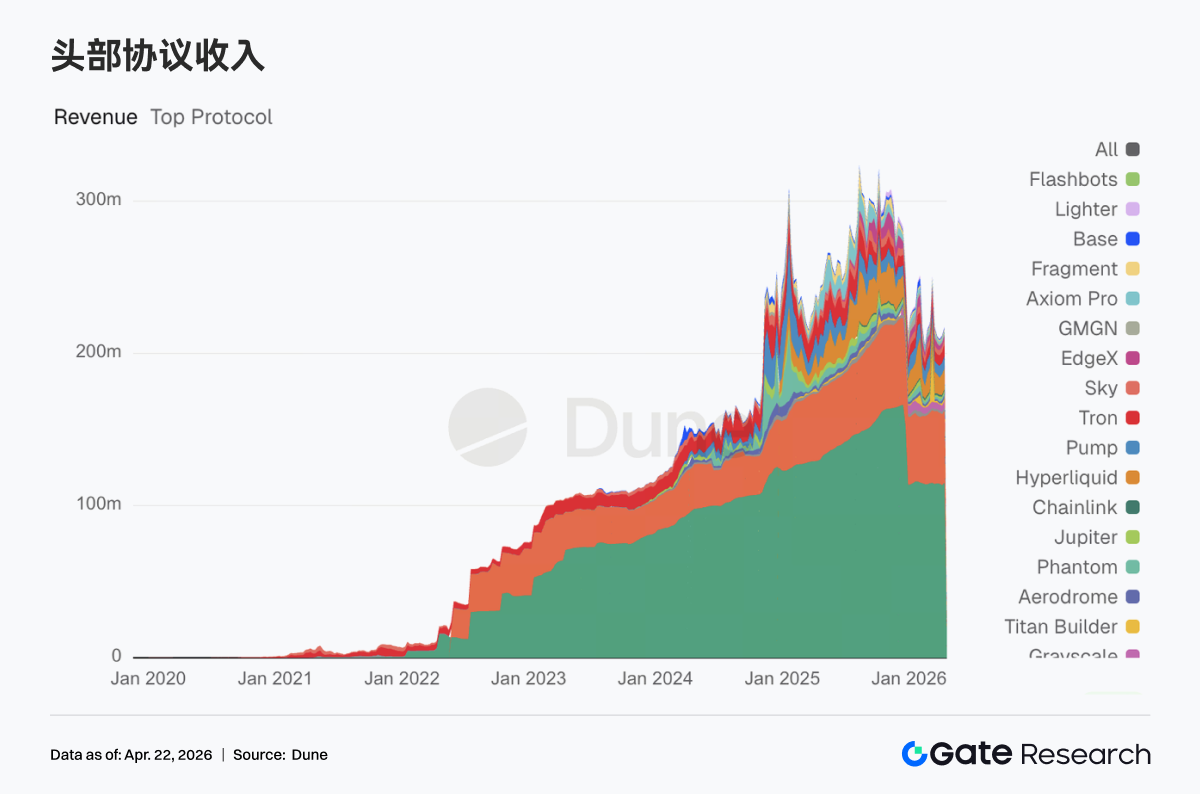
3.6 Leading Protocols' Revenue Remains Steady, Aave Shows Clear Stress Revenue Characteristics
Tether and Circle continue to hold the first and second positions, with stablecoin issuance being the most stable source of cash flow. Hyperliquid and Pump’s revenues are maintaining close to last week’s high, with on-chain trading still showing elasticity. Aave’s revenue this week reached $2.02 million, with a substantial increase from the previous week, but this reflects stress revenue after liquidity was squeezed, so sustainability is limited. Protocols like Aerodrome and Titan Builder, with weekly revenues reaching millions of dollars, have also seen growth, with market funds not leaving trading.
4. Derivatives Tracking
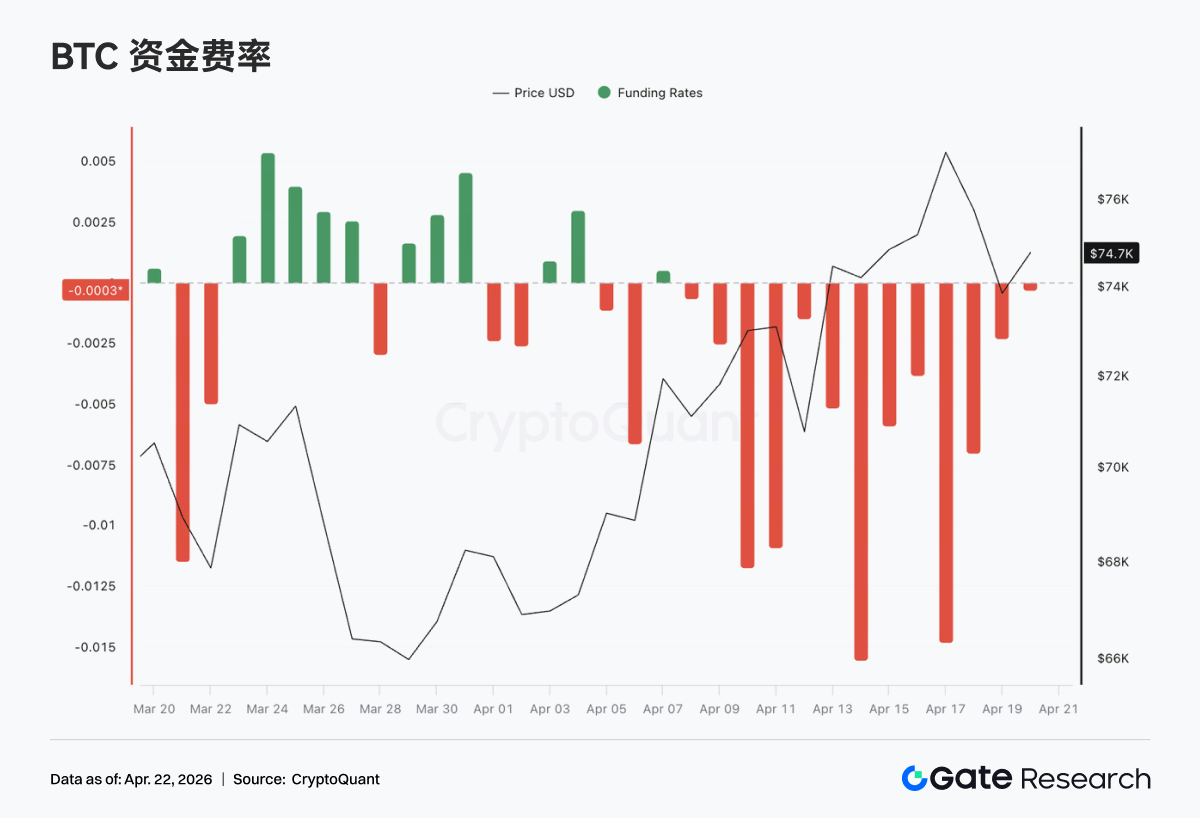
4.1 BTC Funding Rates Continue Deeply Negative, Prices Fluctuate Upwards to New Cycle Highs
Over the past week, BTC funding rates have remained overall in negative territory, with multiple instances of extreme negative values appearing around mid-April (with a low approaching -0.015), indicating that bearish sentiment continues to dominate in the perpetual contract market, with short positions remaining congested at high levels. In contrast, the price, after experiencing earlier corrections, gradually fluctuated upward from around the $70K mark, once peaking near $76K, displaying a typical divergence structure of "deeply negative funding rates but consistently rising prices.” This structure implies that while shorts are continuously paying funding fees, they are also enduring upward price pressure, continually accumulating short squeeze momentum, with price increases more driven by spot buying or passive covering.
From a rhythm perspective, after April 10, funding rates shifted noticeably into deeper negative territory, while prices accelerated upward, creating new cycle highs, indicating that during the price breakout process, shorts did not clearly cut losses, and may even be engaging in counter-trend additions, further reinforcing the potential squeeze elasticity. Overall, the market is currently in a phase dominated by bearish sentiment but exhibiting strong price performance, with derivatives skewed towards bearish while spot or structural buying provides support. In this high-discrepancy structure, if prices maintain elevated levels or further rise, short covering may accelerate the market's movement; however, sustained strong negative funding rates also suggest that once price retracements occur, leveraged shorts could have a buffer, leading to potentially significant short-term volatility.
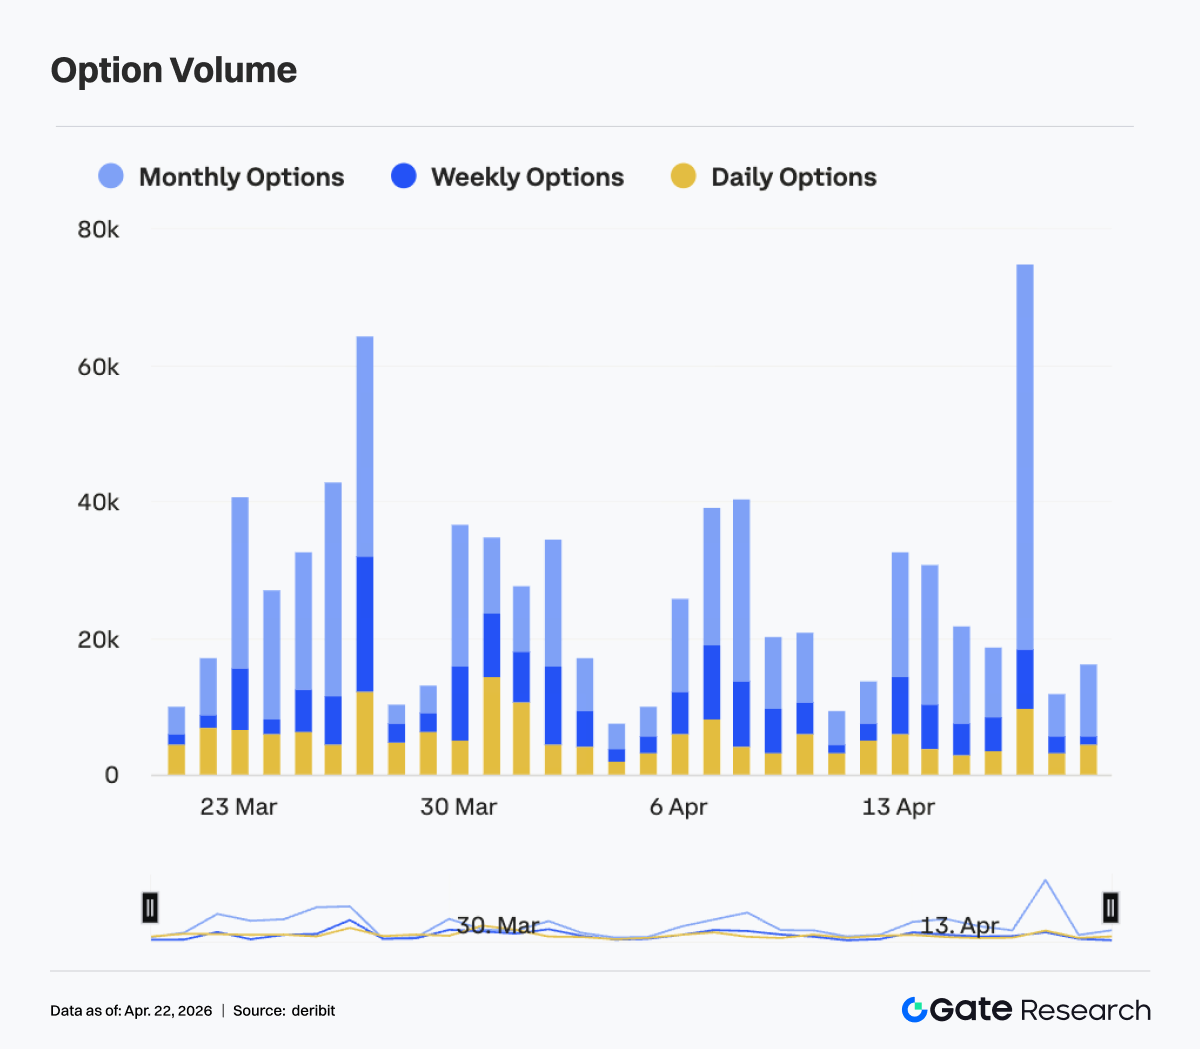
4.2 BTC Options Structure Rapidly Restores, Short-end Elasticity Enhances and Once Flattens
Between April 13 and April 19, the implied volatility of BTC options clearly increased overall, with the structure gradually restoring from the previously relatively steep contango state. Specifically, short and medium-term options' IV (7D, 30D, 60D) were still at low levels around April 13 (approximately -6 to -8 range) but quickly surged afterward, collectively increasing to about -3 to -4 around April 17, significantly enhancing volatility elasticity. In contrast, the upward movement of longer-end IVs (90D and 180D) was relatively limited, and the overall curve displayed a clear "flattening" characteristic, indicating that the market's pricing of short-term volatility has significantly increased.
From a structural perspective, around April 17, short-end IVs momentarily rose above medium and long-end levels, showcasing a brief inversion in the options structure, reflecting the market's rapid warming expectations of short-term event-driven or price volatility. This sharp rise in short-end IV typically corresponds to an acceleration phase of market movements or a stage where uncertainty is concentrated and released, reflected more in trading aspects as a pursuit of gamma and an increase in short-term hedging demand.
However, after April 18, with the quick retreat of short-end IV (7D showing a significant pullback) restoring to a slight positive slope, it indicates that short-term sentiment has cooled, and previously concentrated pricing volatility expectations are beginning to be partially realized or digested. Overall, the current IV options structure has undergone a round of "deep contango → rapid restoration → short-end overheating → rebalancing," with the short-term market quickly shifting from extremely compressed volatility expectations to a repricing of volatility. The structure reflects trading funds rapidly switching risk appetites over short cycles, and attention should remain on whether price volatility converges synchronously during the IV pullback process or triggers a new round of volatility amplification.
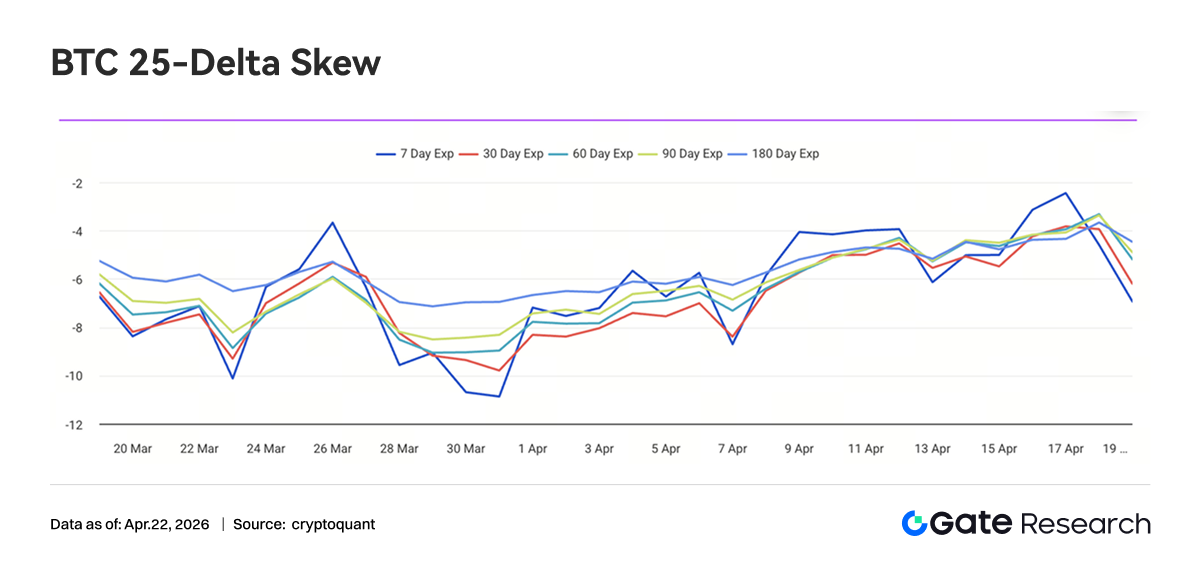
4.3 BTC 25-Delta Skew Raises Significantly, Tail Risk Pricing Continues to Converge
During the period from April 13 to April 19, BTC 25-Delta Skew for all maturities generally stayed in negative territory, but the central level increased significantly, primarily distributing in the -6 to -3 vol range. Compared to the extreme level below -10 recorded at the end of March, the current Skew has significantly restored by approximately 3–5 vol points, indicating that while Put premiums remain dominant, the market's pricing of downside tail risks is continuously converging.
From a maturity structure perspective, the short-end (7D) Skew experienced the most volatility, quickly rising to nearly -2 around April 17, significantly higher than the medium and long-end levels, reflecting a rapid cooling of short-term protective Put demand and even showing signs of "de-hedging" phase-wise. In contrast, the medium and long-end Skews (30D to 180D) were relatively stable, essentially maintaining in the -5 to -3 range; while there were synchronous upward movements, they generally remained in negative territory, indicating that the market still retains a certain defensive allocation under a mid-to-long-term perspective.
Structurally, this round of Skew elevation resonates with rising prices and volatility compression: as prices continue upward, market demand for downturn protection marginally declines, leading to a gradual compression of Put premiums, although there has yet to be a dominant positive Skew structure led by Call premiums. This means that the current market sentiment is shifting from "strong defense" to "weak defense," but has not yet entered a phase of comprehensive risk appetite release.
Overall, BTC Skew has returned from extreme risk-off pricing to a more neutral defensive range, with tail risk premiums significantly declining. If prices remain strong in the short term, Skew still has space for further repair to the -2 to 0 range; however, against a backdrop of persistent negative values at the long-end, institutional funds have not fully shifted to aggressive strategies, and the market overall remains in a transitional phase of "reducing hedges but not fully lifting."
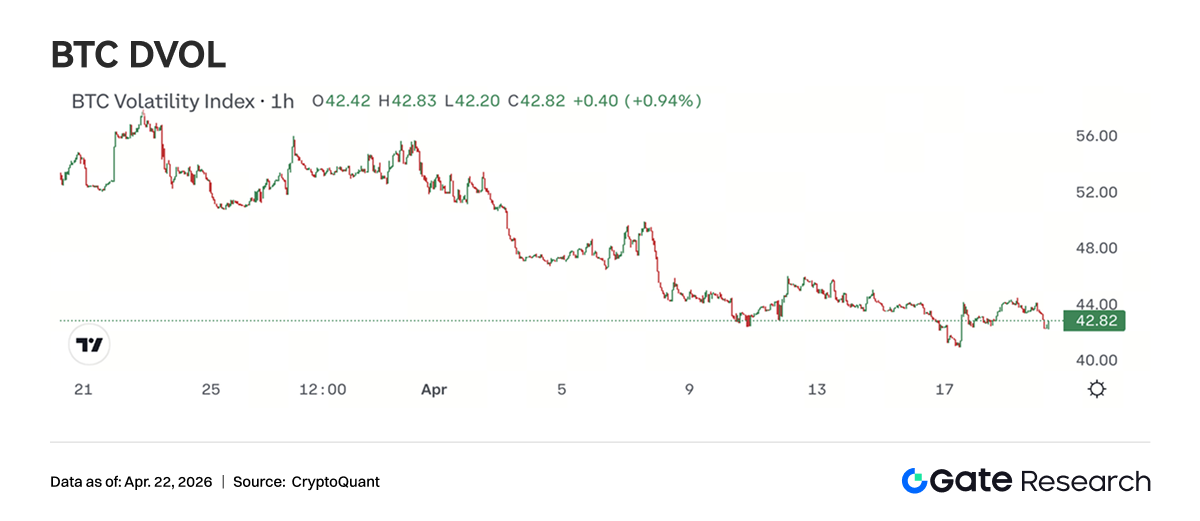
4.4 DVOL Continues to Fall to Low Levels, Volatility Premium Further Converges
BTC DVOL remained on a downward trend from April 13 to April 19, gradually retreating from above approximately 45 to around 42; during this period, though a slight rebound occurred around April 13, it did not form a trend-forward increase, subsequently continuing the decline and hitting a stage low around April 17 (approximately 41). Current DVOL is significantly below early April levels and is approaching historically low ranges, showing that the market's risk premium for short-term volatility is being continuously compressed.
Structurally, this round of DVOL decline has not accompanied obvious price fluctuations; rather, it has gradually compressed during the price's upward oscillation process, reflecting the market's consensus expectation of "trend upward but low volatility." Compared to the previously event-driven volatility spikes (such as short-term rapid increases), the current DVOL decline is smoother, indicating that the market's pricing of sudden risks has evidently dulled, systematically reducing the volatility premium. Current DVOL is gradually nearing the edge of the low volatility range of 40–45; if it continues to decline further, it will enter historically relative low levels. In this context, selling volatility strategies (such as selling spreads, selling wide spreads) still dominate, but as DVOL continues to compress, their profit margins are narrowing, resulting in diminished cost-effectiveness.
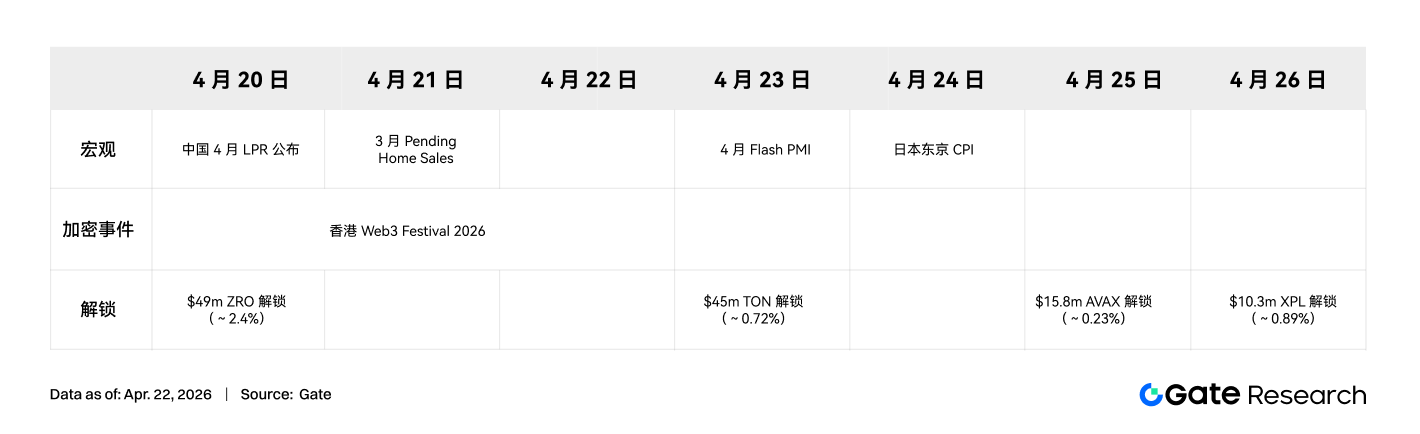
5. This Week's Outlook
Data Sources
• Investing, https://investing.com/currencies/xau-usd-historical-data
• Gate, https://www.gate.com/trade/BTC_USDT
• CMC, https://coinmarketcap.com/real-world-assets/?type=all-tokens
• Coinglass, https://www.coinglass.com/pro/depth-delta
• Dune, https://dune.com/gateresearch/gate-tradfi#weekly-volume
• Dune, https://dune.com/gateresearch/gate-institutional-weekly-report
• Bybit, https://www.bybit.com/future-activity/en/tradfi
• Bitget, https://www.bitgettradfi.com/tradfi/XAUUSD
• CryptoQuant, https://cryptoquant.com/asset/btc/chart/derivatives
• Amberdata, https://pro.amberdata.io/options/deribit/btc/current/
Gate Research Institute is a comprehensive blockchain and cryptocurrency research platform providing readers with in-depth content, including technical analysis, hot insights, market reviews, industry research, trend predictions, and macroeconomic policy analysis.
Disclaimer
Investing in the cryptocurrency market involves high risks. It is recommended that users conduct independent research and fully understand the nature of the assets and products being purchased before making any investment decisions. Gate assumes no responsibility for any losses or damages arising from such investment decisions.
免责声明:本文章仅代表作者个人观点,不代表本平台的立场和观点。本文章仅供信息分享,不构成对任何人的任何投资建议。用户与作者之间的任何争议,与本平台无关。如网页中刊载的文章或图片涉及侵权,请提供相关的权利证明和身份证明发送邮件到support@aicoin.com,本平台相关工作人员将会进行核查。


