Hello, students, I am Qinglan. Today, let's analyze the Bitcoin market. Using my own TPV three-point validation trading system, we will dissect the market thoroughly, filled with practical insights. Everyone, get your notebooks ready; let's get started.
Step 1: First, look at the overall direction (Multi-period trend overview)
Let’s first check the conditions of each period to understand the general situation.
Daily: This is our overall direction; it is currently in a bullish arrangement. MA5 is at 77808.87, MA10 is at 76778.70, MA30 is at 72415.60, and the price is at 77546.5, just slightly below MA5. Although the price shows a slight pullback, the moving averages are still bullish, indicating that the larger trend is intact. The on-chain fear and greed index is only 33, which indicates "fear," somewhat diverging from the strength observed in the daily chart, showing that market sentiment is cautious, not overly enthusiastic about buying. The total market capitalization is 2.66 trillion, with a slight drop of 0.19% in 24 hours, indicating that funds have not fled the market but neither have they aggressively entered.
4-hour: The trend is somewhat entangled, with moving averages MA5, MA10, and MA30 at around 77502.81, 77579.89, and 77571.55, all tightly intertwined. The price is at 77546.5, swaying within this tangled web. This suggests that at the 4-hour level, there is no clear direction, and it is in a phase of consolidation. The fear and greed index remains low, indicating that this consolidation is accompanied by fearful sentiment, not the kind of build-up for an upward momentum.
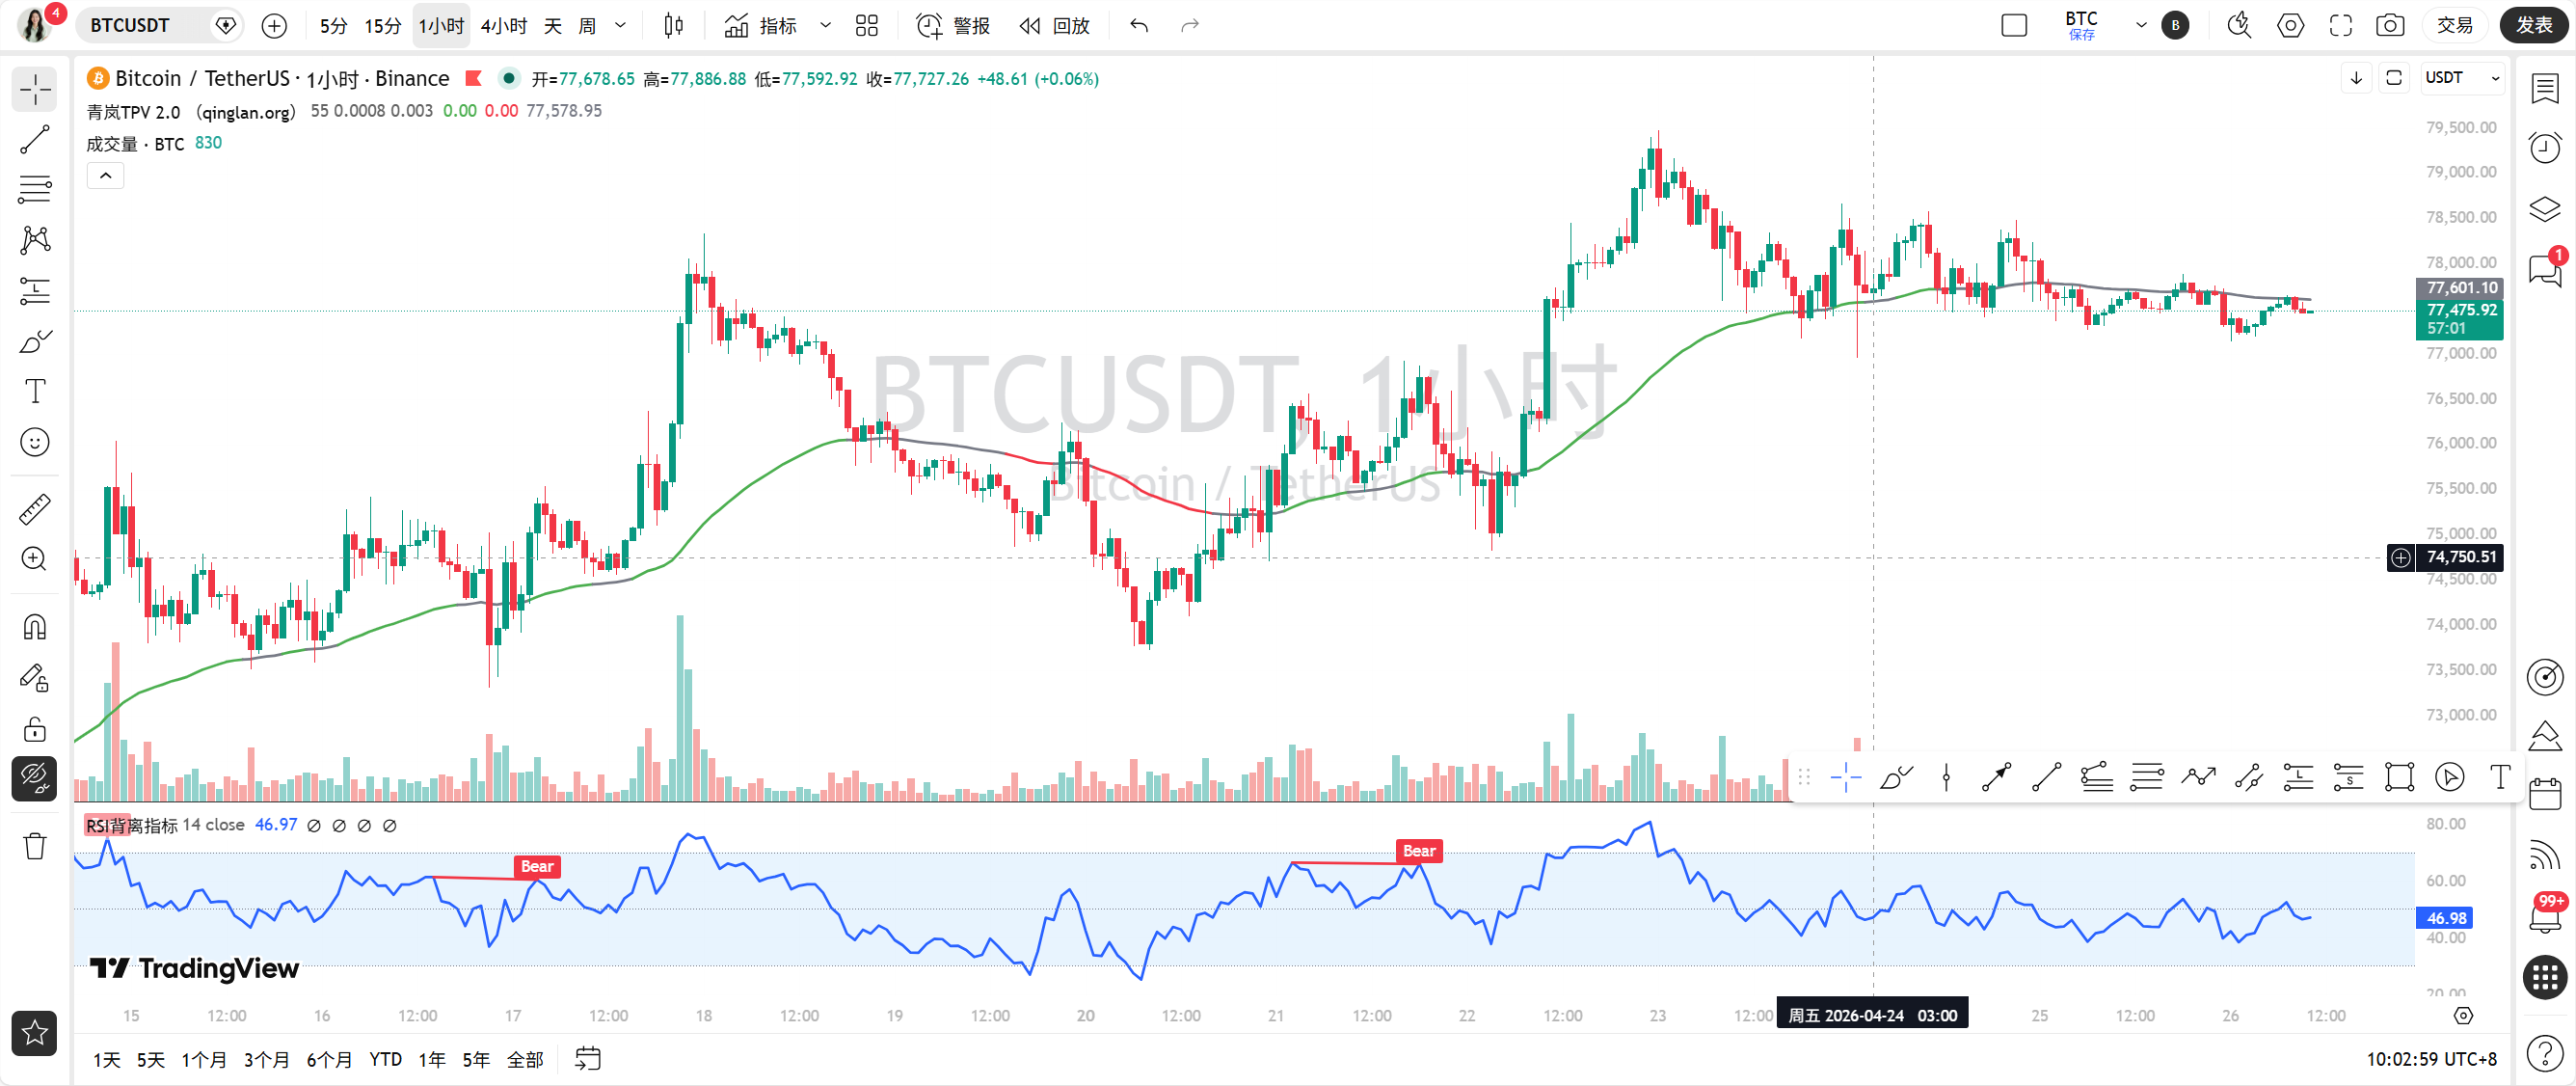
1-hour: Similar to the 4-hour situation, the moving averages are also mixed, with MA5 at 77551.35, MA10 at 77452.19, and MA30 at 77534.20, and the price is in this vicinity. Although the MACD histogram has turned positive, the DIF remains below the DEA, indicating that momentum is weak. Recent news has mentioned "BTC fluctuating in a narrow range around 77556 dollars," which is completely consistent with what we see on the chart, showing that the market is waiting for news.
15-minute: The moving averages are intertwined as well, with MA5 at 77523.36, MA10 at 77541.67, and MA30 at 77474.03, and the price is at 77546.5, entirely enveloped by the moving averages. The MACD histogram is green, indicating weak momentum. This period exhibits typical disorganized fluctuations, suitable for traders looking for very short-term opportunities, but we must look at the larger trend from the above periods.
Step 2: Find support points, draw key lines (Effective highs and lows + Trend Lines)
Let’s identify the key battlefields, which are those validated effective highs and lows in the market.
Daily: The most recent effective high is at 78178.23 (closing price on April 25), and the effective low is at 73801.79 (closing price on April 21). These two points have been confirmed by subsequent candlesticks, indicating significant support and resistance. From the daily perspective, the price rebounded from 73801.79 to 78178.23, and is now pulling back to 77546.5, which is a normal adjustment.
4-hour: The effective high is at 79272.9 (closing price on April 24), and the effective low is at 73801.79 (closing price on April 21). The upward trend line from 73801.79 to 79272.9 currently suggests that the support level is around 77500, which the price has touched multiple times, confirming its validity. The news mentioning "nearing US-Iran negotiations" and "BTC ETF seeing net inflows for nine consecutive days" serves as significant support for this rebound towards 79272.9.
1-hour: The effective high is at 78429.73 (closing price on April 25), and the effective low is at 75023.43 (closing price on April 23). The short-term trend line supports the range of 77400-77500, with the price testing this area multiple times, indicating strong support here.
15-minute: The effective high is at 78429.73, and the effective low is at 77245.77 (the lowest price on April 26). This low point has been confirmed by subsequent candlesticks, indicating that 77245.77 is an important defensive level in the short term.
Step 3: Indicators provide assistance (Technical indicators validation)
We will use indicators to validate the reliability of these support points and trend lines.
Daily: The MACD’s DIF is 2040.05, DEA is 1854.78, and the histogram is positive at 185.27, showing that bullish momentum is still there, but the histogram has somewhat shortened, indicating that the upward strength is weakening. The RSI is 71.65, close to the overbought zone but not yet there, indicating that there is still room for upward movement, although caution is needed when chasing highs.
4-hour: The MACD’s DIF is 169.24, DEA is 296.01, and the histogram is negative at -126.77, indicating the release of bearish momentum after a death cross, consistent with the price’s oscillation and pullback trend. The RSI is 47.66, neutral to weak, confirming the 4-hour level adjustment.
1-hour: The MACD’s DIF is -42.31, DEA is -63.40, and the histogram is positive at 21.10, indicating a golden cross below the zero axis, but it has not yet moved above zero, signifying a weak rebound. The RSI is 45.10, neutral to weak, indicating that the rebound strength is not strong.
15-minute: The MACD’s DIF is 19.59, DEA is 23.50, and the histogram is negative at -3.91, indicating a death cross above the zero axis, with very weak momentum. The RSI is 48.95, neutral. There is no obvious divergence among the indicators, just oscillation.
Step 4: Bull vs. Bear showdown (News + On-chain)
Let’s examine the news and on-chain data to see whether they favor bulls or bears.
News:
Bullish factors:
BTC ETF seeing net inflows for nine consecutive days, which is genuine capital entering the market and supports the price.
Trump has expressed support for cryptocurrencies, stating that "the president has a duty to ensure their success," which is a long-term positive factor.
US-Iran negotiations approaching, easing geopolitical tensions and reducing risk aversion, benefiting risk assets.
Bearish factors:White House Correspondents’ Dinner shooting incident, while Trump is safe, it will trigger market panic and uncertainty in the short term.
TRUMP team wallet sell-off leading to a price drop of 18%, indicating that project leaders are cashing out.
Brazil banning forecasting platforms, raising concerns about tightening regulations.
Core factor: In the short term, US-Iran negotiations and ETF capital inflows are supportive, but the White House shooting incident is an unexpected bearish trigger that the market needs to digest. In the short term, the technical and news aspects are somewhat divergent, with the news leaning bearish, but technically it is near support levels.
On-chain data:
Fear and greed index at 33 (fear), BTC dominance at 58.15%, total market capitalization at 2.66 trillion, 24-hour trading volume not provided. Market sentiment is fearful, but there has not been a significant outflow of funds, indicating a wait-and-see state. The technical aspect is oscillating near support, and on-chain data is also cautious, both resonating in anticipation of direction.
Step 5: The path of least resistance (Trading strategy)
In summary, the current bull and bear forces are balanced, but the overall direction on the daily level is still bullish, so our trading approach should primarily focus on low buys and avoid chasing highs.
Current trading direction: Low buy.
Key entry area: 77400-77500 range, which is the support region of the 1-hour and 4-hour trend lines and has been confirmed through multiple tests.
Stop loss basis: Set a stop loss below 77245.77 (15-minute effective low point); if broken, the short-term bullish structure will be compromised.
Target areas: The first target is 78178.23 (daily high), the second target is 78429.73 (1-hour high), and the third target is 79272.9 (4-hour high).
Step 6: Today's market outlook (Market prediction)
Current (within a few hours): The ultra-short-term will oscillate in the small range of 77400-77800, awaiting news stimuli.
Today and recent key: The most important support level is the 77400-77500 range, while resistance levels are 78178.23 and 78429.73. We need to pay close attention to whether the 4-hour trend line support is effective.
Trading mindset: The only trading direction today is low buy. Reason: The daily chart shows a bullish arrangement, the price is pulling back to key support levels, on-chain funds are not fleeing, and despite some disturbances in the news, ETF funds are flowing in, making the cost-effectiveness of buying at the support level high.
Summary: The current market's core contradiction is the game between the larger bullish trend and the bearish short-term news and fearful market sentiment.
Trading insight: The market is like a White House dinner; after the shots, some panic and leave, while others calmly position themselves. The real opportunities are often hidden in the shadows of fear.
[Qinglan's Personal Opinion]
Students, when we trade, the biggest fear is being led by emotions. The market is currently fearful, but if we look at the data, ETF funds are flowing in, and the overall trend is intact, indicating that this fear might present an opportunity. Of course, I'm not saying to go all in now, but at key support levels, we can afford to be a bit bolder, while protecting ourselves with stop losses. Remember, trading is not gambling; it's a probability game. Our TPV system has a backtest accuracy of 71.1%, which helps us trade in the direction of higher probability, risking small losses for greater rewards. Don't fear oscillation; it's the cash machine for us retail traders.
This TPV system is something I've refined over the years of observing the market, reviewing, and practicing. I can’t guarantee 100% accuracy, but at least it gives us more confidence at critical levels. If you want to receive the latest entry opportunities captured using the TPV system first-hand, feel free to visit the official Qinglan crypto class website at www.qinglan.org
免责声明:本文章仅代表作者个人观点,不代表本平台的立场和观点。本文章仅供信息分享,不构成对任何人的任何投资建议。用户与作者之间的任何争议,与本平台无关。如网页中刊载的文章或图片涉及侵权,请提供相关的权利证明和身份证明发送邮件到support@aicoin.com,本平台相关工作人员将会进行核查。