Cryptocurrency Academic: The consolidation of Bitcoin at 4.27 is coming to an end and a unilateral market is about to begin. The critical point of the cycle's recurrence is approaching! Latest market analysis and trading suggestions
The current price of Bitcoin is 78100. Should I chase the rise or short? I found that many cryptocurrency friends lose not because of their skills, but because they can't even distinguish the most basic support and resistance, repeatedly getting reaped by chasing highs and cutting losses! Today, I will still analyze the current trend of Bitcoin, from trend analysis to precise entry points for long and short positions, and to the life-saving stop-loss levels, explaining it all clearly in one go! Beginners can directly copy the work, and veterans can use it to verify their thoughts. After reading this, you won't have to panic in your next operation!
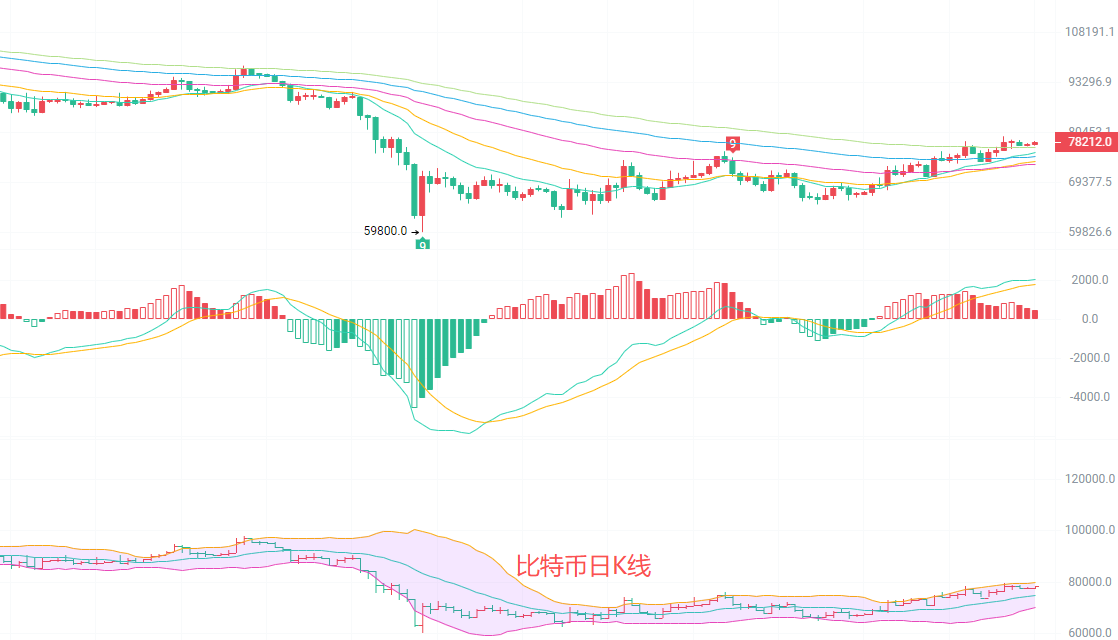
The daily K-line is in a phase of rebound consolidation, with prices fluctuating in the range of 74000-79600. EMA15 and EMA30 continue to move upwards, forming strong support for the price. The MACD indicator shows that DIF and DEA are above the zero axis, and the red bars continue to shorten, indicating that the upward momentum is gradually fading, and there are signs of entering a consolidation adjustment. The middle track of the Bollinger Bands is continuously moving upwards, with prices closely adhering to the middle track. There is obvious resistance near the upper track at 79662. If it cannot effectively break through in the short term, it is highly likely to fluctuate repeatedly within the range. The downward strong support level is at 72000, and falling below this level will end the rebound trend.
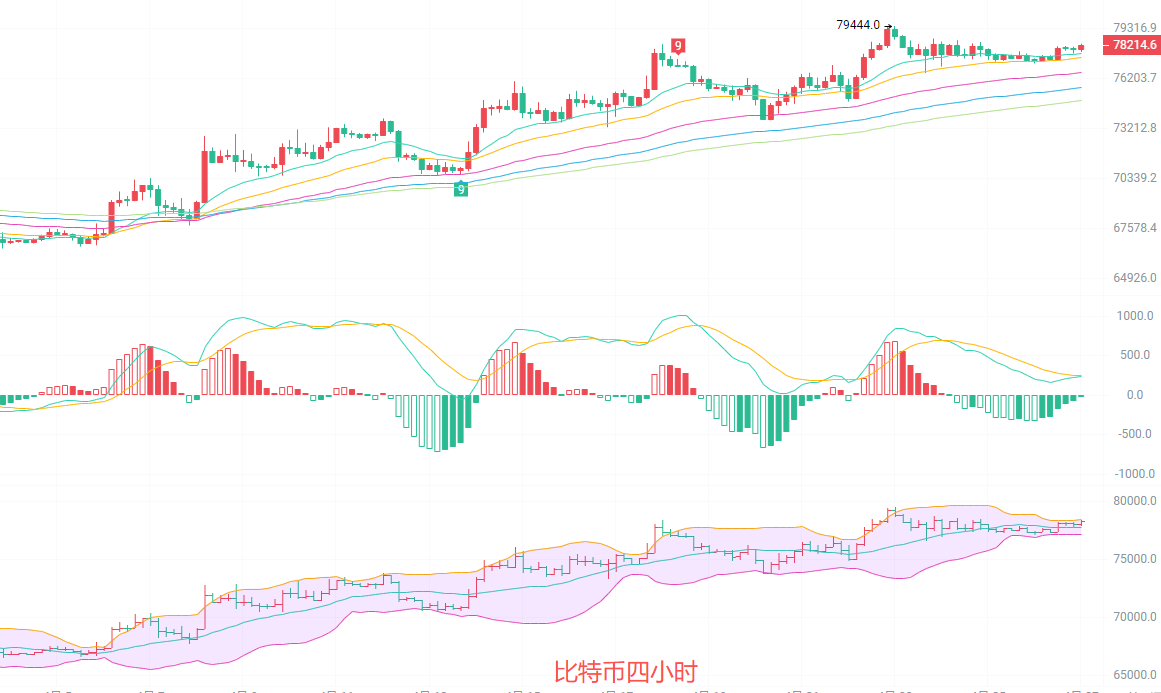
The four-hour K-line is fluctuating at the upper edge of the ascending channel. EMA15, EMA30, and EMA60 are arranged upwards, with prices running along the moving averages. The recent high of 79444 is a key resistance level. The MACD indicator shows that DIF and DEA are operating above the zero axis, and the red bars continue to shorten, indicating that the upward momentum is significantly weakening and there is a demand for a pullback correction in the short term. The Bollinger Bands have slightly narrowed, with prices fluctuating between the middle and upper tracks. There is short-term resistance near the upper track at 78407, and the lower track at 77110 is an important support level. The current price is above the middle track, and as long as it does not fall below the middle track, the upward trend remains in place.
Short-term strategy reference: Follow the big cycle trend, small stop-loss, quick entry and exit
For an upward movement from 77000 to 77300, stop-loss at 76600, targets at 78800 to 79500
For a downward movement from 79300 to 79600, stop-loss at 80000, targets at 78500 to 77500
Specific operations should be based on real-time market data. For more details, please consult the author. There may be delays in article release, and suggestions are for reference only, with risks borne by readers themselves.

Kind reminder: The above content is solely created by the author of the public account. Advertisements at the end of the article and in the comments section are unrelated to the author. Please discern carefully. Thank you for reading.
免责声明:本文章仅代表作者个人观点,不代表本平台的立场和观点。本文章仅供信息分享,不构成对任何人的任何投资建议。用户与作者之间的任何争议,与本平台无关。如网页中刊载的文章或图片涉及侵权,请提供相关的权利证明和身份证明发送邮件到support@aicoin.com,本平台相关工作人员将会进行核查。