Wave Riding in the Currency Sea: 4.27 Bitcoin (BTC) Market Analysis Reference:
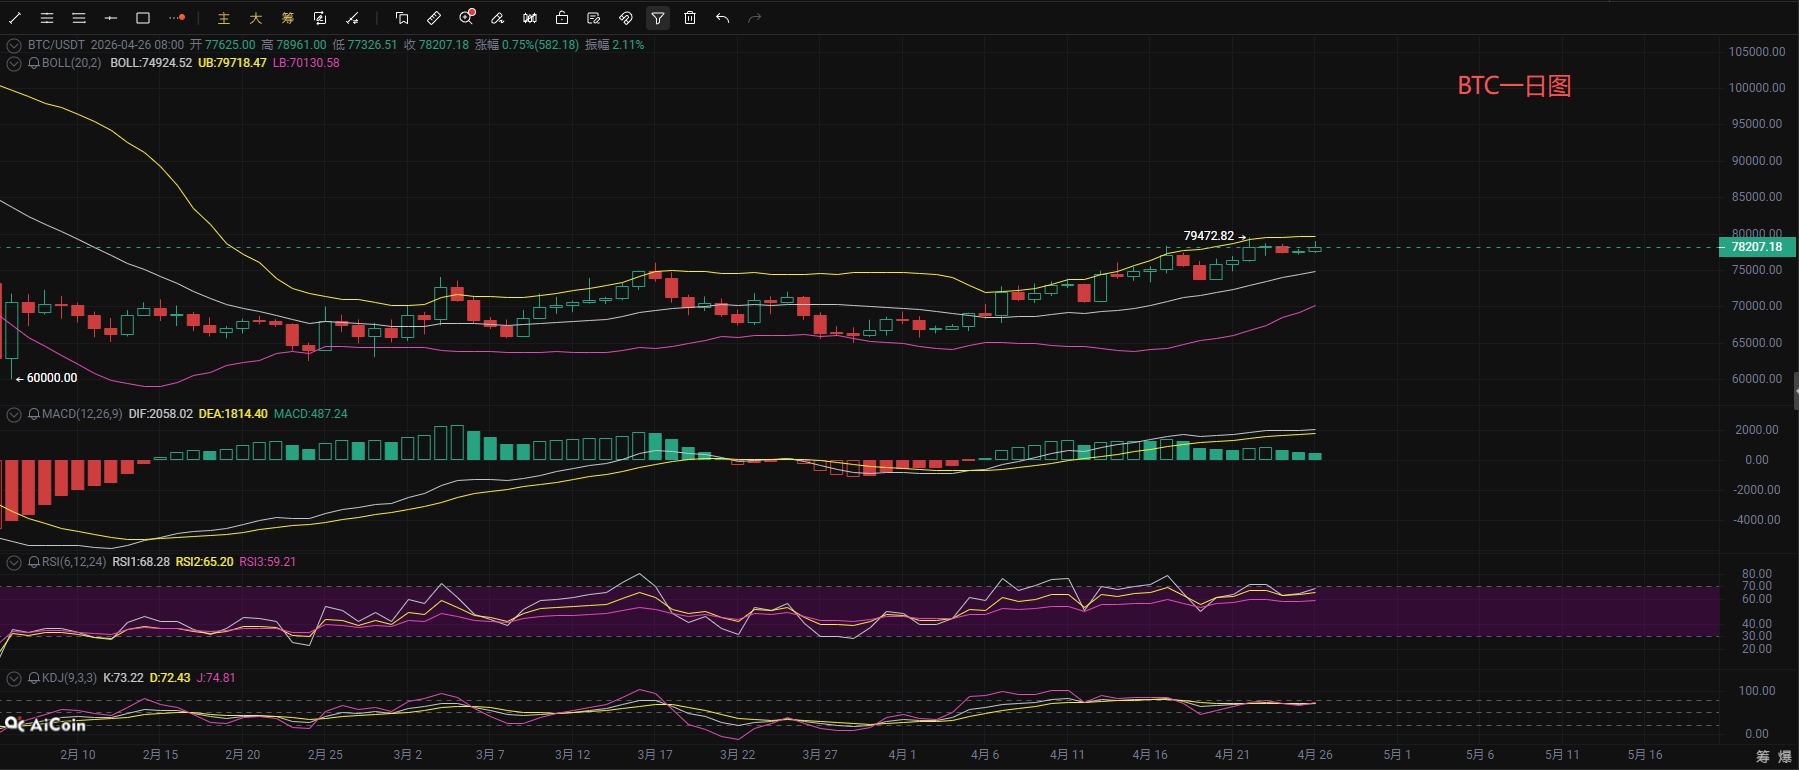
Bitcoin's daily chart is in a consolidation phase after rising, with prices consistently operating above the middle band of the Bollinger Bands. The middle band and EMA20 moving average forms strong support around 75000, while the upper band and previous high create a short-term pressure zone; the lower band and middle band are moving upwards together, with the upper band slightly pressured, indicating that the support for the mid-term upward trend is still rising, while the upward momentum is somewhat contracting. In terms of MACD, DIF and DEA remain in the bullish area above the zero axis. Although the histogram has been shrinking, there is no dead cross signal appearing, indicating that while bullish momentum has weakened, it has not reversed; the RSI and KDJ indicators are oscillating in the mid-high range and have not entered a seriously overbought state, overall indicating a strong consolidation mode. As long as the price does not effectively fall below the support of the Bollinger middle band and EMA20, the upward trend at the daily level will continue.
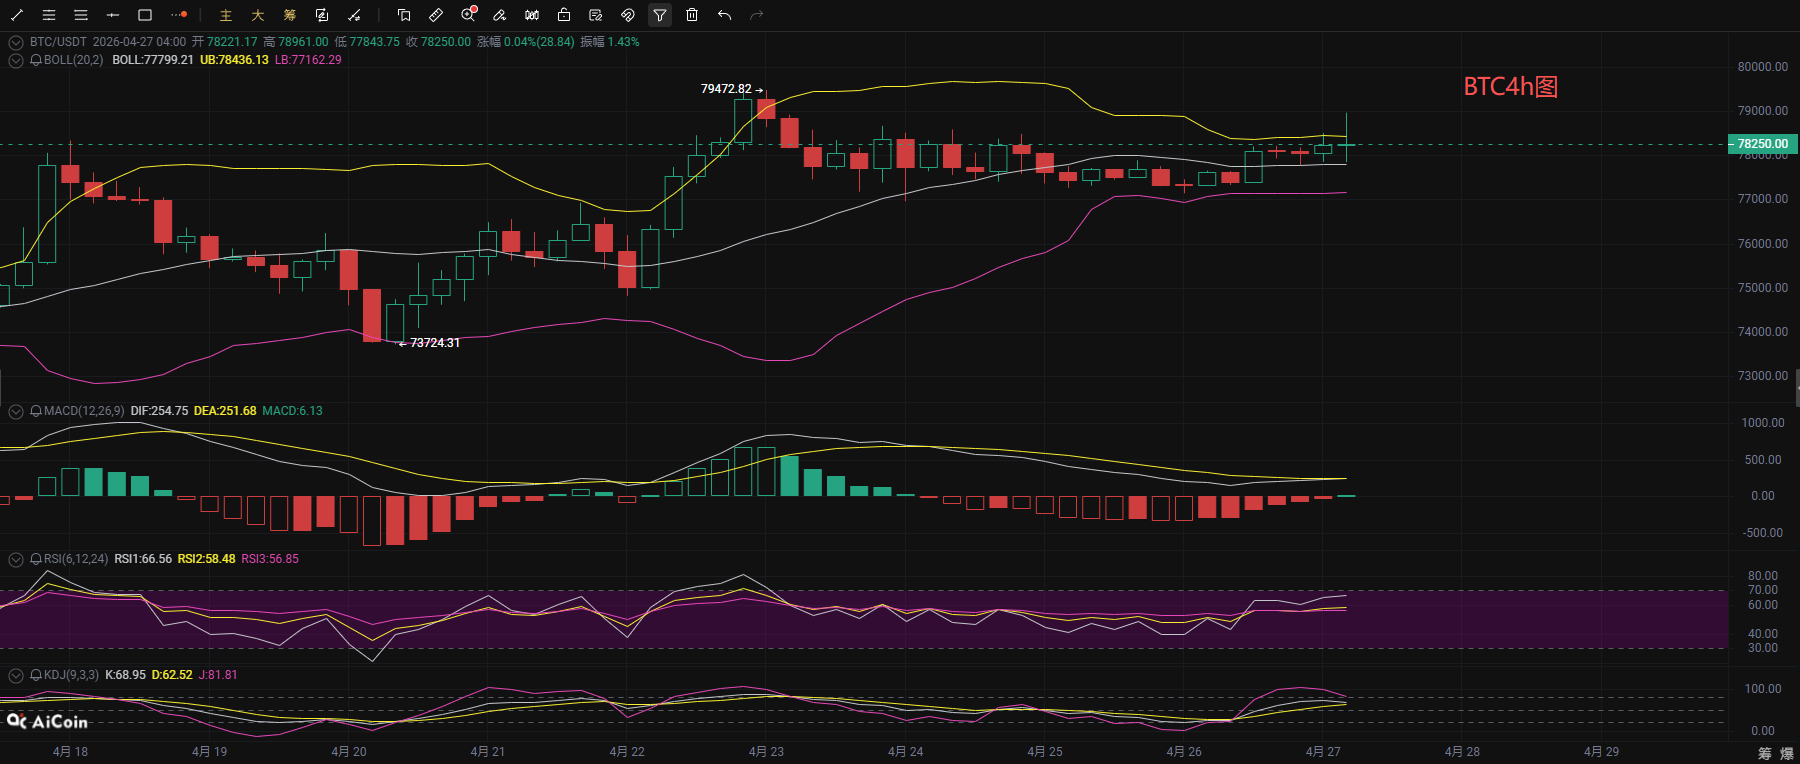
From the short-term 4-hour chart observation, BTC is currently in a correction phase after a high rebound, with prices touching the upper band of the Bollinger Bands again. The middle band of the Bollinger Bands is slowly moving up, and the overall channel remains good; the MACD fast and slow lines have a golden cross forming above the zero axis, with the histogram turning positive, indicating a recovery of short-term bullish momentum; the RSI indicator has risen to around 75, and the J line of the KDJ indicator has approached the overbought range, showing that short-term upward momentum is being released, with a demand for a technical pullback; the pressure above is concentrated near the previous high, and the support is around the Bollinger middle band at 77800. If it cannot break through the previous high, it is likely to oscillate between the upper and lower bands of the Bollinger Bands to digest the overbought indicators. The operation should be treated with a fluctuation mindset, with light positions at key locations, and not blindly chasing highs or lows.
Wave Riding in the Currency Sea: 4.27 Bitcoin Short-term Reference:
Long Position: Buy in the range of 76800-77500, stop loss at 500 points, target at 78000-79000,
Short Position: Sell in the range of 79500-78800, stop loss at 500 points, target at 78000-77500,
【The above analysis and strategies are for reference only. Please bear the risk yourself. There may be delays in the publication of the article or the strategy, and it does not possess timeliness. Do not operate blindly】

This content is originally shared by 【Wave Riding in the Currency Sea】 and represents personal opinions only. There may be delays in sending the article, for reference only, and do not operate blindly! Want to get more daily real-time orders? Then follow my official account! Here, you can learn online market analysis techniques and understand knowledge related to exiting positions. I have years of research experience in the market, focusing on major trends in the cryptocurrency world. Mainly responsible for analyzing and guiding investment operations in BTC, ETH, SOL, BCH, and other coins. Welcome to study and learn together.
免责声明:本文章仅代表作者个人观点,不代表本平台的立场和观点。本文章仅供信息分享,不构成对任何人的任何投资建议。用户与作者之间的任何争议,与本平台无关。如网页中刊载的文章或图片涉及侵权,请提供相关的权利证明和身份证明发送邮件到support@aicoin.com,本平台相关工作人员将会进行核查。