Dear friends, I am Qinglan. Today, the market sentiment has shown a clear warming, with the crypto fear index rising from 26 to 39. Although it is still in the fear zone, the sentiment has significantly eased, which often means short-term selling pressure is weakening, and buying is starting to tentatively enter the market. At the same time, multiple on-chain data and technical signals point to Bitcoin's target aiming at $80,000, with a surge in spot buying and an uptick in the futures market creating a resonance. These two pieces of news combined indicate that the market is brewing a rebound after experiencing previous panic. However, everyone should be clear that a fear index of 39 is still not in the optimistic zone, and the sustainability of the rebound requires more funds for confirmation.
Current Price and Time
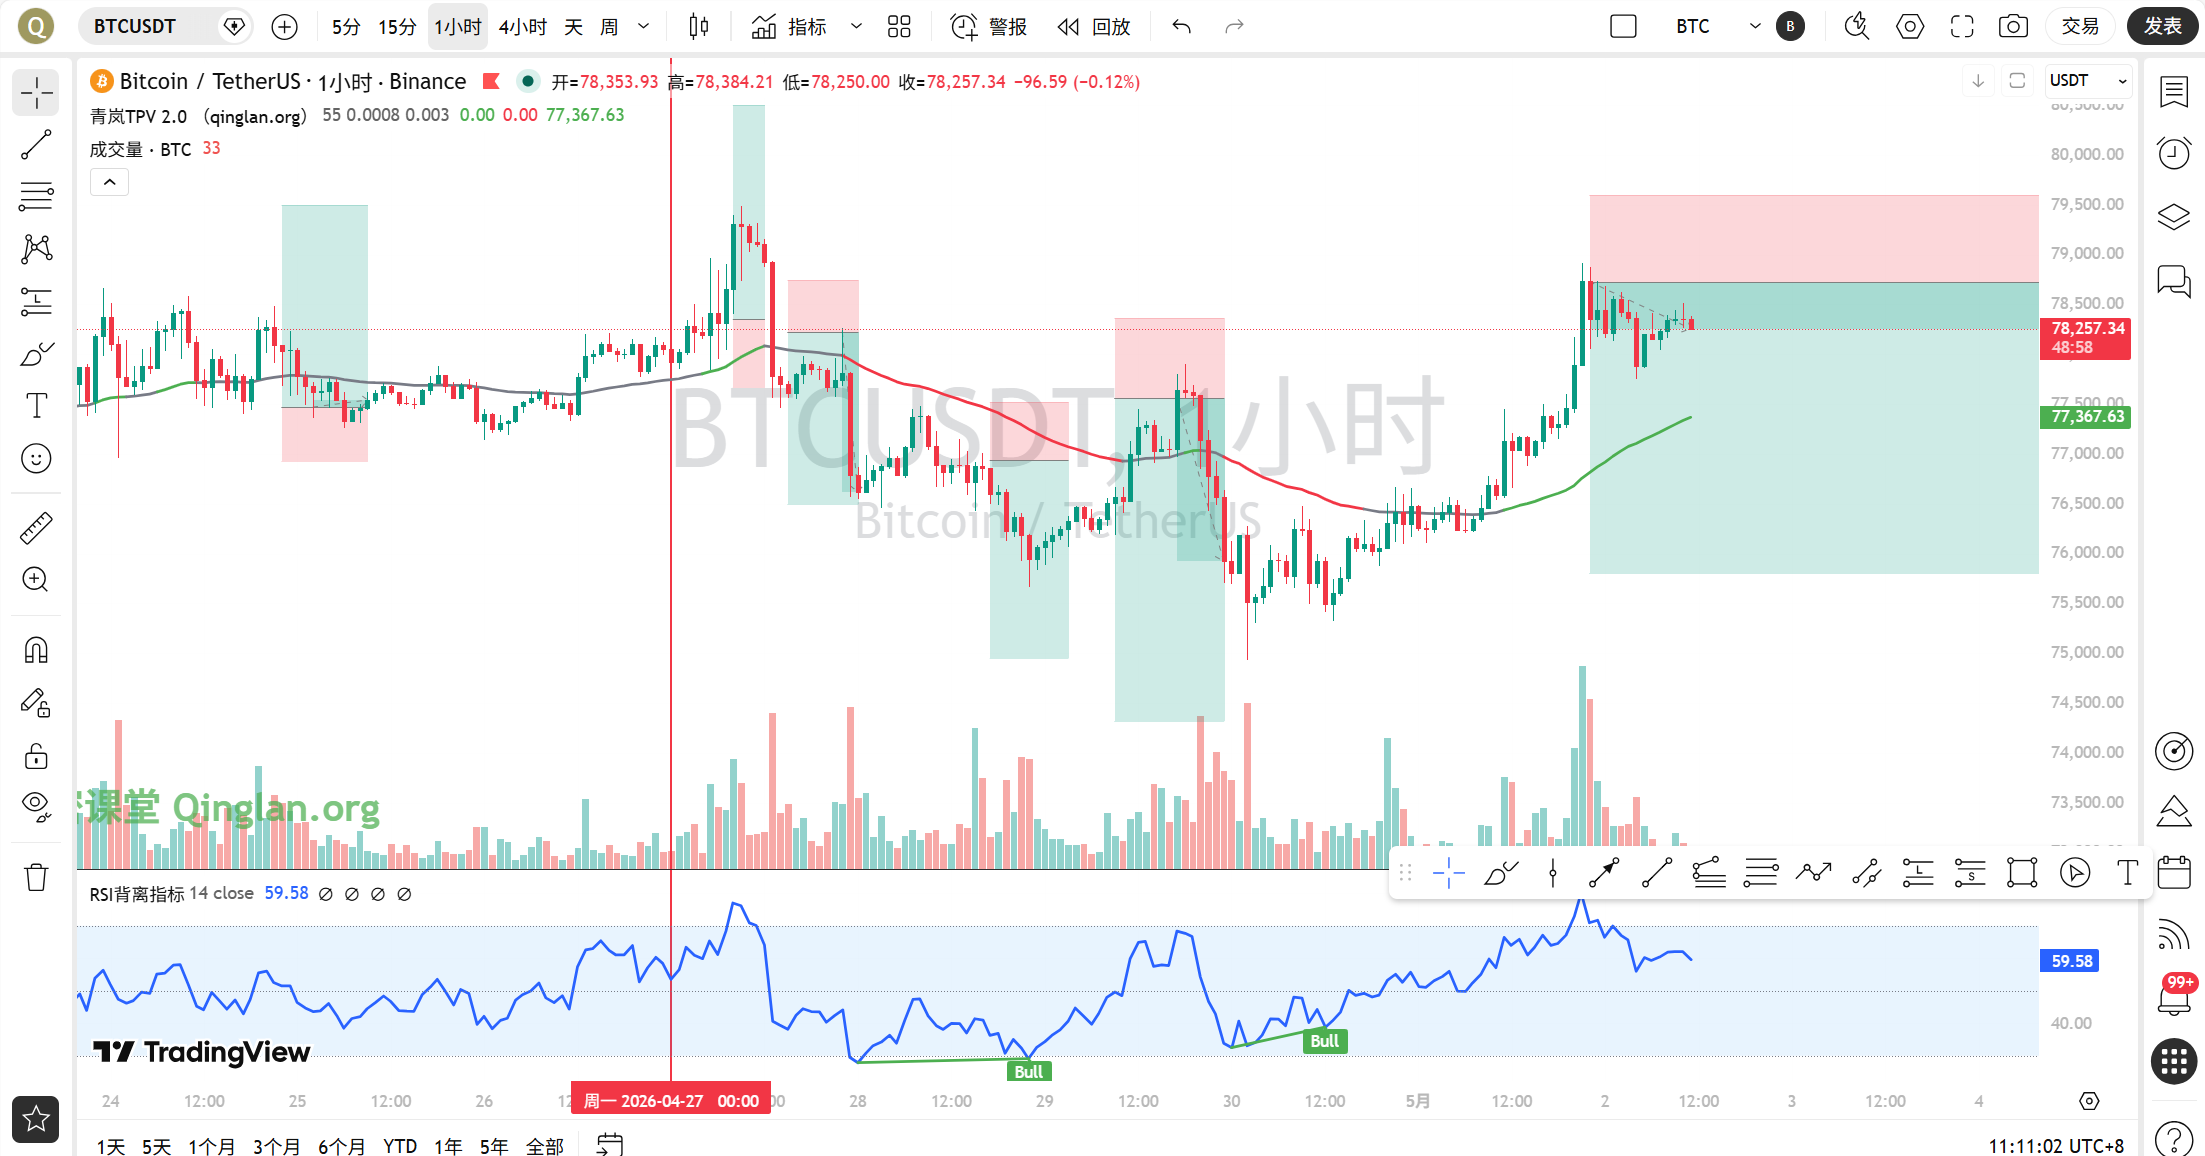
The current time is May 2 at 11:10 AM, and the latest quoted price for Bitcoin is 78,295 USDT, with a 24-hour increase narrowing to 2.13%. The price has been repeatedly contested around the 78,000 level, which is the dividing line for short-term bulls and bears and a key point for market sentiment shifting from panic to cautious optimism.
Multi-Cycle Status Overview
First, let's look at the daily level: MA5 is at 76,999, MA10 is at 77,434, MA30 is at 74,448, and the current price of 78,295 has already stood above all short-term moving averages, which is a bullish signal. The MACD histogram is at -133.61; although it is still negative, the gap between the DIF line at 1587.61 and the DEA line at 1721.21 is narrowing, indicating that the downward momentum is diminishing. RSI is at 59.45, in a neutral to strong region, neither overheated nor oversold, leaving space for a rebound.
On the 4-hour cycle, MA5 is at 78,159, MA10 is at 77,429, MA30 is at 76,883, and the price is also stabilized above the moving averages. The MACD histogram is at 268.45, and the DIF line at 308.78 is far above the DEA line at 40.32, which is a typical bullish volume expansion pattern after a golden cross. However, RSI has reached 87.72, already entering the overbought area, indicating that the short-term increase is too fast and there is a risk of a pullback. This conflicting signal needs caution; overbought conditions on the 4-hour level often trigger volatility or pullback on the 1-hour level.
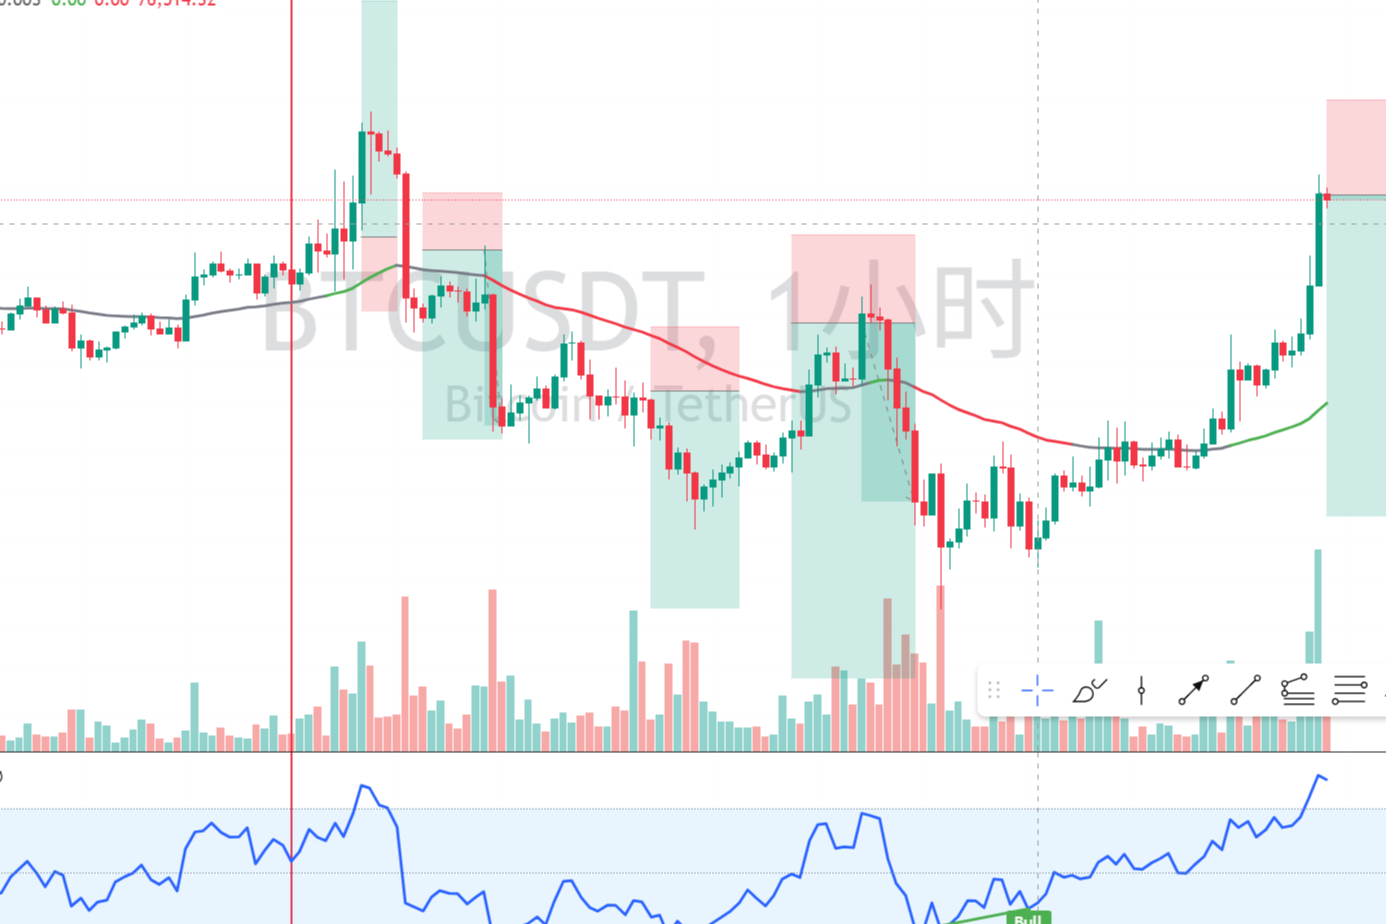
On the 1-hour cycle, MA5 is at 78,315, MA10 is at 78,259, MA30 is at 77,666, and the price is running above the moving averages. The MACD histogram is at -49.23, with the DIF line at 357.39 below the DEA line at 406.62, in a bearish cross state, indicating that bullish momentum at the hourly level has weakened. RSI is at 40.54, in a neutral to low position, with no extreme signals.
On the 15-minute cycle, MA5 is at 78,314, MA10 is at 78,336, MA30 is at 78,223, and the price is oscillating narrowly around the moving averages. The MACD histogram is at 3.10, with the DIF line at 32.90 slightly above the DEA line at 29.80, representing weak bullishness after a golden cross. RSI is at 64.11, in a neutral to strong position.
Overall, the daily and 4-hour cycles are bullish, but the 1-hour and 15-minute cycles show signs of weakening momentum, creating contradictions between multiple cycles. In this structure, the continuity of the trend requires more confirmation, and one should not blindly chase long positions.
TPV Signal Verification
According to the Qinglan TPV system, we use the 1-hour EMA55 as the dividing line for bulls and bears. The current EMA55 value is 77,335.85, and the price of 78,295 is far above this line, belonging to the bullish trend area.
First, let's look at oscillation judgment auxiliary data. In the past 8 1-hour candlesticks, the closing price was greater than EMA55 8 times and crossed it 0 times. The current price's absolute distance from EMA55 is 1.24%. This does not meet the oscillation threshold conditions, indicating that the market is in a one-sided trend, not in a range-bound market, allowing one to actively look for trading opportunities.
Now verify the conditions for going long. First, the price is stabilized above the 1-hour EMA55, with the closing prices of 2 consecutive 1-hour candlesticks above EMA55. From the data, the last 8 candlesticks all closed above EMA55, and this condition is fully satisfied. Second, support is stabilizing. The current price rebounded after repeatedly testing around 78,000; this position is a previous area of high trading volume and provides support. However, it is necessary to observe whether there are specific formations such as long lower shadows or bottom formations; currently, there are small stabilization signs on the 15-minute chart, but they are not strong enough. Third, downside momentum is declining. Although the 1-hour MACD histogram is negative, the trend of continuous periods shortening is not obvious, and the RSI has rebounded from around 40, but the extent is limited. Overall, some of the conditions for going long are met, but the signal for momentum exhaustion is not clear enough.
Regarding the conditions for going short, the premise of price being pressured below the 1-hour EMA55 does not hold, as the price is far above EMA55, so the conditions for going short are not satisfied.
Therefore, the current signal given by the TPV system is bullish but lacks momentum, needing to wait for a clearer stabilization signal before entering the market.
On-Chain and Fund Aspects
In terms of on-chain data, the fear and greed index is 39. Although it has risen from 26 previously, it is still in the fear zone. Historically, when the fear index is below 40, the market is often in a bottom region, but rebounds require time. Bitcoin's market share is 58.51%, indicating that funds are still hedging in Bitcoin, while the liquidity of altcoins is relatively insufficient.
On the funding side, new wallets have withdrawn 1,051 BTC from Binance, worth 82.37 million dollars. Such a large withdrawal may suggest institutional accumulation or transfer; the short-term impact is unclear, but long-term it is positive. BlackRock deposited 26,000 ETH and 226 BTC into Coinbase, which could be for liquidity management, needing observation for short-term effects. The Ethereum Foundation has continued selling ETH, selling 20,000 ETH within two weeks, realizing 47 million dollars, which is bearish for ETH and may drag down overall market sentiment.
Overall, the on-chain data shows a mixed state of bulls and bears. Institutions are accumulating, but the foundation's selling and financing shrinkage (a sudden drop of 74% in April) indicate insufficient market confidence. In this environment, the sustainability of the rebound needs more funds for confirmation.
Key Attack and Defense Points
The first resistance above is in the 78,500-78,800 area, which is a previous small high point and near the upper band of the 4-hour Bollinger Bands. If broken, the next target is in the 79,500-80,000 range, which is a key position for market sentiment to turn optimistic. The first support below is in the 77,500-77,800 area, which is near the 1-hour EMA55 and also the dividing line for short-term bulls and bears. If broken, strong support below is in the 76,500-77,000 range, which is the daily MA30 and the area of previous lows.
Trading Strategy
Based on the current multi-cycle contradictory signals and the TPV system indication, I suggest adopting a cautious bullish strategy, waiting for a clearer entry signal.
Direction: Cautiously bullish, but need to wait for pullback stabilization.
Entry Conditions: Price pulls back to the 77,500-77,800 area, showing a long lower shadow or bottom formation, while the 1-hour MACD histogram shortens for 2 consecutive periods, and RSI rebounds from below 40. Upon meeting these conditions, one can try a small long position. If the price directly breaks through 78,800 and stabilizes, it can also chase long, but the risk is higher and strict stop-loss is needed.
Stop-Loss Level: After entering a long position, set the stop-loss at 77,200. If it breaks below the 1-hour EMA55 and cannot recover, it indicates that the bullish trend may end.
Target Level: The first target is 78,500-78,800, and the second target is 79,500-80,000. If the price reaches around 80,000, it is recommended to reduce holdings or close positions, as the 4-hour RSI is already overbought, and continuing to push upward requires new positive stimuli.
If the price breaks below 77,500 and cannot recover, then abandon the long idea and switch to watching or lightly shorting, but the bearish signals are currently unclear, so actively shorting is not recommended.
Risk Warning
The current market sentiment is fragile; a fear index of 39 means the rebound could falter at any time. Any bearish news may trigger a rapid pullback, so please strictly control your position and do not chase the rise with heavy investment.
Follow Qinglan’s Crypto Class to seize more trading opportunities! Welcome to visit the official website www.qinglan.org
📊 Qinglan TPV Trading Strategy Backtest Reference
🕒 Last Backtest Time 05-02 07:00:02
Total Analysis: 1239 Backtest: 1233 Accuracy: 69.3% (855/1233)
免责声明:本文章仅代表作者个人观点,不代表本平台的立场和观点。本文章仅供信息分享,不构成对任何人的任何投资建议。用户与作者之间的任何争议,与本平台无关。如网页中刊载的文章或图片涉及侵权,请提供相关的权利证明和身份证明发送邮件到support@aicoin.com,本平台相关工作人员将会进行核查。