Today, the two most noteworthy news items in the market are: one, a whale heavily invested $90 million in long positions for Bitcoin and Ethereum, with the liquidation price close at hand. This demonstrates the confidence of large holders in the market outlook but also exposes the risks under high leverage. The other news is that the Federal Reserve's interest rate path has shifted to neutral and may even discuss rate hikes, which puts pressure on risk assets. These two pieces of news, one bullish and one bearish, explain the current fluctuations of Bitcoin around $78,321. As Qinglan, I remind everyone that amidst macro uncertainty and on-chain capital strategies, trading strategies must be more cautious, and one should not blindly chase up or down.
Current Price and Time
The current time is May 2nd, 21:40, with Bitcoin priced at 78,321 USDT. The 24-hour increase is only 0.16%, and the market sentiment is in the fear zone, with a panic index of 39. The price hovers around $78,000, with short-term bullish and bearish forces balanced, but the technical indicators show that bulls are attempting to hold key support.
Multi-Timeframe Overview
From the daily perspective, MA5 is at 77,004, MA10 is at 77,436, and MA30 is at 74,449. The price is above all moving averages, but the MACD histogram is negative at -131.99, indicating weakening upward momentum. The RSI is at 59.52, in a neutral to strong area but not in overbought territory. Overall, the daily chart shows a fluctuating but slightly bullish pattern, lacking breakout momentum.
In the 4-hour timeframe, MA5 is at 78,262, MA10 is at 77,984, and MA30 is at 76,968, with the price above the moving averages. The MACD histogram is at 185.36, positive and widening, with DIF at 387.81 and DEA at 202.45, indicating enhanced bullish momentum. However, the RSI is high at 80.31, entering the overbought area, signaling short-term pullback risk. The 4-hour timeframe is currently the strongest timeframe, but overbought signals should not be ignored.
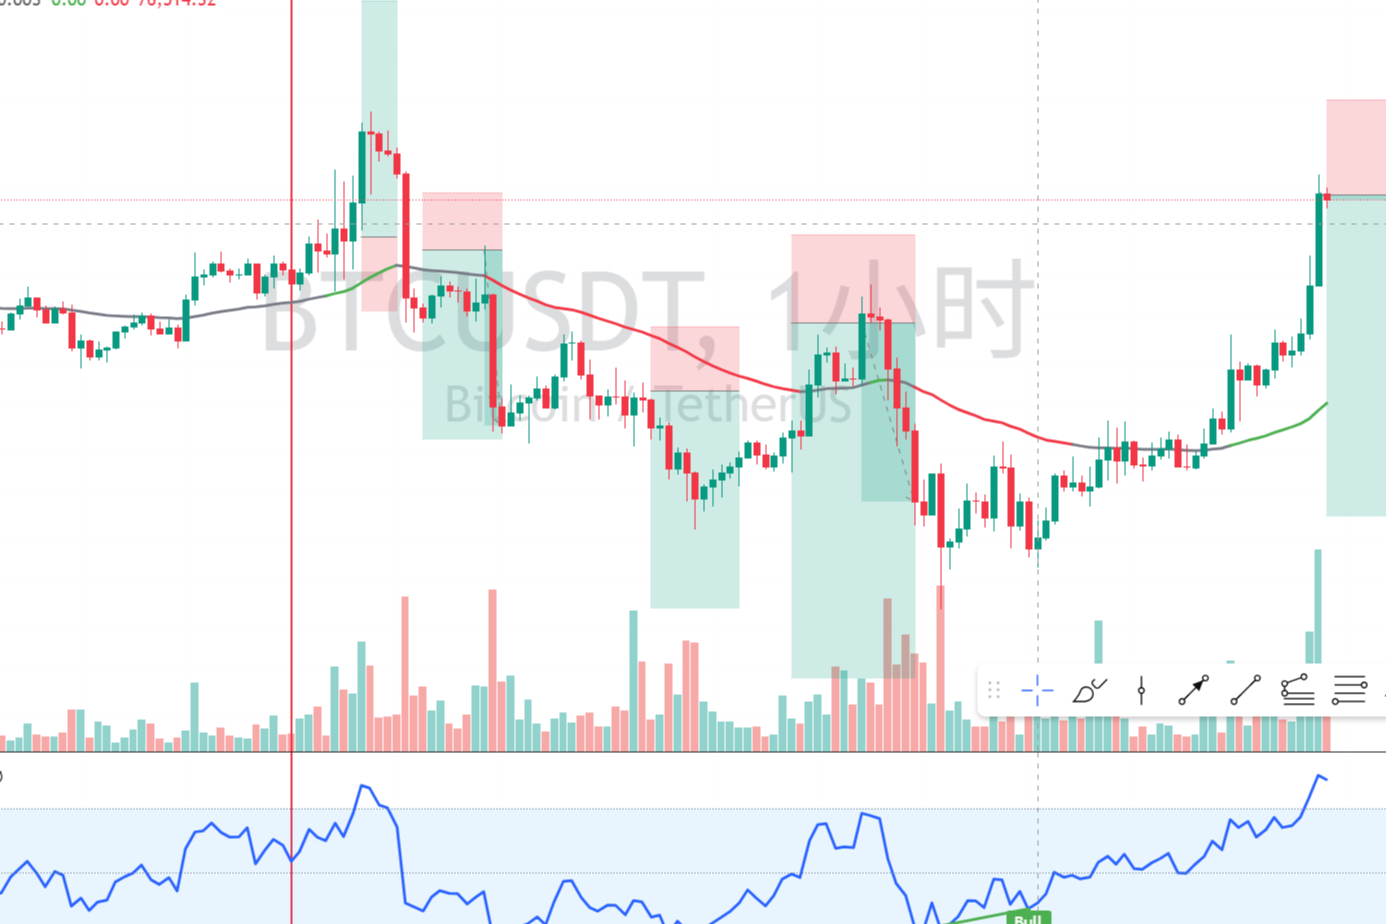
In the 1-hour timeframe, MA5 is at 78,243, MA10 is at 78,243, and MA30 is at 78,158, with the price fluctuating narrowly around the moving averages. The MACD histogram is at -62.27, negative and decreasing, with DIF at 176.30 and DEA at 238.57, indicating a death cross state but shortening histogram, suggesting weakening downward momentum. The RSI is at 54.05, neutral. EMA55 is at 77,642, and the current price of 78,321 is above EMA55, clearly indicating a bullish trend.
In the 15-minute timeframe, MA5 is at 78,291, MA10 is at 78,236, and MA30 is at 78,259, with the price above the moving averages. The MACD histogram is at 13.64, positive, with DIF at 7.33 and DEA at -6.32, in a golden cross state, indicating short-term bullish momentum. The RSI is at 52.51, neutral.
Overall, the multi-timeframe analysis shows a bullish arrangement, but the 1-hour and daily momentum are weakening, and the 4-hour timeframe is overbought, indicating potential short-term pullback or consolidation.
TPV Signal Verification
According to the Qinglan TPV system, we use the 1-hour EMA55 as the boundary for bullish and bearish positions. The current price of 78,321 is above EMA55 at 77,642, placing it in the bullish trend area. In the last 8 hourly candlesticks, the closing price has been above EMA55 8 times, with no crossings, and the price is 0.87% away from EMA55, not meeting the fluctuation threshold, indicating a unilateral bullish trend.
Long Position Conditions Verification: First, the price is firmly above the 1-hour EMA55, with the last 2 hourly closing prices above EMA55, meeting the condition. Second, support is stabilizing, with the current price above EMA55, though there has been no notable long lower shadow or bottom formation recently, requiring observation for pullback confirmation. Third, downward momentum is weakening, as the 1-hour MACD histogram, though negative, has been continuously decreasing, with RSI rebounding from lower levels, partially meeting the conditions. Overall, bullish signals are present, but a better entry point needs to be awaited.
Short Position Conditions are not met since the price is above EMA55, and there have been no consecutive closing prices below EMA55.
On-Chain Capital Situation
In terms of on-chain data, the fear and greed index rose from 26 to 39, showing a significant alleviation of sentiment but remaining in the fear zone, indicating that market confidence is recovering but not fully warming up. The Bitcoin ETF saw a net inflow of $162.8 million this week, with a single-day net inflow of $630 million for US Bitcoin ETFs, indicating substantial institutional inflow, which is a strong positive signal. The Coinbase Bitcoin premium index turned positive at 0.0037%, with US purchasing activity warming, providing short-term price support. However, crypto financing in April plummeted by 74% to $659 million, hitting a 14-month low, indicating insufficient confidence in the primary market, which is a long-term negative factor. Ethereum's mainnet transaction volume broke records in April, with increased network activity and strong ecological demand. Overall, short-term capital is leaning bullish, but the long-term financing contraction should be noted.
Key Support and Resistance Levels
Key resistance above is at $80,000, which is recognized as a vital psychological level in the market; a breakout could spark a short squeeze to $84,000. Key support below is at the 1-hour EMA55 of 77,642 and the daily MA10 of 77,436. If the price breaks below 77,436, it could further test the daily MA5 of 77,004 and the 4-hour MA30 of 76,968. The short-term fluctuation range is between 77,600 and 80,000.
Trading Ideas
Direction: Primarily bullish, but waiting for a pullback to enter.
Entry Conditions: If the price pulls back to around 1-hour EMA55, in the 77,600-77,700 area, and shows supportive stabilization signals such as a long lower shadow, bottom formation, or significant volume without falling further, while the 1-hour MACD histogram continues to shorten or RSI rebounds from lower levels, light long positions can be taken. If the price directly breaks above $80,000 and stabilizes, one can chase long positions with targets set at $82,000-$84,000.
Stop-Loss Levels: For long positions, the stop-loss is set at 77,200. If the price falls below the 1-hour EMA55 with two consecutive closing prices below EMA55, the bullish case is invalidated. For chasing long positions, the stop-loss is set at 79,500.
Target Levels: First target at $80,000, second target at $82,000, third target at $84,000. If the price encounters resistance near $80,000 and shows a top formation or long upper shadow, partial profit-taking can be considered.
Risk Warning: The 4-hour RSI is overbought, with a high short-term pullback risk. Avoid chasing highs and patiently wait for pullback confirmation.
Follow the Qinglan Crypto Classroom to seize more trading opportunities! Visit the official website www.qinglan.org
📊 Qinglan TPV Trading Strategy Backtest Reference
🕒 Last Backtest Time 05-02 07:00:02
Total Analysis: 1239 Backtest: 1233 Accuracy Rate: 69.3% (855/1233)
免责声明:本文章仅代表作者个人观点,不代表本平台的立场和观点。本文章仅供信息分享,不构成对任何人的任何投资建议。用户与作者之间的任何争议,与本平台无关。如网页中刊载的文章或图片涉及侵权,请提供相关的权利证明和身份证明发送邮件到support@aicoin.com,本平台相关工作人员将会进行核查。