Authors: @tradinghoex @0xBenniee
Translator: @0xBenniee
For the vast majority of users entering crypto, the only purpose of stepping into the cryptocurrency world is that it is one of the few places regular people can truly take control of their financial destiny. Most arrive for the "trades that change fate" and profit, not just out of love for the underlying technology.
But the problem is: the rules of this game are set to have only one winner, the market makers.
This article will thoroughly dissect how these manipulative tactics work, the tools you need to identify them in advance, and how to avoid becoming a "bag holder." All conclusions are based on real cases of manipulated tokens over the past seven months.
Two Scripts, Same Ending
Not all "criminal-style pumpings" operate according to the same process. After studying seven manipulated tokens over the past seven months, we identified two distinctly different patterns. Both rely on low-volume tokens on Binance, ultimately concluding with losses for retail investors/exchanges, but their underlying mechanisms for extracting funds are fundamentally different.
MYX: Squeeze Type Pump
Phase 1 — Setup
According to historical data from CoinMarketCap, the "big market" that pushed MYX to its final high of $19 started in late August 2025. At that time, it broke above $1.20 from below $0.10 and continued to rise to several dollars in the following weeks.
In-depth analysis of this round of increase shows that it was a carefully planned operation involving six wallets: they executed 2,240 small buy orders on PancakeSwap, accumulating a total of $3.92 million worth of MYX tokens, which were then consolidated into a deposit address at a centralized exchange.
Research on Arkham also found that during August to September 2025, multiple wallets systematically injected USDT into the MYX liquidity pool in a "rotating pattern":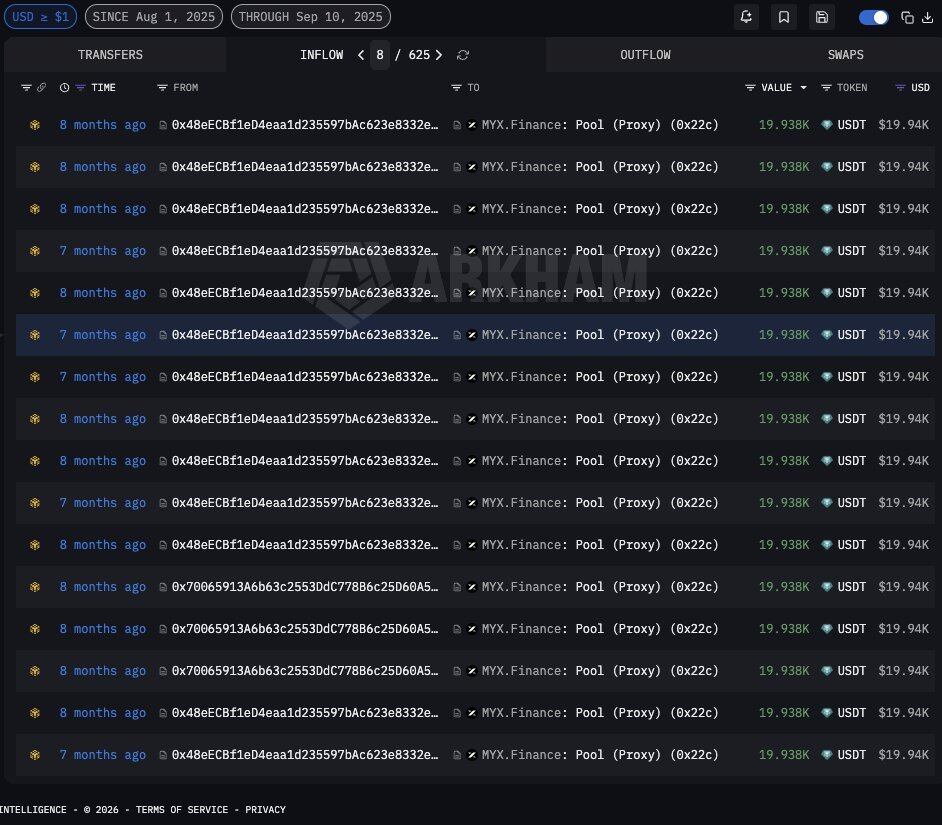
- One wallet injected in batches of $90,000–$108,000;
- The second wallet flowed in batches of $20,000–$67,000;
- The third wallet executed dozens of nearly identical injections of $19,938.
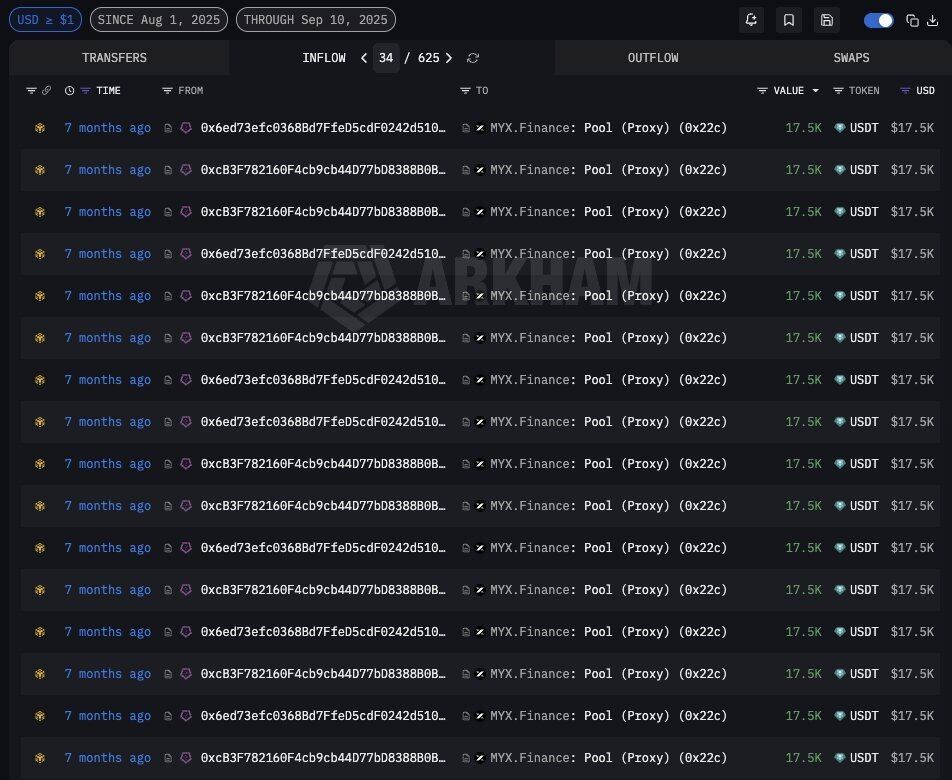
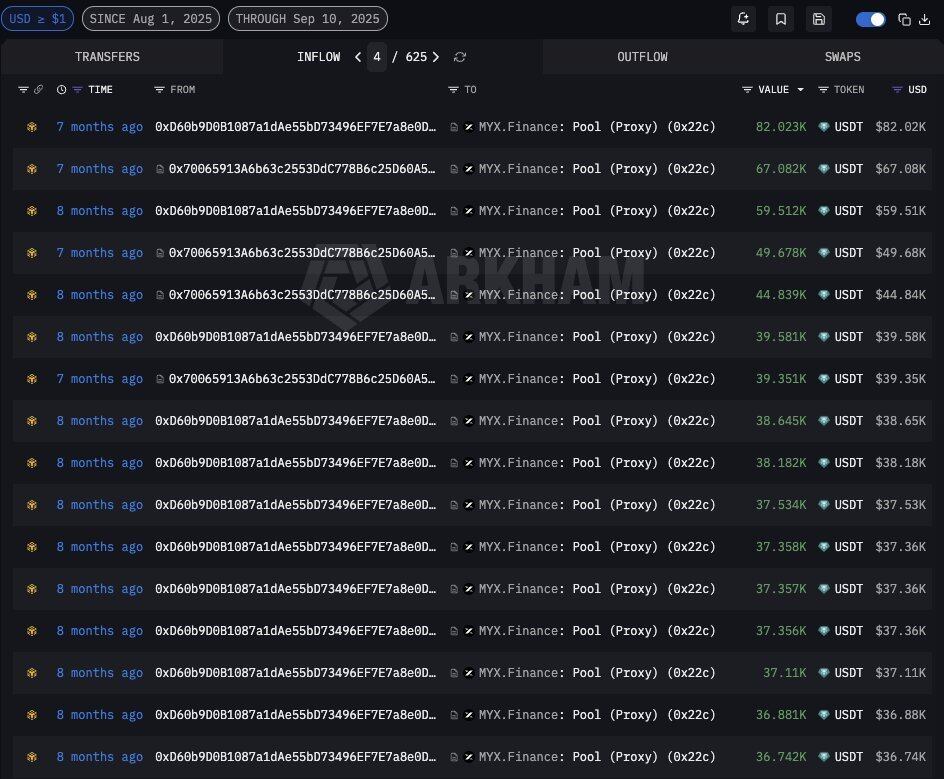
These wallets conducted multiple small purchases on-chain and shared wallets, controlling off-market circulating chips in advance of the pump while avoiding detection by large whales. Market makers completed control of the supply unnoticed during this covert accumulation phase, laying the groundwork for subsequent manipulation.
Phase 2 — Luring Shorts
Historical data from CoinGecko indicates that the price range for MYX in late July to early August 2025 was $0.10–$0.11:
- August 3: jumped to $0.168;
- August 4: surged to $0.398;
- August 5: reached $1.29 — up 1,190% in 5 days.
The unlocking of 39 million tokens happened right on August 6, at a price of $1.65, just in the middle of this round of initial surge.
This pump was deliberately made to look "unsustainable". Every cautious trader looking at the fundamentals would think the same thing upon seeing a low-market-cap token without users surge 1,550%: “Shorting this is a sure bet.”
In the following month (August 6 — September 6), MYX consolidated between $1.05–$2.00, touching $2.00 on August 16 before falling back to $1.31 by September 6. This month-long horizontal trend made it seem like a top had formed. More shorts entered. 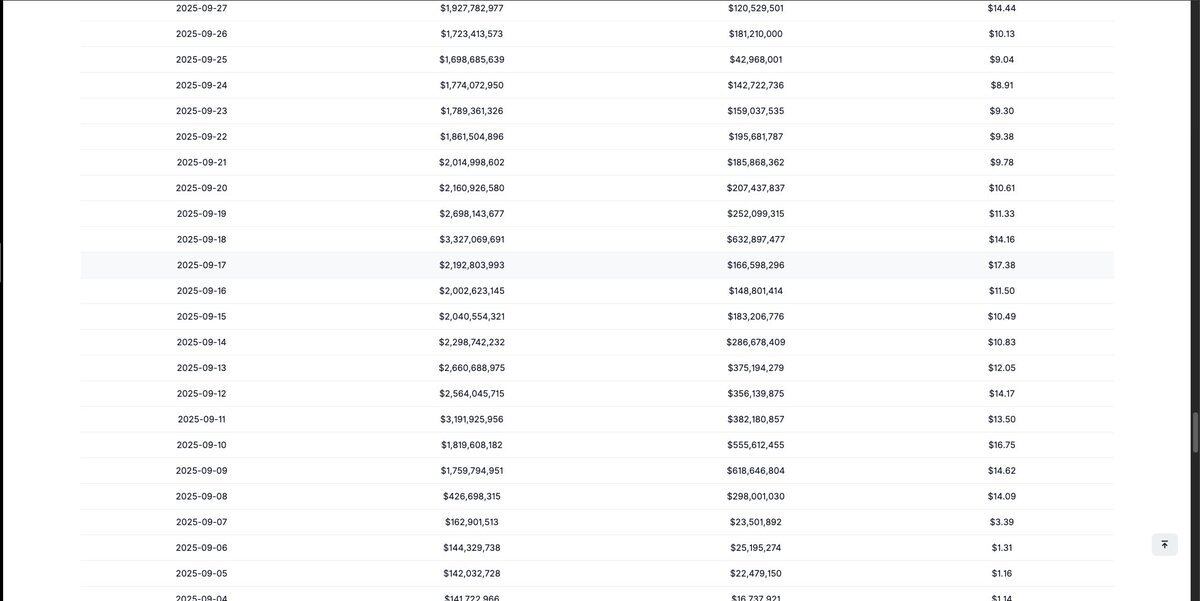
As of April 2026, only 28.18% of MYX's total supply had been unlocked, while 71.82% remained locked/under linear release. During the pump from August to September 2025, the circulating supply would be even less, with the project controlling supply often reaching 95% or more.
There is a common misconception here, Market Cap & Fully Diluted Value
Market cap = Current price x Circulating supply
Fully diluted value (FDV) = price x max supply
Generally, a strong manipulated coin's initial circulation is around 10-20%. The actual cost of controlling supply looks at market cap rather than FDV, which can lead to fear of high market caps causing some to short, while in fact, the true circulation only considers market cap and the real chips in circulation.
Phase 3 — The Trap
During that month-long consolidation, the funding rate deeply turned negative — shorts had to pay -2% every 4 hours, meaning that just holding a position for a day required a -12% fee, not accounting for sideways price or rising scenarios. 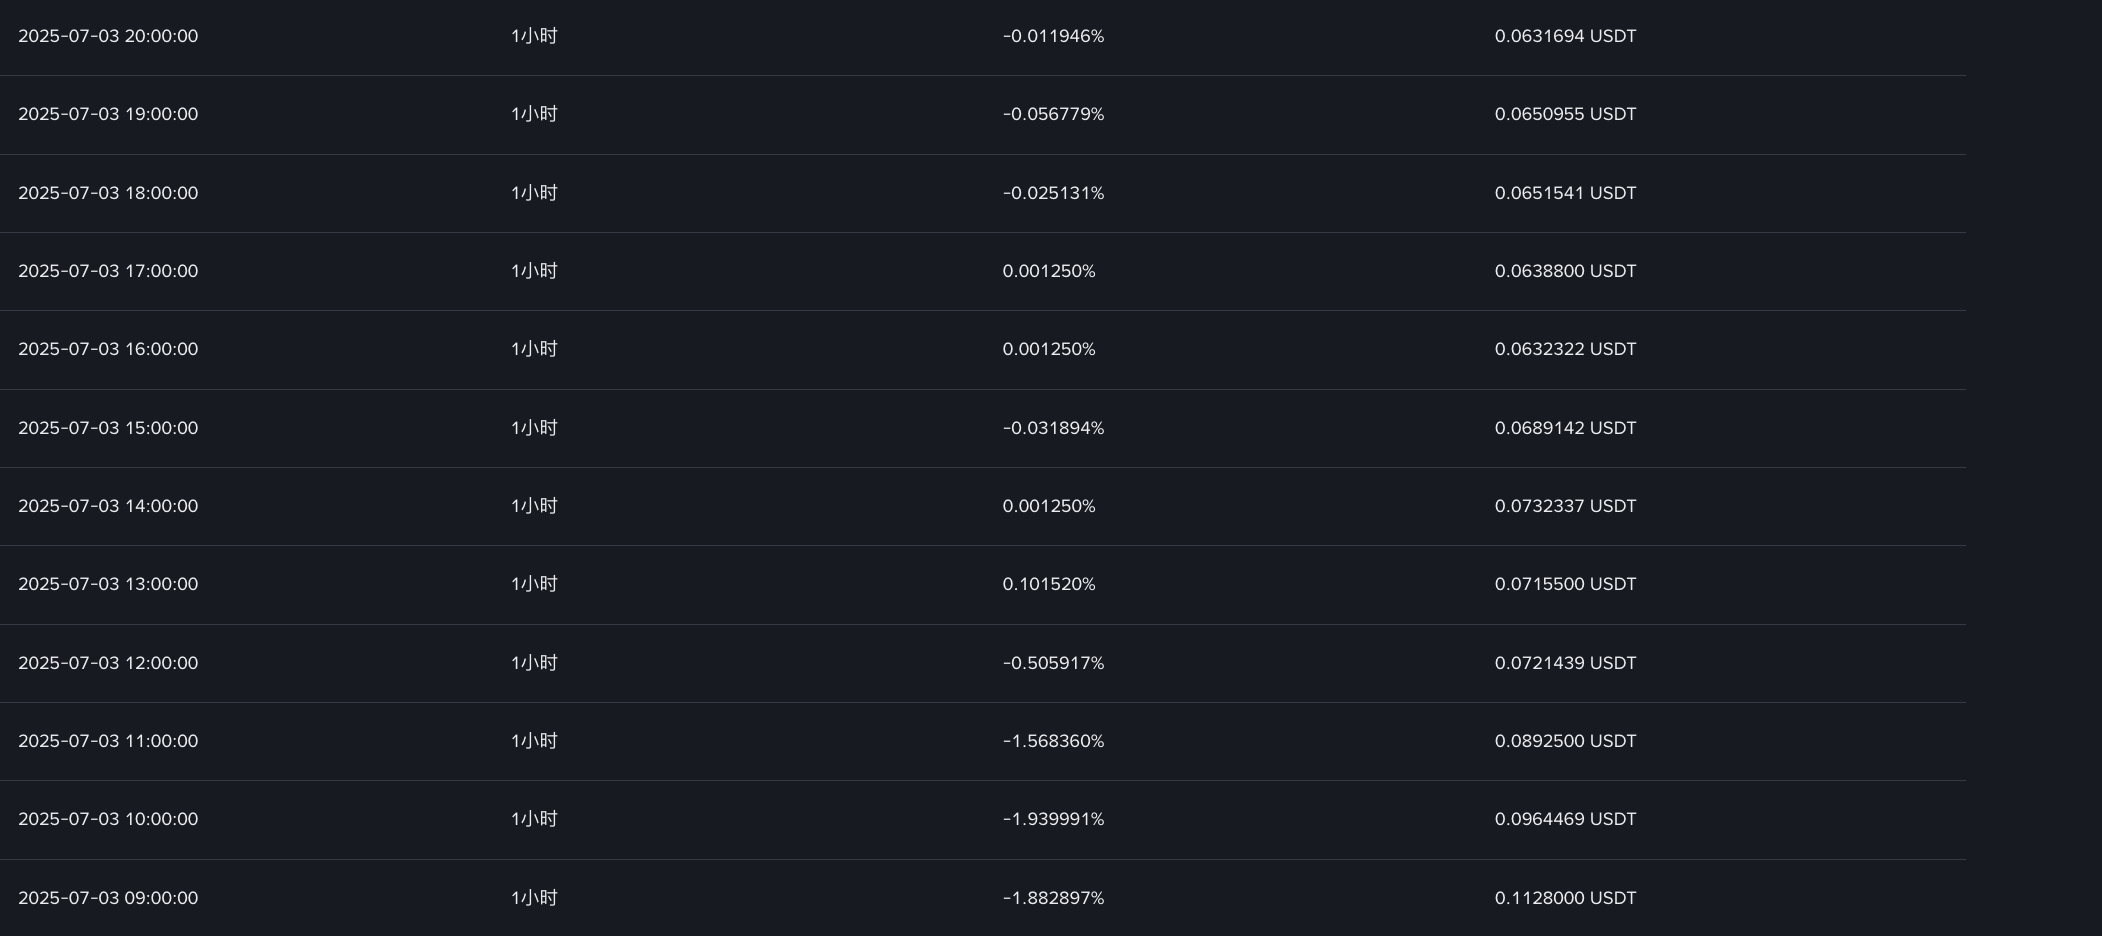
The operators used this phase to close the initial long positions and re-leverage. The price range of $1–2 + deeply negative rates made it look like a "top token." More shorts entered, convinced that "the crash was imminent".
Phase 4 — The Squeeze
Coinglass data corroborated this setup:
- September 6: OI (Open Interest) $95.15M, price $1.31;
- September 7: price nearly tripled to $3.39, the first wave of shorts began to be crushed, OI surged with new positions from both bulls and bears;
- September 8: MYX surged from $3.39 to $14.09 in one day. An analysis by WEEX indicated that in that single day, $16.53M was liquidated, with $13.68M coming from short positions. Each liquidation forced a buyback, continuing to push the price higher, triggering the next round of liquidations. OI surged to more than $370M;
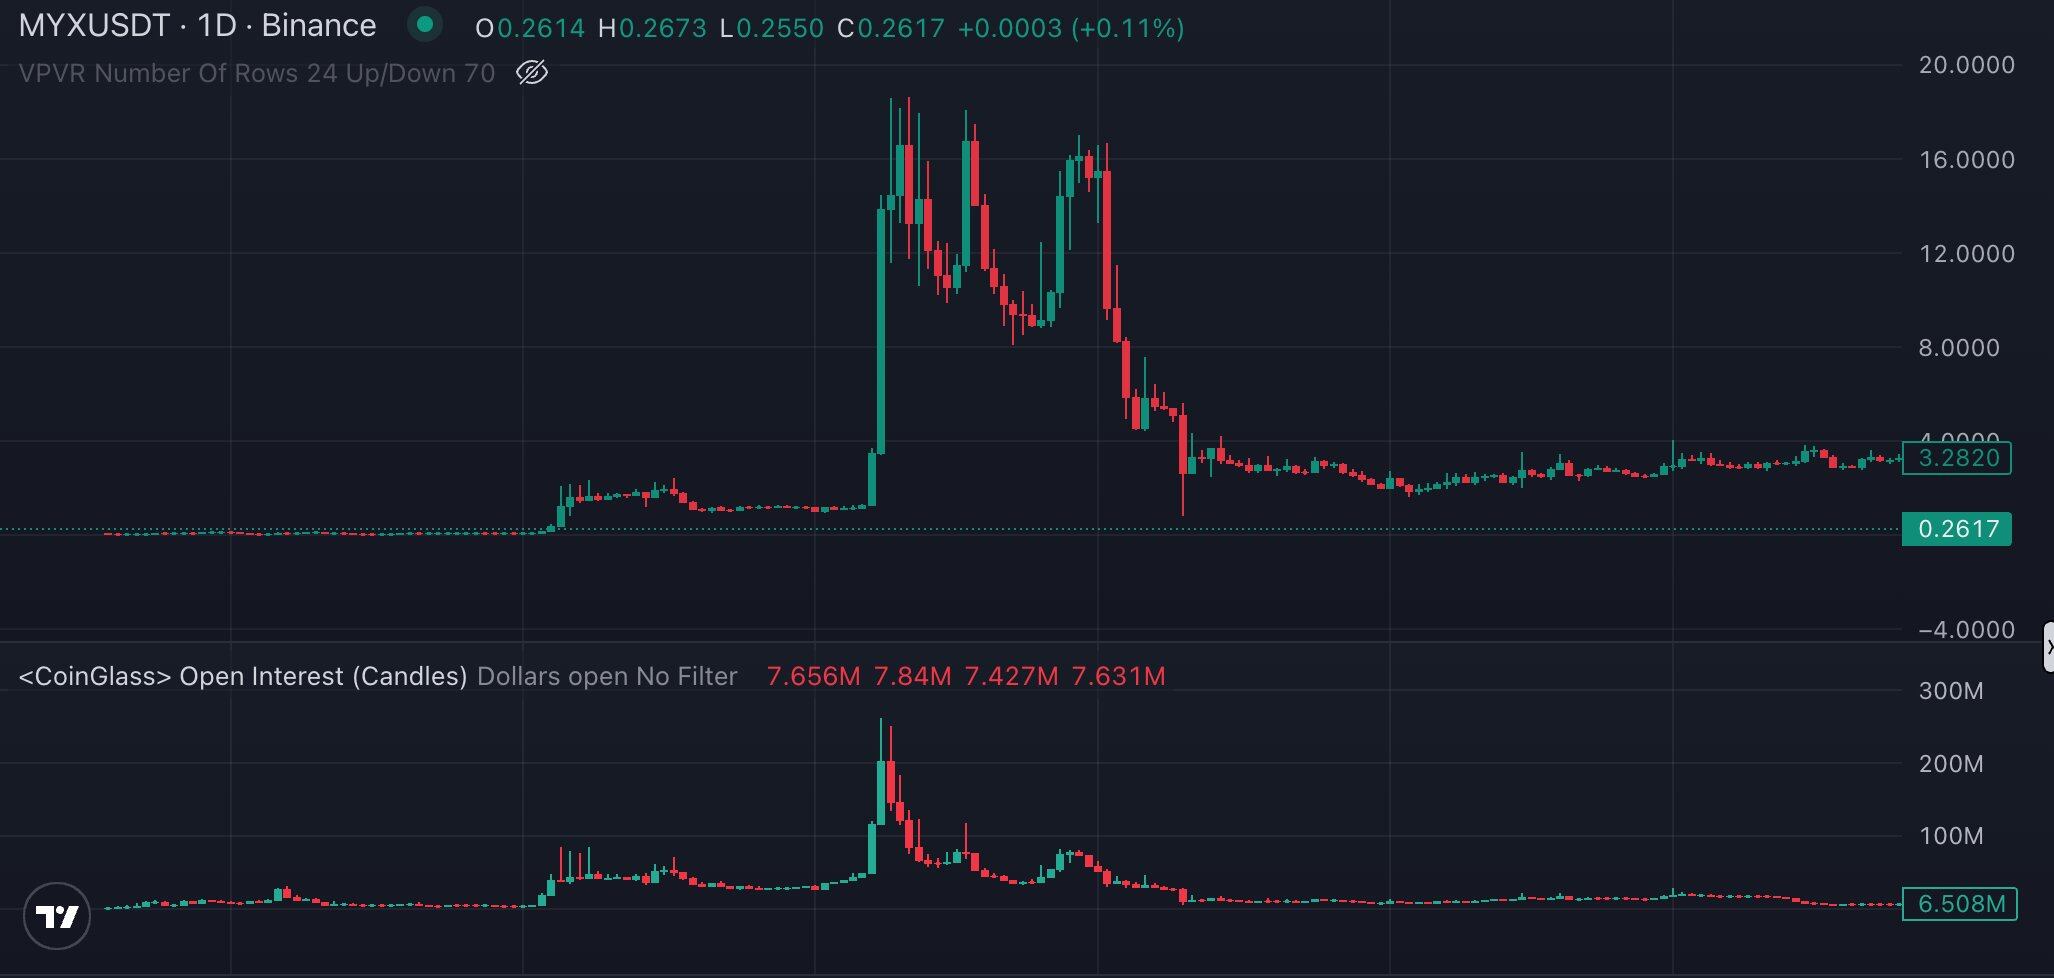
- September 9: pushed up to $14.6
- September 10: reached $16.75. Coinglass shows that contract daily trading volume soared to $9–10B+.
The squeeze continued through mid-September, with prices fluctuating between $10–17, hunting down the remaining shorts. 
Phase 5 — The Exit
When the shorts were completely purged and the price reached a peak, the operators reversed their positions: opened short positions at highs and gradually closed the original long positions, then began transferring tokens to a centralized exchange for spot trading but did not sell.
This is where the second trap caught some seasoned on-chain players. Seeing the "wallet → exchange" transfers, they instinctively judged, "the crash is about to happen," and opened shorts. However, those transfers were just a trap; before the actual crash, the operators crushed this wave of new shorts again, completing the final harvest before finally exiting.
COAI: Pump and Dump Type
COAI launched in September 2025, opening at $0.22. It dropped to $0.17 within two days due to selling by airdrop recipients. Over the following seven days, the price quietly traded between $0.17–$0.39 — this was the accumulation window.
On October 6, COAI launched 5x leverage contracts on Aster. On the same day, the price surged from $0.39 to $2.42. Binance Alpha was the first platform to list COAI (September 25, the same day as TGE), and Bybit followed around October 30. The entire BNB ecosystem was experiencing upward momentum at that time, and the "BNB season" narrative provided perfect cover for the pump.
As of April 2026, only 24.86% of COAI's total supply had been unlocked, **75.14% remained under linear release**, meaning that during the pump in October 2025, the actual circulating supply would have been even less, and the project controlled supply more tightly.
On-chain analysis from Bubblemaps revealed 60 wallets: they were injected at the same time, each wallet exactly received 1 BNB from Binance at 11:00 UTC on March 25, and then executed identical automated trading strategies through Binance Alpha. This high degree of uniformity in behavior led Bubblemaps to directly indicate centralized control or high coordination behind these addresses. 
bubble maps:https://x.com/bubblemaps/status/1978865917552660795
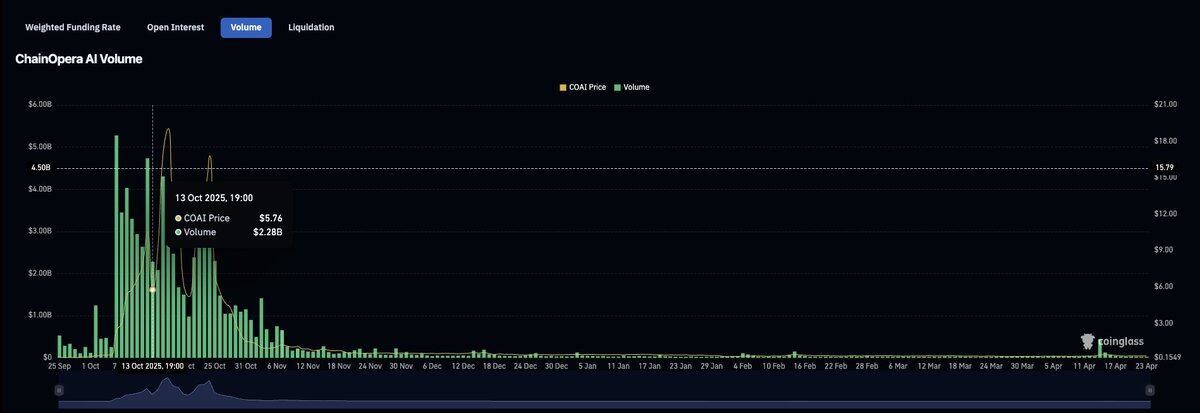
After that, the market began to accelerate. Coinglass data shows:
- Before Aster launched: OI about $30.2M;
- October 7: OI surged to $207.6M, price $2.99;
- October 9: OI $350.93M, price $5.82;
- October 12: intraday ATH around $44–45.
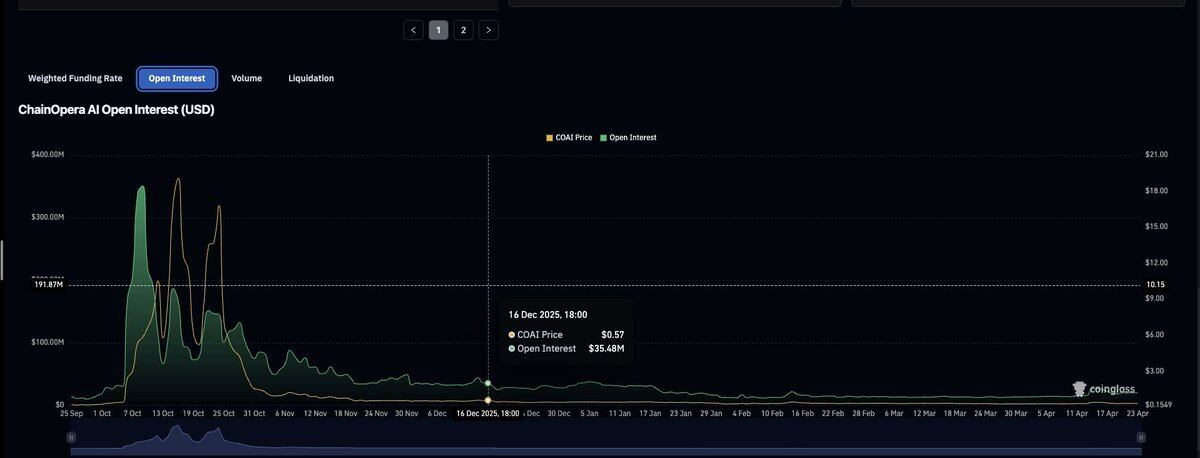
Data from coinglass
coinglass:https://www.coinglass.com/currencies/COAI
After the ATH, OI on Coinglass showed a series of rapid declines.
Differences from MYX
COAI did not follow the same five-phase script as MYX. MYX had a notable consolidation period lasting up to a month between the initial surge and squeeze — this was a deliberate "bait + trap" cycle: market makers waiting for shorts to enter, letting the funding rate turn deeply negative, then triggering a cascade of liquidations.
COAI is different. The ascent to ATH occurred nearly in one breath, without any intermediate pauses. Since over 75% of the supply was locked on the day of launch, the tradable circulating supply was already extremely thin. Tokens with high control do not need to manufacture squeezes; they can drive prices on such thin circulation and harvest the remaining liquidity in the market through off-market capital.
Commonalities of These Tokens
1. Low Float
- COAI unlocked 19.65% at TGE;
- MYX was 9.21%.
- Low initial circulation, low float + high control
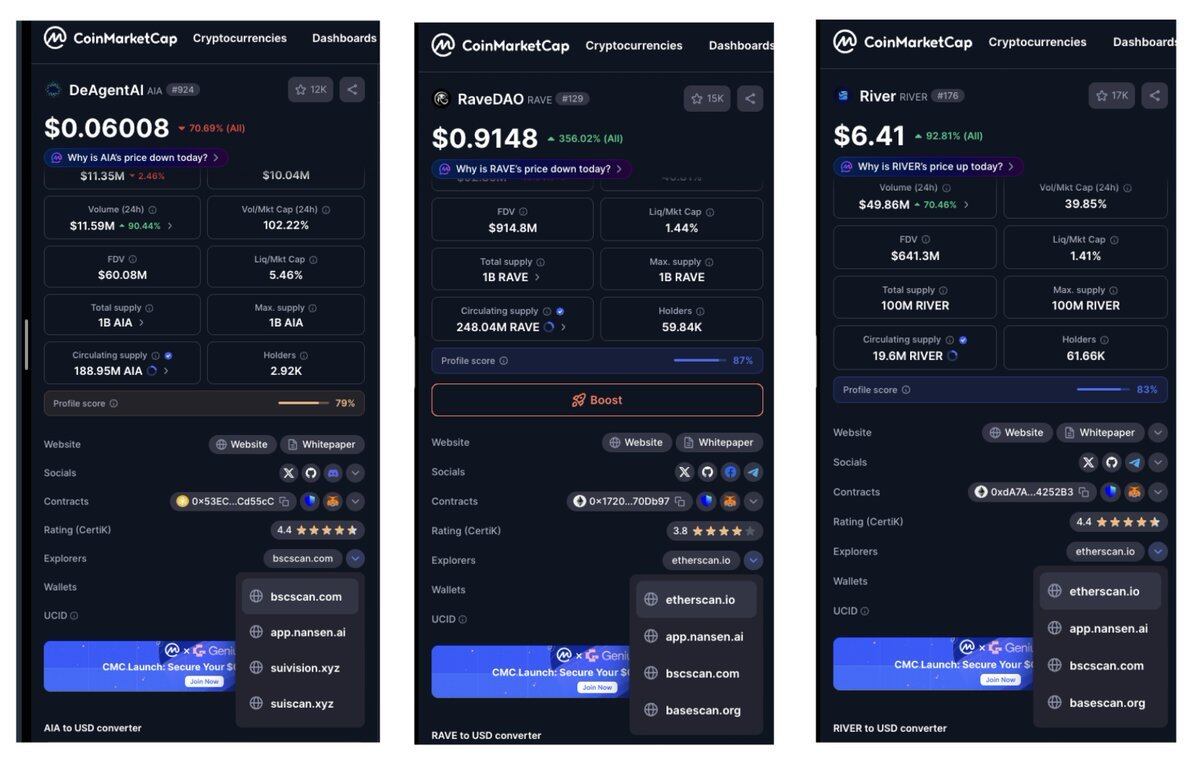
2. BNB Chain All the tokens involved have BNB Chain contracts, even AIA (marketed as "the largest AI agent infrastructure," launched simultaneously across SUI/BSC/BTC). BNB Chain offers lower fees and direct channels to Binance Alpha.
Some tokens are deployed across multiple chains:
- AIA: SUI, BNB Chain;
- Rave: Ethereum, Base, BNB Chain;
- River: Ethereum, Base, BNB Chain.
 Multi-chain deployment provides operators with more avenues: they can move tokens to chains with thinner liquidity, create price spreads for arbitrage, utilize cross-chain bridge mechanisms to create manipulation opportunities (for instance, the operation Power performed taking advantage of Ronin bridge downtime), and distribute tokens across multiple liquidity pools during the unloading phase. The more chains, the more places for manipulation.
3. Binance Alpha → Binance Futures BNB Chain launch → Binance Alpha → Binance Futures. The launch of contracts is the most critical step — this provides operators with a leveraged liquidation site, and contracts are also the main area for profit.
4. AI Narrative (in most cases)
Most of the tokens discussed in this article are packaged as AI projects — AI agents, AI infrastructure. MYX is a perpetual contract protocol; PIPPIN is the only exception (pure meme coin, with no AI packaging). But as long as the AI label exists, there is always a story to tell with every pump.
Retail investors are more willing to enter a token with an AI narrative rather than a random BNB chain token without a story.
5. Coordinated Wallet Accumulation
- COAI: 60 wallets, each with 1 BNB;
- PIPPIN: 50 wallets funded from HTX, controlling 44% of the supply;
- MYX: 6 wallets, 2,240 small buys on PancakeSwap;
- SIREN: 200 wallets, controlling 50% of the total supply.
These operations are typically spread out over weeks or months.
How Manipulation Occurs at the Order Book Level
OI Brushing (Fake Open Interest / Position Brushing)
"Brushing OI" refers to market makers artificially inflating OI figures through self-buying and selling or through synchronized accounts on exchanges with poor liquidity, without actually creating true market risk exposure. This inflated OI makes a token appear more active than it actually is, thereby attracting more retail investors and creating an illusion of "ample liquidity."
MYX is a clear example. Coinglass shows that during the September squeeze, contract daily trading volume skyrocketed to $9–11B, while OI fluctuated between $95–396M during the same period, with a Vol/OI ratio as high as 24 times. For normal tokens, this ratio is generally between 3–8 times, and any reading above 20 times indicates that a significant portion of the volume is fabricated.
According to WEEX analysis, two-thirds of all MYX volume was concentrated on Bitget — a single exchange accounted for a massive portion of activity in a low-market-cap token. Such concentration itself is another signal of volume brushing: If a token listed on multiple exchanges sees most of its volume concentrated in one, that exchange's volume is likely artificially inflated, to attract attention and influence the listing decisions of other exchanges. 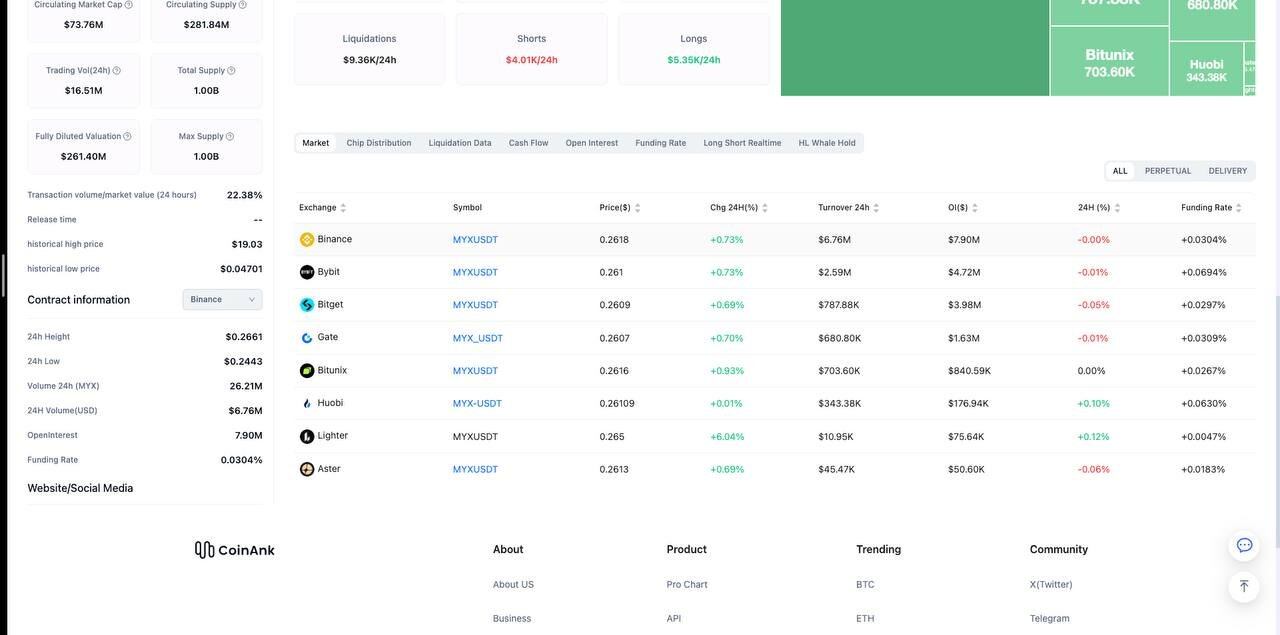
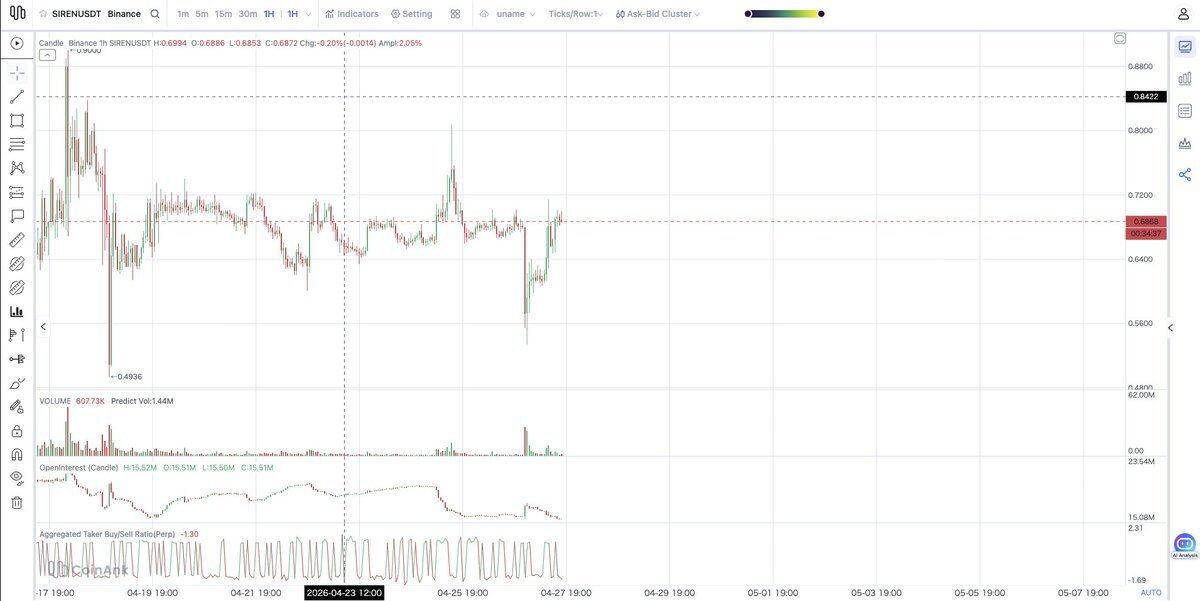
CoinAnk:https://coinank.com/instruments/MYX/SWAP/Binance/MYXUSDT/1h
Current MYX data on CoinAnk indicates that OI is now distributed proportionally across exchanges, largely aligning with each exchange's overall market share. Bitget's share dropped from 66.67% during the squeeze to 20% afterwards. This indicates that the earlier concentration was temporary and directly related to manipulation rather than genuine trading activity.
Microscopic Structure of the Order Book: Earlier Warning Signals
The "OI brushing" signals mentioned above tell you that volume or positions are fake; the wallet concentration data from earlier cases tells you that chips are being controlled — but both kinds of signals can only be seen after the setup is complete. The order book provides earlier indicators — it is the real-time fingerprint of "accumulation is ongoing."
Taking MYX as an example, the accumulation phase ran from late July to early August. On Coinglass, both OI and price were flat during that period, but at the order book level, accumulation was already clearly visible — as long as you were watching.
When a whale uses a TWAP (Time Weighted Average Price) or iceberg order (both used to split large orders into hundreds of smaller ones, spread over time, deliberately hiding their existence), the order book would display a specific set of fingerprints:
- Sell depth continues to thin: whales systematically eat near-market price sell orders, but each individual order is not conspicuous, slow enough to remain unnoticed;
- Buy orders continuously pile up: buy orders consistently appear near the market price, being absorbed more slowly than they are replenished;
- Bid-Ask Imbalance remains long-term elevated: consistently above 0.4. Normal markets do not behave this way, persistent positive imbalance means buyers are suppressing sellers, indicating someone is continuously absorbing the sell orders in the market.
Formula as follows:
Imbalance = (Buy volume - Sell volume) ÷ (Buy volume + Sell volume) 0.4 signifies 70% buying, 30% selling. Maintaining above 0.4 for an extended period on low-market-cap tokens means someone is heavily accumulating.
However, true smart accumulation is difficult to detect — a good market maker would never let buy orders visibly exceed sell orders, as this would expose them. They would proportionally increase buy orders to match the growth of sell orders, making the balance appear even while quietly pushing the buy/sell ratio from 0.95 → 0.97 → 0.99 within a week. A snapshot at any moment would "look very normal," but if buy orders gradually press over sell orders yet never break above 1.0 or fall back, this pattern itself is a sign of TWAP.
Case Study: GWEI
This token provides a clear visual sample of "order book accumulation" in real-time data. When a low-market-cap token enters its listing or acceleration phase, the order book shows obvious anomalies: centralized buying, sudden changes in depth structure, prolonged positive imbalance. 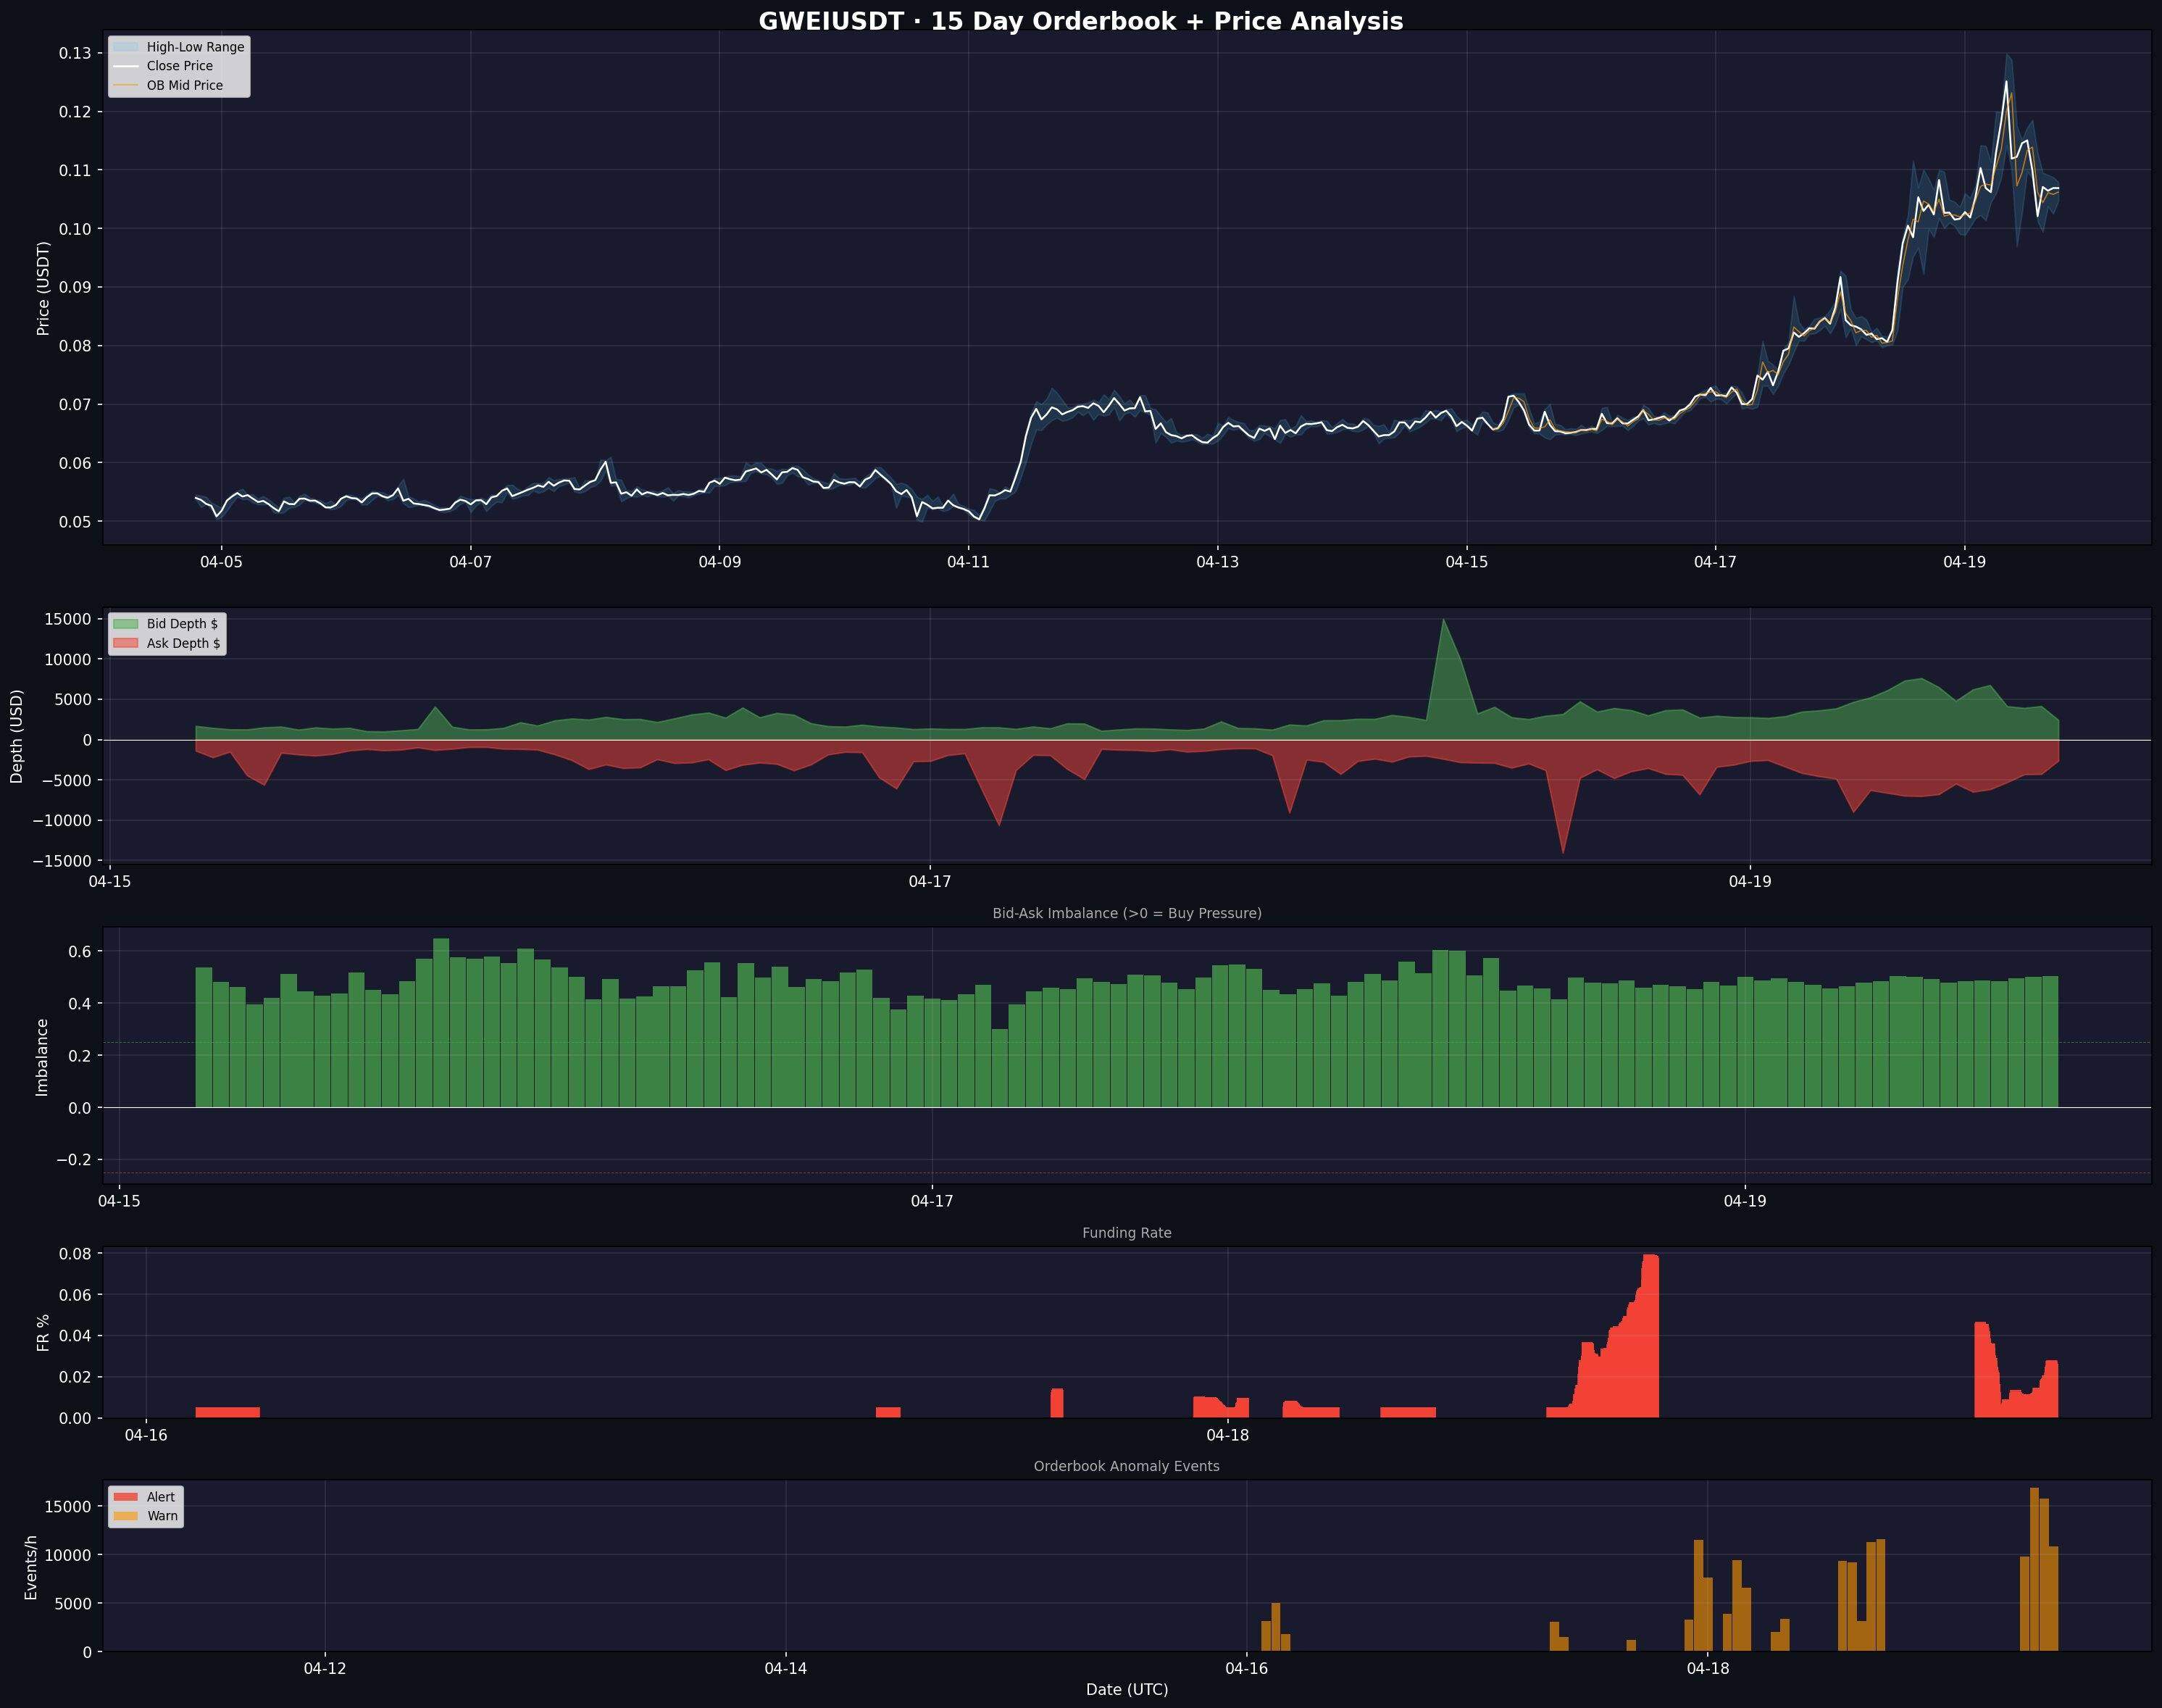
https://x.com/0xBenniee/status/2046138877425893508?s=20
After April 16, the price entered an acceleration phase, rising from $0.07 to $0.12. During this same period, three things happened simultaneously:
- Order book anomaly events surged to more than 15,000 per hour. These are abnormal orders, modifications, and cancellations that do not match normal trading volume. Normal tokens generate only a few hundred such events per hour. Surging to 15,000 times indicates that the order book is actively managed by an automation system, not by humans.
- Sell depth continuously thinned. The sell wall above price was systematically absorbed. Not by sweeping a large order (that would be too conspicuous) but through a long-term, continuous grinding absorption, appearing like typical trading until you accumulate hours of effects to notice the problem.
- Bid-Ask Imbalance remained high over 0.4 for a prolonged period. One or two sporadic readings are meaningless, but persistently staying above 0.4 for several hours implies accumulation is underway.
The funding rate soared around April 18 to 0.08%, confirming the acceleration phase signal. By that time, accumulation was nearly finished, and the pump had already begun.
How to Monitor Yourself?
Historical order book data cannot be backtracked through API — once a timestamp passes, order depth disappears. To capture it, you need a bot to periodically capture snapshots of the order book and save them locally.
The most basic setup is:
- A $6/month DigitalOcean server;
- A Python script;
- Fetch order book depth from Binance futures every 60 seconds;
- Store in an SQLite database.
Multiple tokens can be tracked simultaneously — every pair of perpetual USDT contracts on Binance is accessible through public API without needing an API key.
Limitations of Real-time Order Book Monitoring:
- When a whale uses market orders to sweep beyond the top 20 levels, this set of indicators cannot capture it at all;
- It cannot distinguish between "orders being eaten" and "orders being actively canceled";
- In low-market-cap coins, signals could also be artificially fabricated — thus relying solely on order book data for entry carries significant risk.
Currently, the data is best used as one of multiple monitoring factors; expanding to the top 50 levels and resonating with other indicators will significantly improve accuracy.
Cross-Exchange Price Manipulation
Binance uses a Composite Index: it pulls price data from multiple exchanges and calculates a Mark Price through weighting. It’s the mark price that determines when your position is liquidated, not the last transaction price. 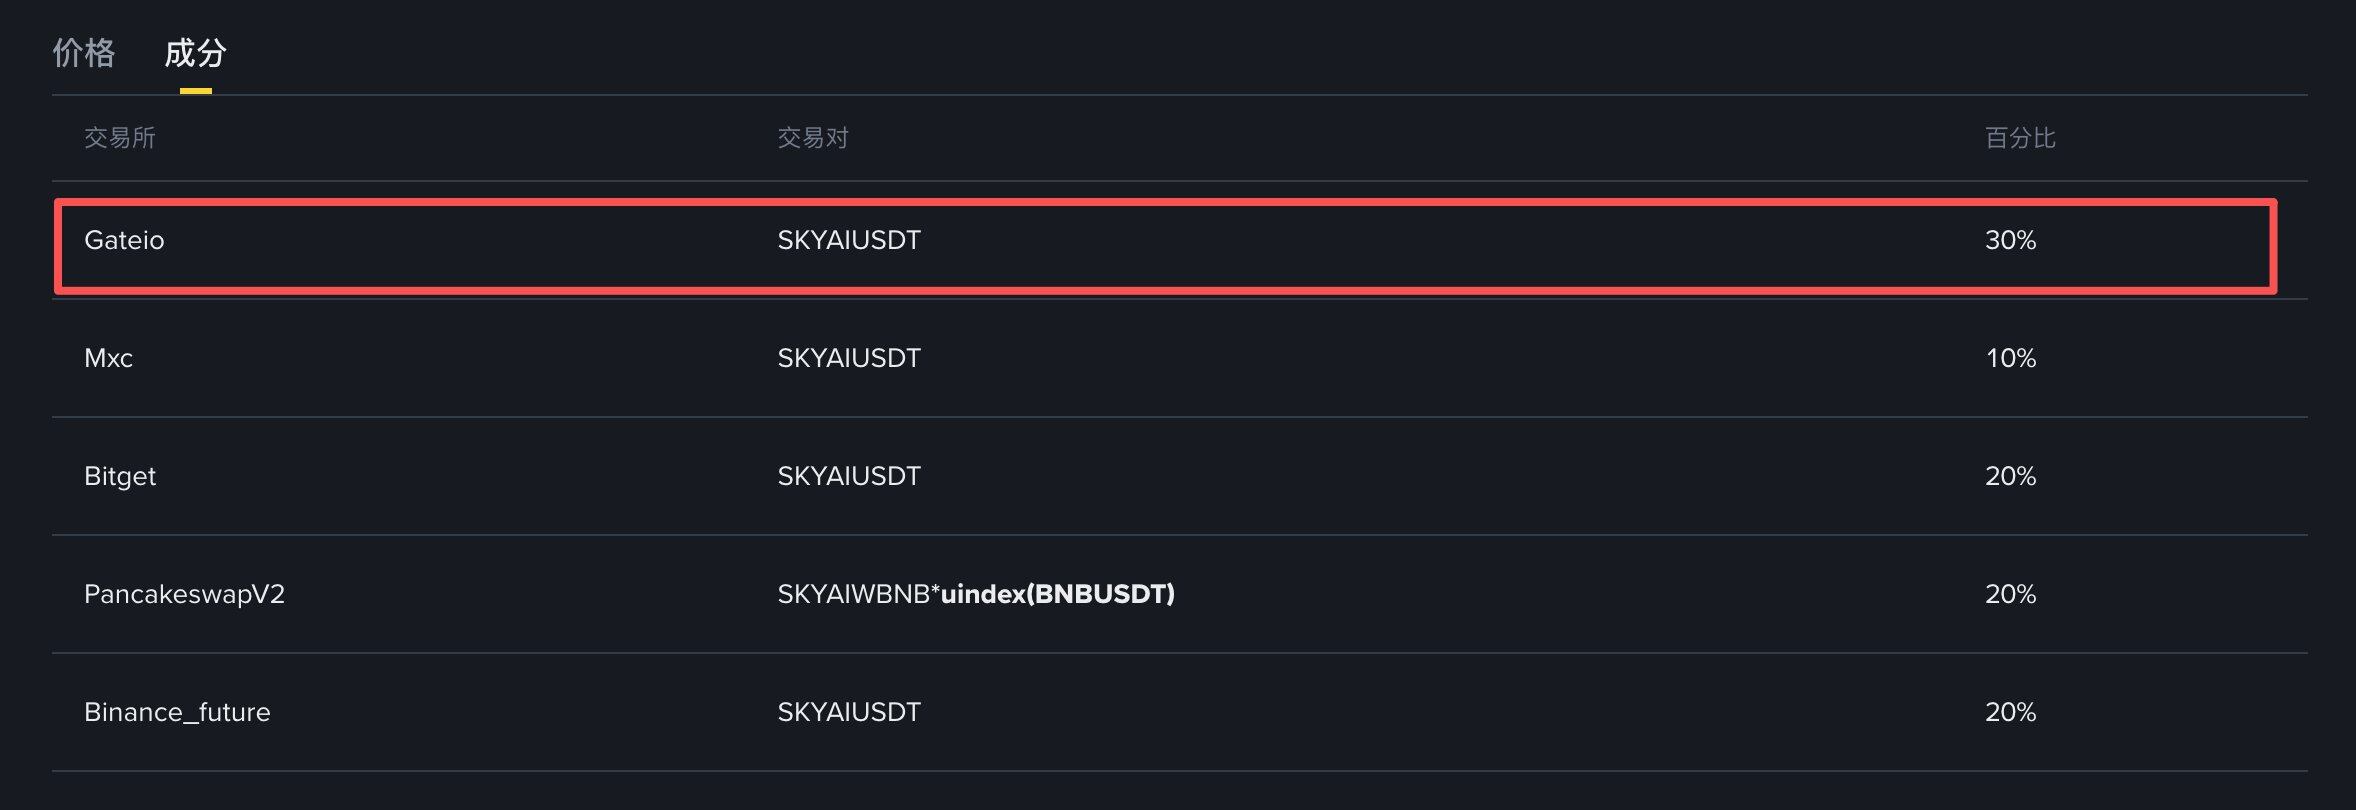
https://www.binance.com/zh-CN/futures/funding-history/perpetual/index
The problem is: if the index contains exchanges like Aster, Gate, or Mexc with low spot liquidity, market makers only need a relatively small amount of capital to leverage prices on those exchanges, thereby negatively impacting Binance's mark price. This means — they don't even need to trade on Binance to trigger liquidations there.
Market makers also use Aster to hedge: long on Binance and short on Aster (or vice versa), making the overall manipulation Delta neutral.
To check if a token has Aster arbitrage activity, just check the exchange distribution of that token on CoinAnk. If a low-market-cap token with virtually no spot liquidity has contracts on Aster, and the contract launch time coincides with the Binance contract launch, that's a signal.
How to Read a Squeeze in Real Time
Knowing the script is not enough; you also have to discern at which stage of the script you currently are. The following five signals, considered collectively, can inform you whether a squeeze is ongoing, about to end, or has already concluded.
1. Funding Rate
- Squeeze ongoing: shorts continue to pay the longs, deeply negative rates persist = more fuel for the squeeze;
- Squeeze nearing end: rates return to 0, imbalance is being corrected, shorts start actively closing positions rather than being liquidated;
- Exit signal: rates turn positive (longs paying shorts), all shorts have been exhausted, and there’s likely no one left to squeeze, with prices likely declining.
2. OI vs Price
- Squeeze ongoing: both are rising in sync, new shorts keep entering and being crushed, each liquidation pushes the price higher;
- Squeeze nearing end: OI declines while price holds, the number of positions that can be liquidated decreases, buying momentum weakens;
- Exit signal: OI rises as price falls — new positions are solely opening on the short side, and they are winning. The operators may be short themselves.
3. Taker Ratio
- Squeeze ongoing: buyers dominate, actively consuming sell orders — someone is consistently sweeping the market;
- Squeeze nearing end: longs and shorts are balanced, with no clear dominance;
- Exit signal: multiple consecutive hours of seller dominance — persistent seller activity implies distribution has begun, operators are exiting to the remaining buying liquidity.
4. Large On-chain Transfers
- Squeeze ongoing: zero large transfers, no one is selling;
- Squeeze nearing end: small transfers start appearing;
- Exit signal: large wallets transferring to CEX.
Tools for Research
CoinAnk
CoinAnk is a crypto derivatives data analysis platform that aggregates data from mainstream exchanges (including Hyperliquid, Lighter, Aster, and other DEXs) and transforms it into actionable trading insights. As a single dashboard, it is currently the most comprehensive pump detection tool. Specific uses include:
- OI Tracking: on any token page → OI tab, all exchanges' OI displayed on one chart and overlayed with price. Switch between 1H/4H/daily charts. On 1H, you can see "price vs OI divergence" signals in real-time.
- Funding Rates: on the same token page → Weighted Funding Rate tab. If the rate dips below -0.05% for multiple consecutive 8-hour periods, it indicates an ongoing squeeze setup.
- Liquidation Data: token page → Liquidation tab. Displays the amount of individual liquidation orders, exchanges, and long/short direction. Sort by amount to find the largest individual liquidation — if $300M OI can only generate a $50k largest single liquidation, that OI has been fabricated. CoinAnk's Liquidation Heatmap features high resolution and supports multiple timeframes, with brighter colors indicating greater potential liquidation accumulation at that price point — these areas often represent "points" where market makers extract liquidity.
- Cross-exchange OI Distribution: Compare the OI of the same token across different exchanges. If a low-market-cap token has nearly equal OI on Bitget and Binance, the OI on the smaller exchange is likely fabricated.
- Volume: token page → Volume tab. Compare daily volume with OI. Vol/OI > 20 times is likely brushing, with a normal range being 3–8 times.
- Order Flow and Footprint Charts: CoinAnk provides real-time order flow analysis and built-in imbalance detection. This lets you see the precise transaction volumes of orders listed at every price level within a candlestick — perfectly corresponding to the previously discussed order book microstructure signals.

https://coinank.com/chart/indicator/order-depth
- Long/Short Ratio: real-time display of active buys vs active sells, with Long/Short Ratio line overlayed. When the green bars (buyers) consistently exceed the red bars (sellers), and the ratio stays > 1.0 for an extended time, buyers dominate — this is the graphical representation of the Taker Ratio signal mentioned in the "real-time reading of squeezes".
- Pro Chart: overlay traditional candlestick and derivative data (OI, funding rates, long/short ratios, liquidation levels) in one chart. Real-time tracking of a pump in a volatile coin saves the effort of switching back and forth between tabs.
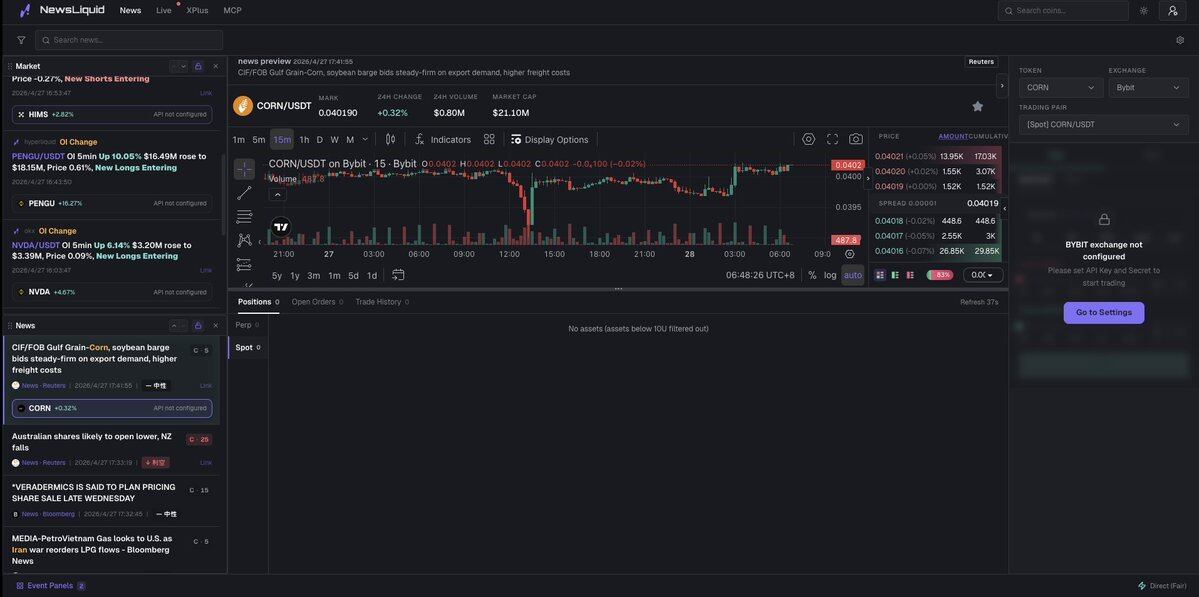
Newsliquid
Newsliquid essentially acts as a real-time Bloomberg terminal for the crypto space — integrating news, market data, social monitoring, and trading infrastructure into one interface.
- News + TradingView: the left displays a real-time news feed with breaking headlines, next to OI change notifications. TradingView charts are integrated directly. API access to trade directly from the interface is also available.
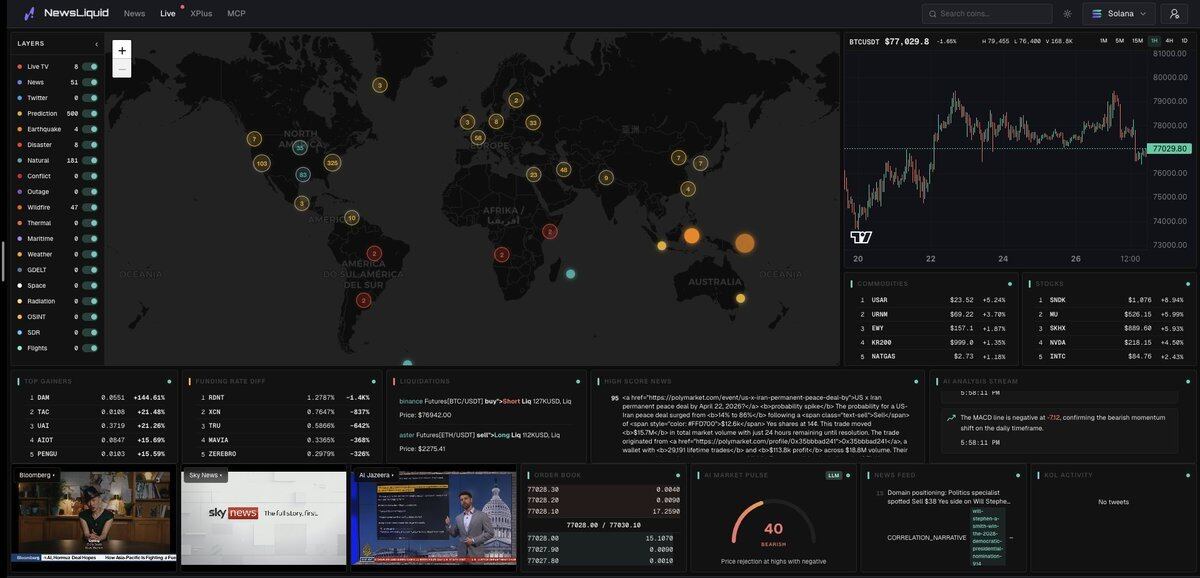
- Real-time Dashboard: global event map covering various categories including TV, news, X, conflicts, outages, forecasts, OSINT, etc.; bottom shows gainers list, funding rate differentials, and more.
- X (Twitter) Tracker: real-time monitoring of crypto Twitter, with custom filtering for EN/CN, meme accounts; side panel shows relationship dynamics.
- MCP Services: open MCP server, including OpenNews (real-time crypto news queries, AI summaries, sentiment analysis), OpenTwitter (user information, tweet queries, KOL tracking), OpenTrade (DEX trading, on-chain data, token analysis), Twitter to Binance Square (automatic sync of Twitter content to Binance Square), and 6551 daily news (daily crypto news summary and market analysis).
Coinglass
The most widely used free derivatives dashboard, with most OI and volume data validated here. Track OI, funding rates, liquidations, long/short ratios.
Arkham Intelligence
On-chain wallet analysis. The wallet rotation pattern of MYX was discovered here. Search any token → look at inflow/outflow tab → find the largest funding movements in descending order. If multiple wallets share the same funding source or ultimately converge on the same CEX deposit address, they likely belong to the same entity.
Bubblemaps
Visual wallet cluster mapping. Paste a contract address, and it will connect wallets based on funding sources. The 60-wallet pattern of COAI and the 50-wallet pattern of PIPPIN were both identified using this tool.
CoinGecko + CoinMarketCap
Price verification and token data. CoinGecko's Historical Data tab offers daily prices from the date of launch — all price points on the timelines of MYX and COAI in this article were verified here. CoinMarketCap's Unlock Tracker displays linear release schedules and "circulation vs lockup" ratios.
The game is rigged, and everyone knows it. Your only advantage is to understand this script before you become a bag holder and continuously refine your skills.
Never be the exit liquidity
Recommended Reading:
“I used AI to analyze 221 contract coins and finally found the only way to trade meme coins.”
免责声明:本文章仅代表作者个人观点,不代表本平台的立场和观点。本文章仅供信息分享,不构成对任何人的任何投资建议。用户与作者之间的任何争议,与本平台无关。如网页中刊载的文章或图片涉及侵权,请提供相关的权利证明和身份证明发送邮件到support@aicoin.com,本平台相关工作人员将会进行核查。