
This report systematically analyzes the OKX Boost mechanism based on data, aiming to connect multiple stakeholders in the ecosystem.
For project teams, by restoring the ranking logic through correlation analysis, it guides them to organically and sustainably enhance their positions on the leaderboard, rather than relying on short-term traffic boosts; for ordinary users, by clarifying their position within the entire value chain through a breakdown of value flow and costs, it helps them identify their true break-even points, avoiding becoming unwitting bearers of hidden costs; for the OKX Boost product itself, through macro data trend analysis, it objectively presents its operational status and potential structural risks, in order to provide references and suggestions for the product's healthy long-term development.
Key Takeaways
The median reward per person across 68 projects is about $18, but the cost of the optimal path has reached $10–13, while the cost of the moderate path is $32, leading to potential losses with slight missteps. This implies that in most projects, ordinary users cannot achieve stable positive returns through Boost, as users are using slippage losses to subsidize external liquidity providers. In the long run, this will lead to a decline in the retention of genuine users of OKX Boost, with remaining participants leaning towards professional arbitrageurs and bots, accelerating the degradation of data quality.
The median is $499K versus an average of $901K, indicating that a small number of large projects (Plasma at $10.7M, PerpStock at $8M) have severely inflated user expectations, while most projects can only provide reward pools of $200–700K, with the average genuine return per person in most projects being only between $10 and $30.
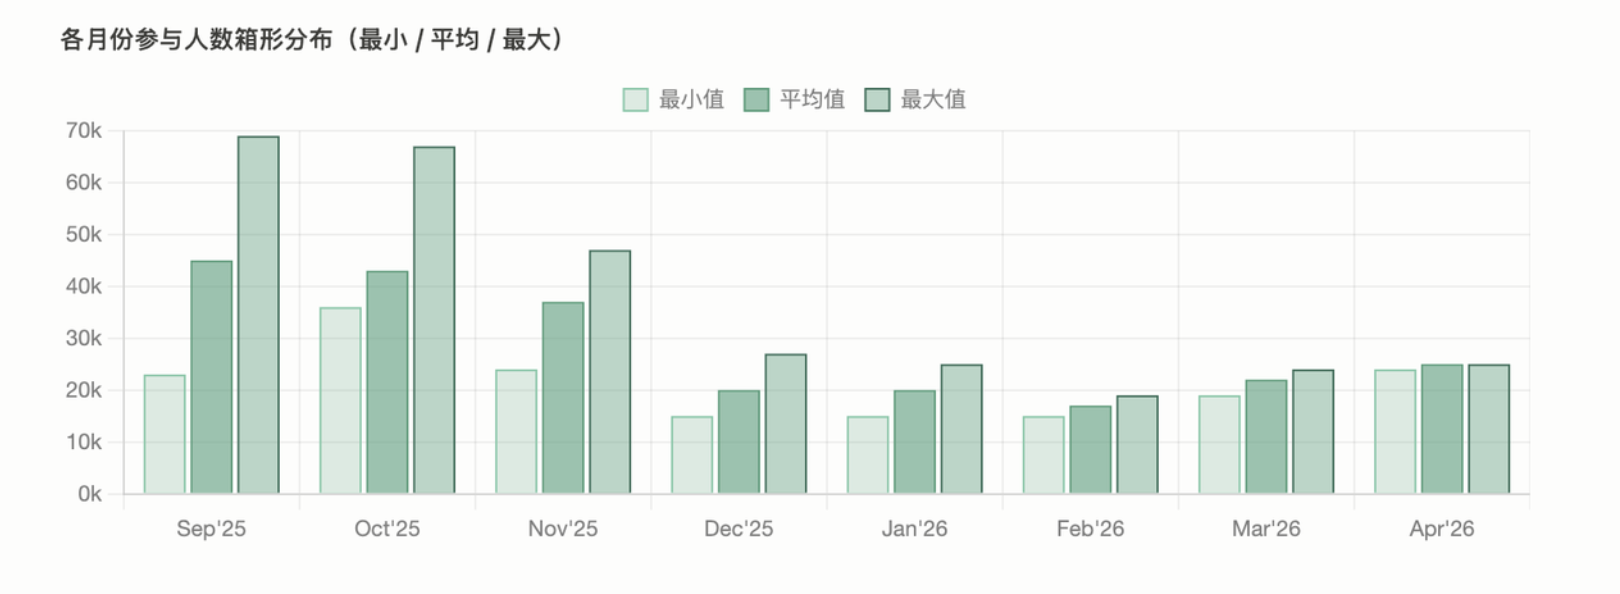
Data indicates that the average number of participants in OKX Boost in its early days (September 2025) peaked at about 45,000; however, it experienced a "halving" drop during November-December 2025, and subsequently stabilized in the 20,000 range in the following months (early 2026). The latest per capita data reveals a surprising convergence around $800, suggesting that primarily semi-professional users remain participating in OKX Boost.
The OKX Boost ranking mechanism filters for "token trading activities supported by genuine market making depth," primarily considering trading volume, liquidity, and the number of unique addresses. Liquidity serves as a threshold ($500K), while market cap, number of token holders, and price fluctuations are pseudo-correlated—indicating that OKX intentionally excludes "assets with many holders but little trading," focusing instead on projects that can establish genuine price discovery on DEX.
1. What is OKX Boost
It is essentially a points/reward ecosystem jointly launched by OKX Wallet and OKX DEX Aggregator, with the core goal of directly connecting genuine active users with quality on-chain projects, while providing a clear potential path for projects: “from on-chain organic growth → Boost leaderboard → OKX CEX spot listing.”
Two major core models:
X Launch: Users share the project token reward pool based on Boost data (currently the main gameplay).
X Campaign: Projects hold trading competitions periodically, with top-ranked participants sharing the reward pool.
1.1 OKX Boost Ranking Rules
All eligibility for activities and reward distributions are based on the Boost data from the past 10 days, with updates at 00:00 UTC daily reflecting the previous day's data.
Boost trading volume (average over the past 10 days, accrued through OKX DEX Aggregator)
Exclusively recognizes: Transactions on the OKX DEX Aggregator involving Solana and EVM-compatible chains (cross-chain, CEX, third-party DEXs like Uniswap paths, and API trades do not count).
Calculation formula: Actual transaction amount × multiplier (× additional Boost leaderboard bonus)
Trading pair multiplier table (official core rules):
| Type | Rate | Example |
| Group 1 × Group 1 | 0 | ETH ↔ USDC, ETH ↔ stETH |
| Group 1 × Group 2 | 0.25 | ETH ↔ DOGE and other mainstream coins |
| Group 1 × Others (Meme, etc.) | 0.85 | SOL ↔ any Meme coin |
| Boost Ranking Tokens (within 10 days) | Base multiplier × 1.5 | Newly ranked XLaunch tokens |
| Boost Ranking Tokens (after 10 days) | Base multiplier × 1.2 | Tokens ranked for a while |
1.2 Project Ranking Logic Analysis
Form + BD → X Launch (typically lasting 24 hours) → OKX DEX tradable (enter Boost Ranking) → Ranking sustained in the top 10% → Go to Pre-market perpetual → Convert to standard perpetual contract upon spot listing. Simply launching on Boost does not carry significance for project teams, but to obtain Perps, they need to stay in the top 10% of rankings.
The token score of the Boost Ranking integrates four dimensions: DEX hot rankings, market capitalization, liquidity, and community sentiment. We analyzed the 24-hour data of 46 listed OKX Boost projects, then reverse-engineered possible ranking reference factors.
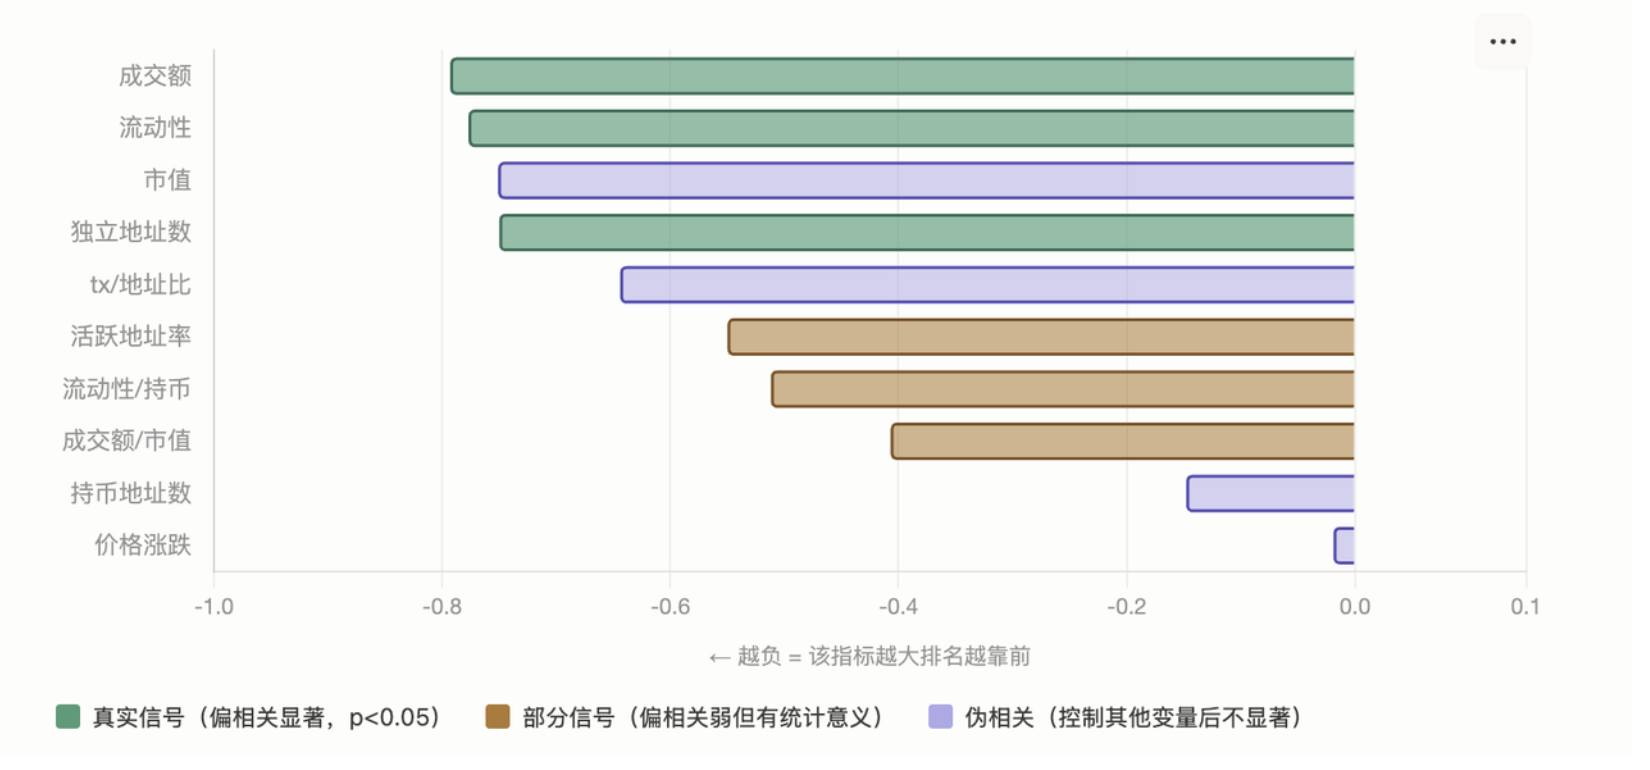
According to Figure 1, the horizontal axis represents the correlation coefficient, with values further left (more negative) indicating a larger indicator and higher ranking. The conclusion is that the correlation coefficients for trading volume, liquidity, and the number of unique addresses are all between -0.75 and -0.79, serving as the primary ranking prediction signals.
Trading volume (r = -0.793, genuine signal). This is the strongest correlation indicator, remaining significant after excluding liquidity effects. It measures the real trading scale of tokens on OKX DEX and is the main driving force for rankings.
Liquidity (r = -0.777, genuine signal). Displays a threshold effect rather than a linear relationship. Below $500K, projects are almost excluded from the top 20; below $100K, they're typically ranked 30th or lower. It communicates different information than trading volume; the former looks at "how much was traded," while the latter examines "whether the market can absorb it."
Number of unique addresses (r = -0.750, genuine signal). The original correlation is strong, and when controlling for liquidity, it remains r = -0.313 (p = 0.034), still significant. It measures how many different individuals are participating in trading and serves as a proxy indicator for user dispersion and ecological health.
Active address rate (r = -0.550, partial signal). This is the number of unique addresses divided by the total number of holding addresses, measuring "how many holders are actually trading." It has independent informational value, but overlaps somewhat with trading volume, resulting in weak predictive power alone.
Liquidity/holding (r = -0.512, partial signal). This measures the liquidity depth per holding address, focusing on holding quality rather than quantity. It is highly correlated with liquidity itself, contributing limited additional insight.
Trading volume/market capitalization (r = -0.407, partial signal). This is the turnover rate, reflecting the trading activity of the token relative to market cap. It has some independent signal value, but there is high variability in the sample.
tx/address ratio (r = -0.644, pseudo-correlation). The original correlation appears strong, but when controlling for trading volume effects, it only remains r = -0.03 (p = 0.85), completely insignificant. A high tx ratio is merely a natural result of high trading volume, not an independent signal for volume manipulation punishment.
Market capitalization (r = -0.751, pseudo-correlation). The original correlation appears as strong as trading volume, but when controlling for volume effects, it only remains r = -0.15 (p = 0.31). Tokens with high market caps usually also have high trading volumes, with correlation entirely explained by volume; the OKX scoring system likely does not consider market cap as an input variable at all.
Number of holding addresses (r = -0.148, pseudo-correlation). The direct correlation is extremely weak. RAIN has 170K holders and ranks 24th, while GAIX has 141K holders and ranks 41st, both typical counterexamples. Holding many but rarely trading results in ineffective data in this system.
Price fluctuations (r = -0.019, pseudo-correlation). Linear correlation is almost zero. Price impacts ranking in a non-linear manner, triggering non-linear penalties only during extreme drops (e.g. -52%); regular daily fluctuations have virtually no effect on ranking.
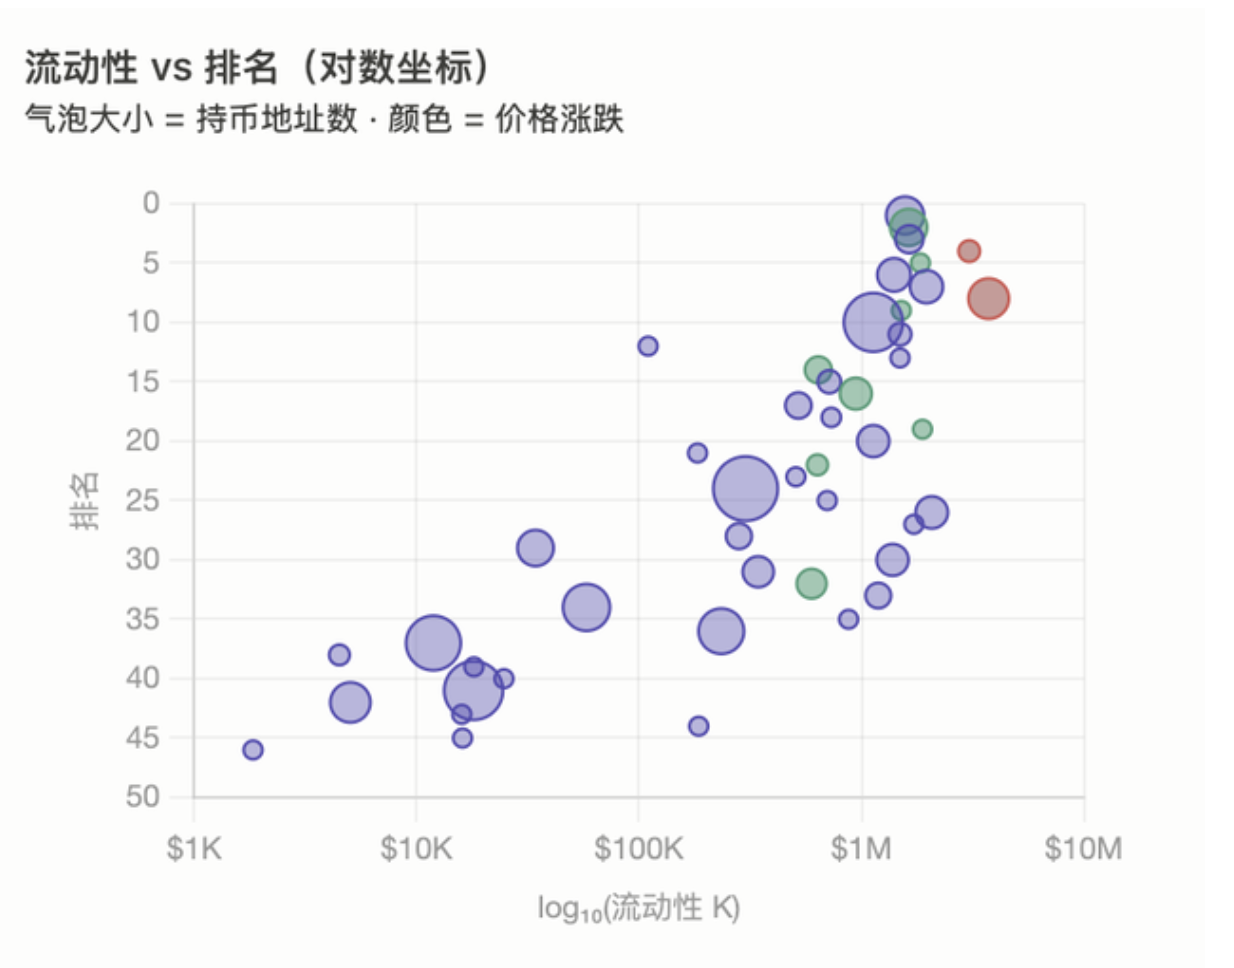
Figure 2 shows the correlation situation for liquidity. The horizontal axis represents the log of liquidity, while the vertical axis represents ranking (the smaller the number, the higher the rank). Bubble size indicates the number of holding addresses, while color denotes price trends (green = rising, red = plummeting, purple = stable).
The core visual information is: Data points overall display a trend from the bottom left to the top right, meaning higher liquidity leads to a higher ranking. The $500K threshold is a clear demarcation line; nearly all tokens in the top 20 are located to the right of this line. There are two large red bubbles in the bottom right, which are LAB and UB—tokens with good liquidity but low rankings due to price drops. The lower left corner is populated with numerous small bubbles representing "zombie tokens," which have nearly zero liquidity and rank below 30. RAIN is the most notable outlier, with a huge bubble (170K holders) but extremely low liquidity, ranking only 24th.
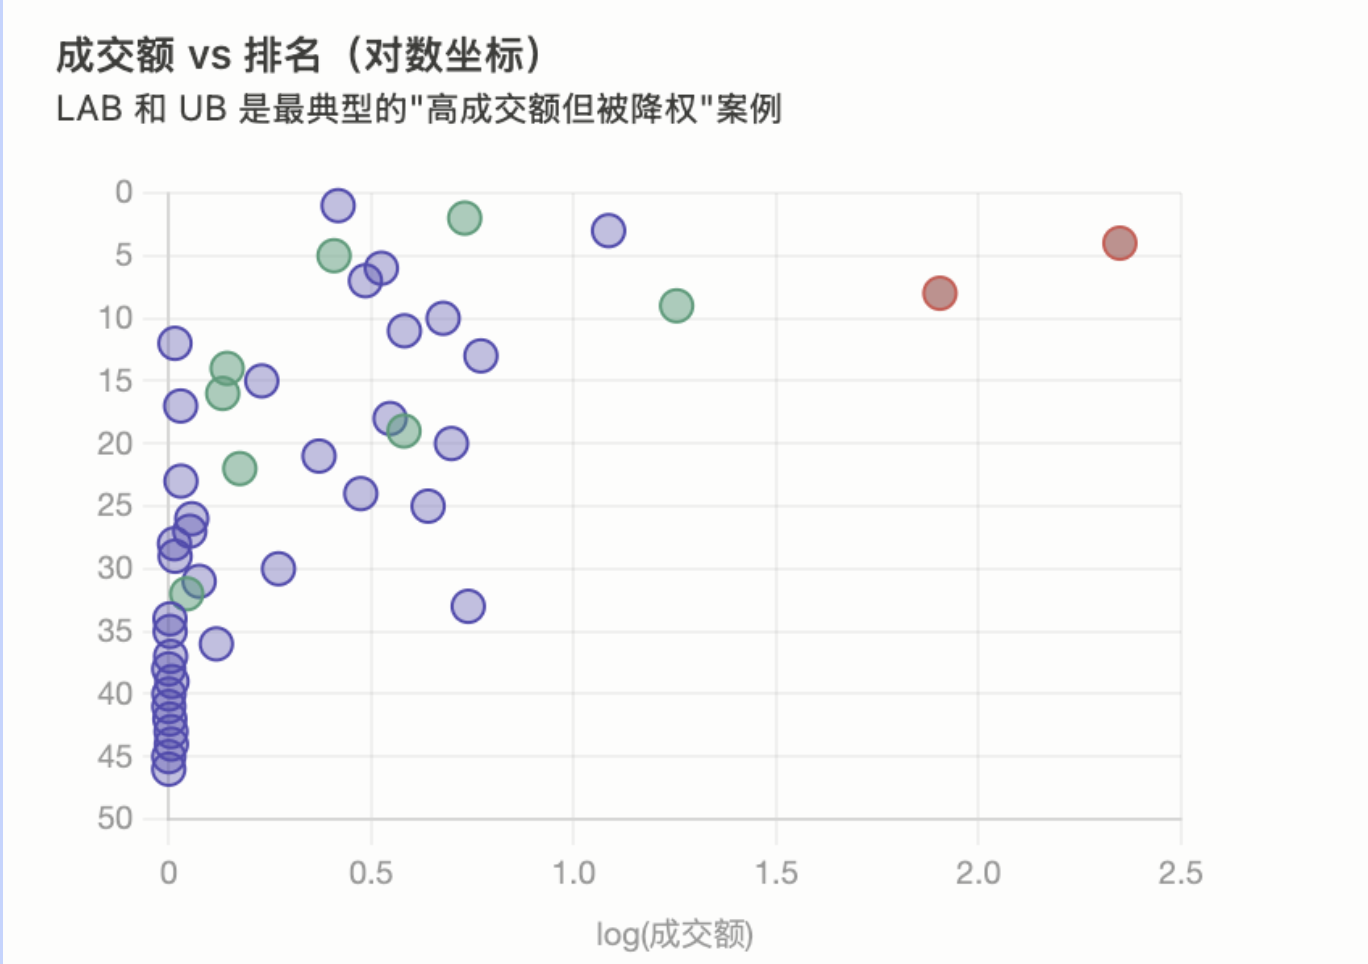
Figure 3 is structured similarly to Figure 2, but the horizontal axis changes to trading volume. The trends are highly similar, indicating that both parameters influence rankings in the same direction. The most important detail is the two red outliers—LAB (with a trading volume of $222M but ranking 4th) and UB (with $79M but ranking 8th)—which stand out significantly on the horizontal axis compared to all other tokens, yet their vertical rankings do not reflect this high volume. This clearly illustrates that high trading volumes may be discounted by the system in conditions of price drops or unusual tx ratios; thus, more is not necessarily better when it comes to volume, and quality outweighs quantity.
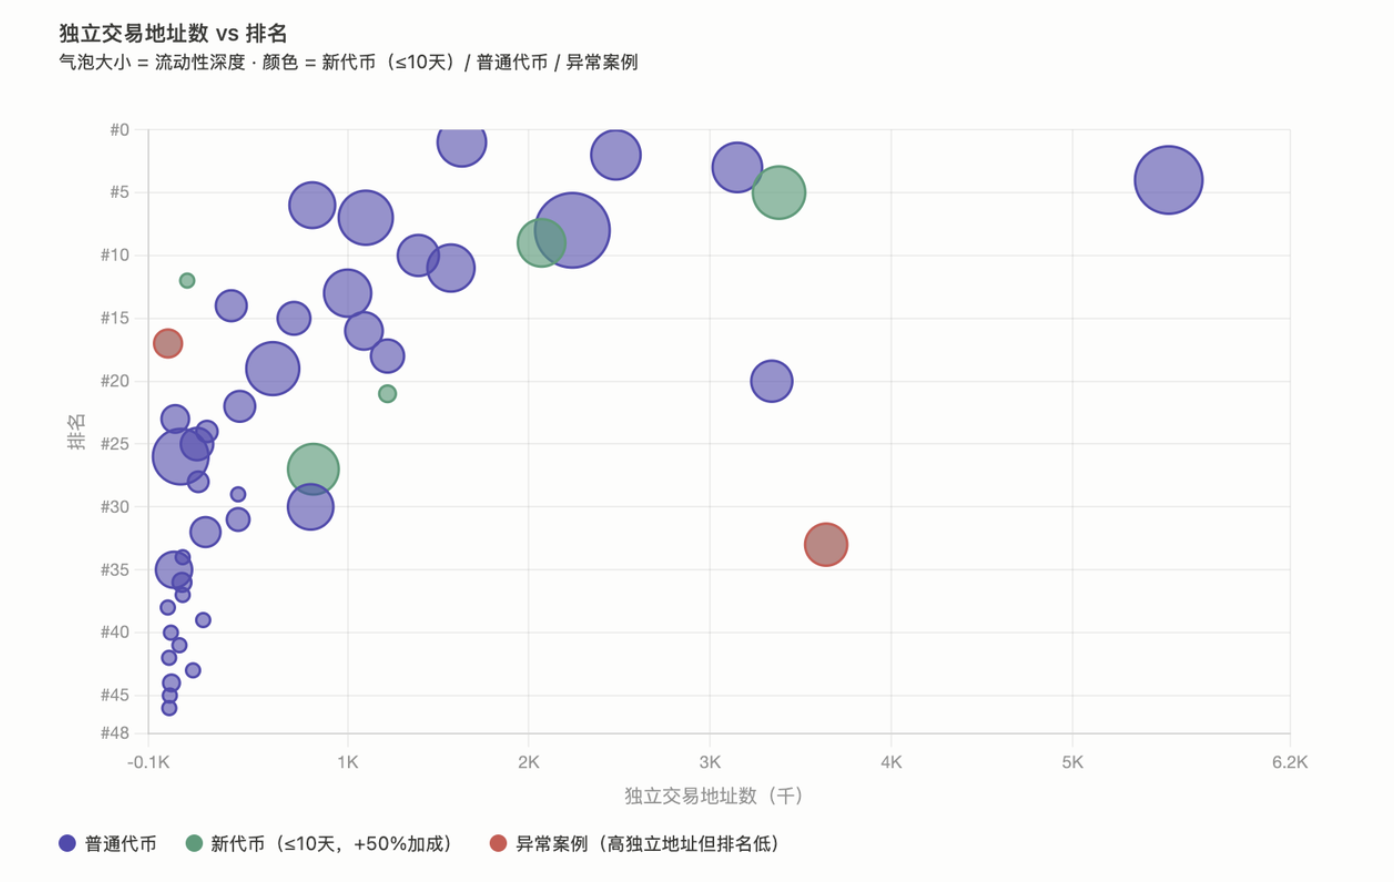
The horizontal axis of Figure 4 represents the number of unique trading addresses (in K), while the vertical axis denotes ranking, with bubble sizes indicating liquidity depth. Colors distinguish three types of tokens: purple for ordinary tokens, green for new tokens (≤10 days), and red for exceptional cases. A loose positive correlation exists in the graph—more unique addresses generally correlate to higher rankings, but this relationship is far from linear, with considerable variance. This aligns with the partial correlation coefficient of r=-0.31: while unique address counts have predictive power, their explanatory ability is limited and they are not the sole determinants of rankings.
Most ordinary tokens are clustered in the unique addresses range of 0–2K, with rankings distributed from 1 to 46. This indicates that solely relying on unique address numbers does not accurately predict rankings—tokens with larger liquidity (larger bubbles), even with the same number of 1K addresses, tend to rank higher, confirming that liquidity is a necessary condition layered on top of unique address numbers.
New tokens like AI, OPG, BLEND, PROS, and ASSET generally have low unique address counts but rank in the mid-tier or even higher. This reflects the direct impact of the +50% new participant bonus, which pulls them up from their expected data ranking position due to the OKX Boost incentive mechanism.
What OKX seeks are "tokens that people are actually buying and selling," not "tokens held by many people." Liquidity serves as the entry threshold (below ~$500K nearly precludes top 20 rankings), while trading volume is a signal of activity, and unique addresses discount volume manipulation distortions.
2. Development of X Launch
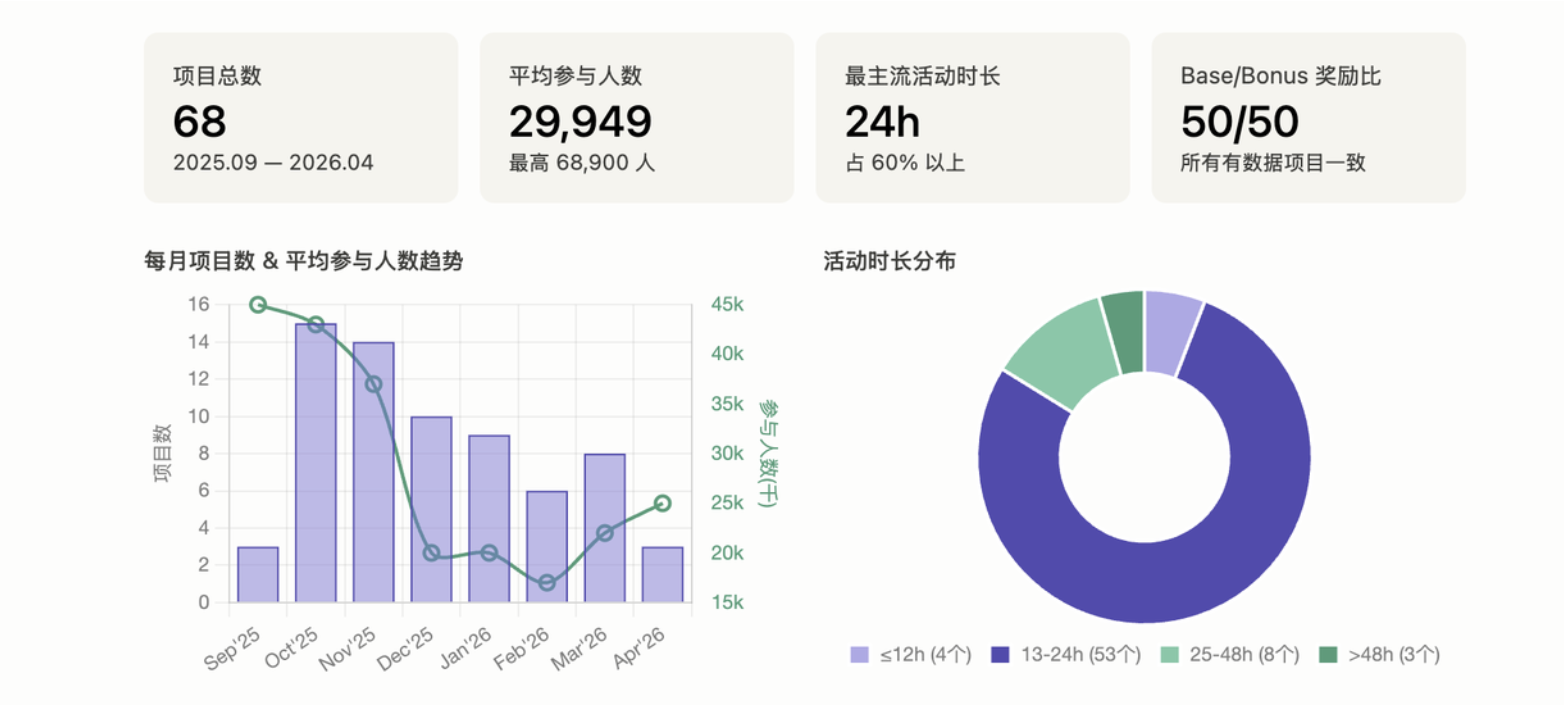
As of March 3, 2026, a total of 68 X Launch projects have closed, with an average participant count of 29,949 and the highest participant count being 68,900 for the Avantis project.
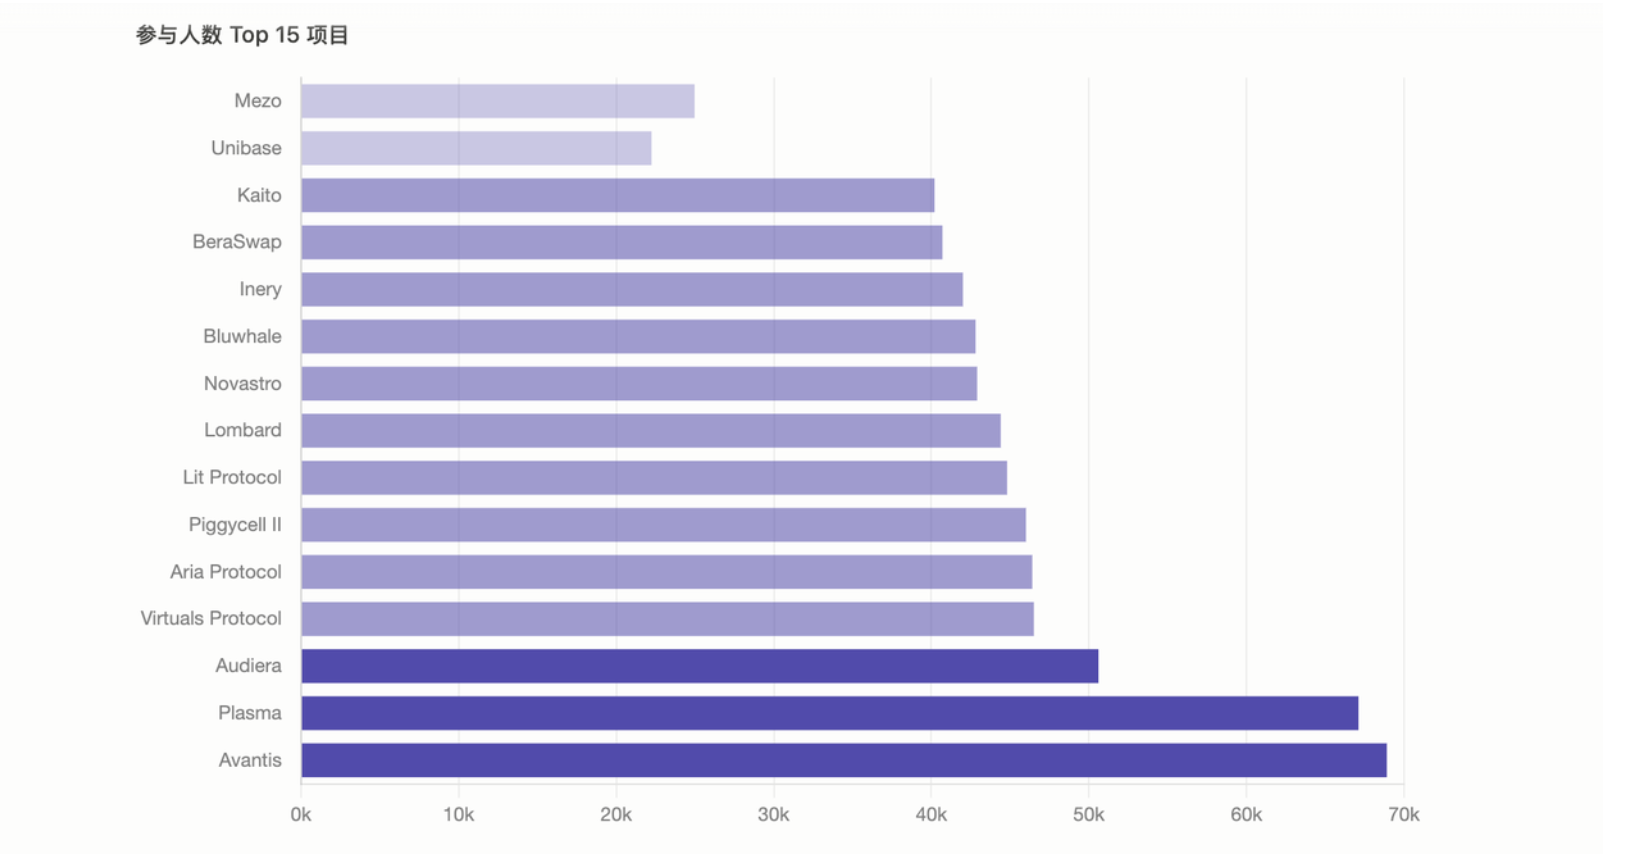
The top three projects by participant numbers are Avantis, Plasma, and Audiera.
Sudden drop in participant numbers: The most obvious pattern is that from November to December 2025, the average number of participants dropped dramatically from 37,000 to 20,000, nearly halving, maintaining around 20,000 until a slight rebound in March-April 2026.
Highly standardized activity duration: Over 78% of projects adopt a 24-hour activity duration, indicating that the platform has formed a set of "standard products." However, a few projects have used 48 hours, 72 hours, or even 94 hours.
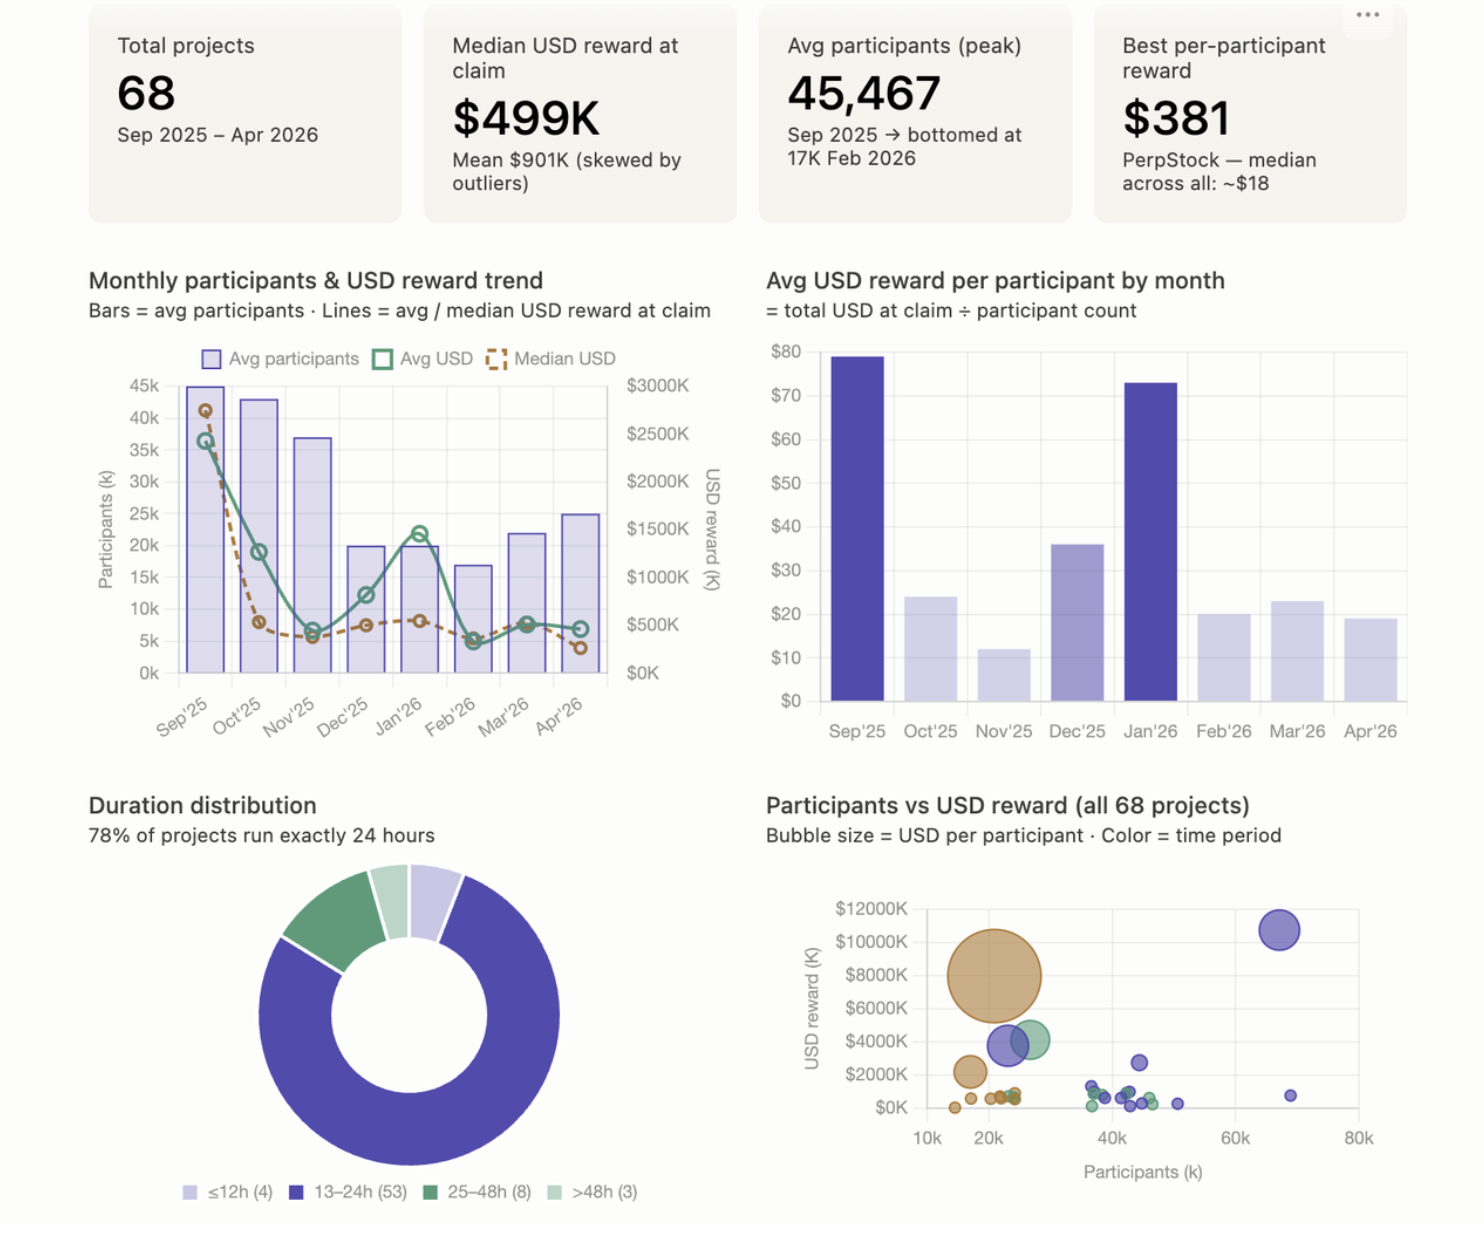
Reward values exhibit a notable right-skewed distribution. The median is around $499K, while the mean is as high as $901K. A few outlier projects (Plasma at $10.7M, PerpStock at $8M, Midnight at $4.1M, LINEA at $3.8M) significantly raise the average. Most projects are concentrated in the $200K–$700K range.
Participant numbers are almost unrelated to USD rewards. A typical contrast is that Avantis attracted 68,900 participants, but the average reward per person was only $11; whereas PerpStock and Spacecoin had significantly fewer participants, yet averaged $381 and $129 respectively. Participant numbers reflect platform popularity, while reward scale indicates project budgets and token price performance post-launch.
User participation has seen a sharp decline. The average number of participants fell from about 45K in September 2025 to about 17K in February 2026, a drop of 62%, before recovering slightly to about 24K in April. This decline is not coincidental; it aligns closely with a cooling sentiment in the overall market and possibly reflects the early user base approaching saturation.
Per capita USD rewards are the most referenceable metric. Most projects offer per capita returns between $10 and $30. Projects exceeding $50 (PerpStock, Spacecoin, LINEA, Plasma, Midnight, Lombard) are exceptions, typically due to strong post-launch token prices or originally generous reward pools.
Activity duration has minimal impact on participant numbers. The 24-hour duration has become the de facto standard, and few activities longer than 48 hours show systematic higher participation levels.
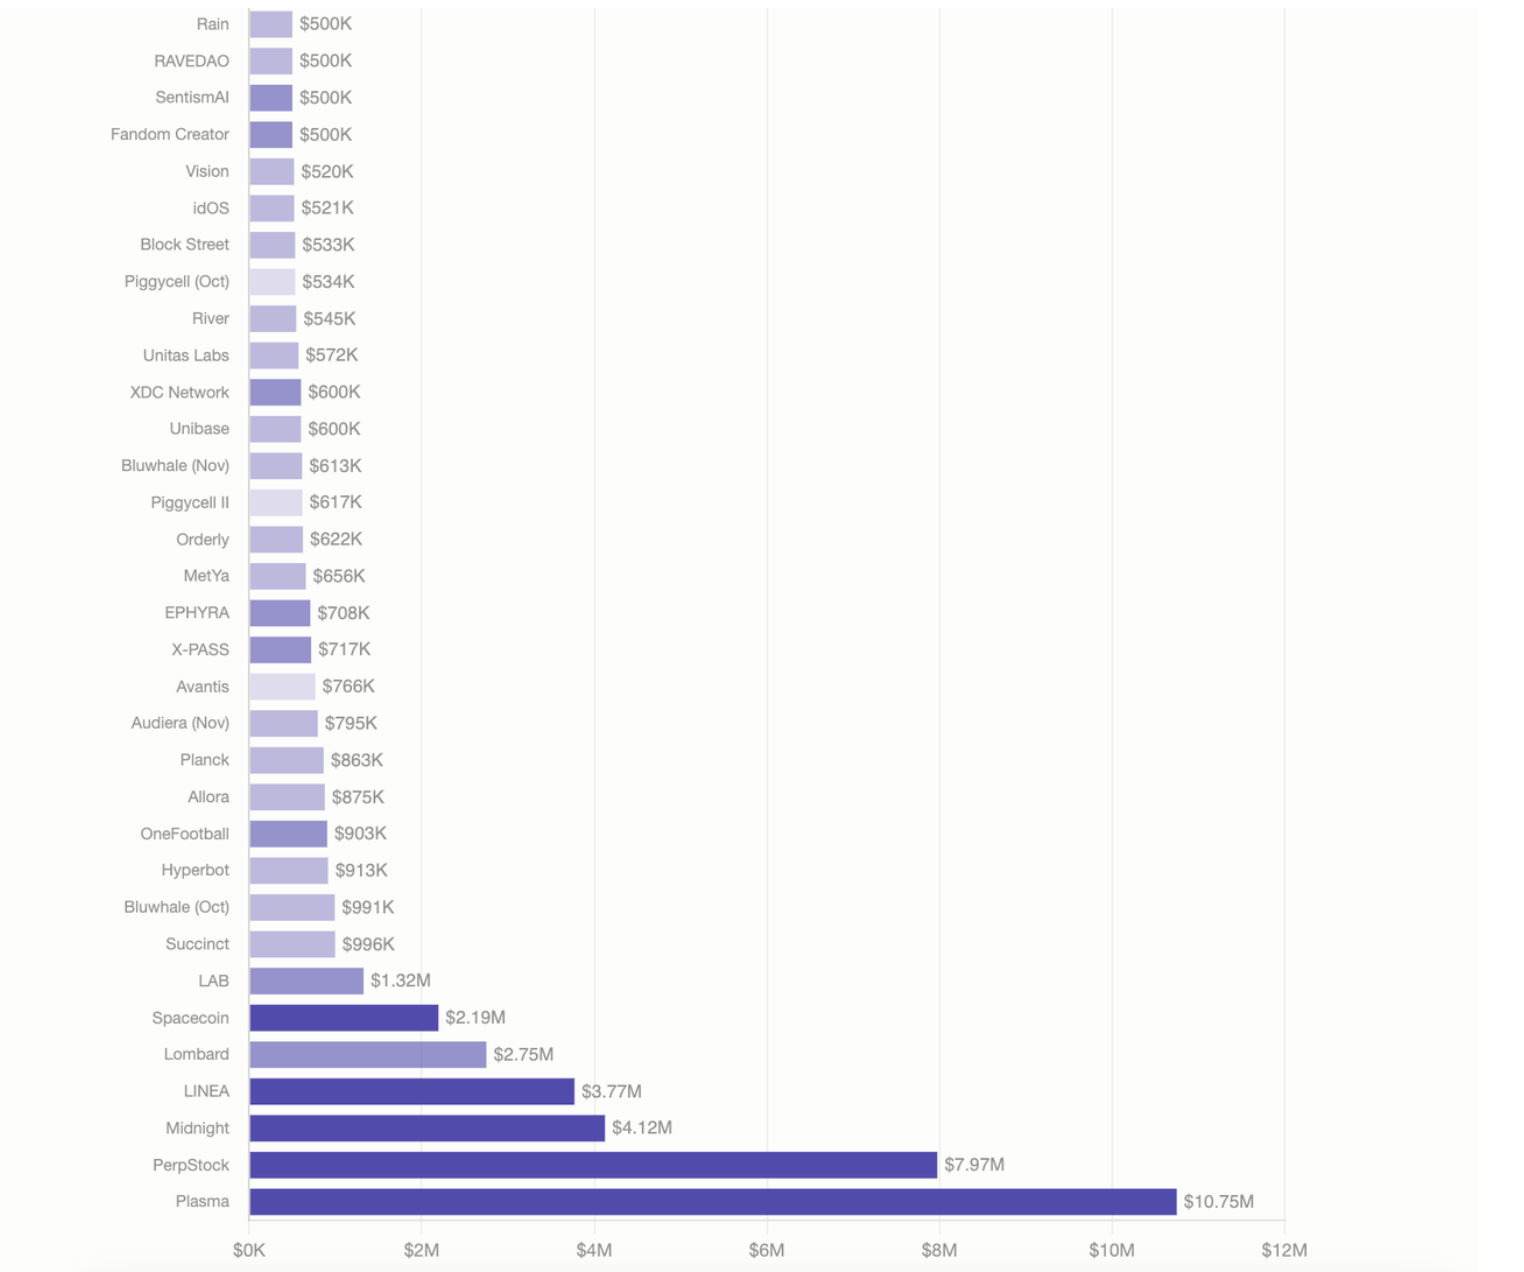
Above is the ranking of projects that distributed a total token value exceeding 500k when users claim X Launch airdrop tokens.
3. X Launch Data Under More Transparent Mechanisms
| Project | Participants | Average Boost | Average Reward | Reward/Boost Ratio |
| Katana | 24,338 | $769 | $8.80 | 1.15% |
| OneFootball | 24,219 | $769 | $37.30 | 4.85% |
| Mezo | 24,971 | $826 | $10.50 | 1.27% |
| Based | 24,076 | $814 | $17.20 | 2.12% |
| Unibase | 22,238 | $867 | $27.00 | 3.11% |
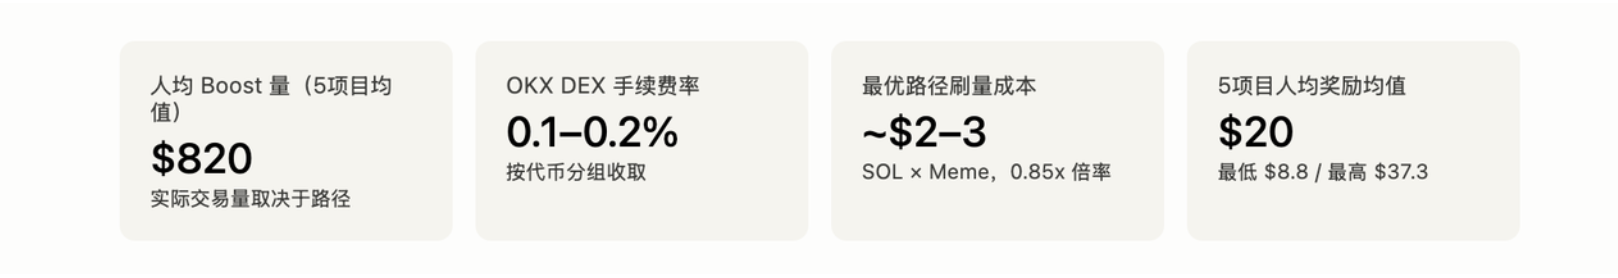
The latest five projects launched under X Launch disclosed their total BOOST amounts. The average total Boost distribution ranges from 750 to 870. The average rewards obtained vary by project. This basic convergence in per capita Boost amount signifies that current users' trading in X Launch is increasingly leaning towards experienced, "semi-professional" participants.
4. User Cost Analysis
| Trading Path | Boost Multiplier | Required Actual Trading Volume | DEX Fee (Round Trip) | Gas (Round Trip) | Total Cost Estimate | Efficiency |
| SOL × Meme | 0.85× | $965 | $2.89 | ~$0.02 | ~$3 | Optimal |
| BSC × Meme | 0.85× | $965 | $2.89 | ~$0.4–0.6 | ~$3.5 | Good |
| ETH × Meme (L2) | 0.85× | $965 | $2.89 | ~$1–2 | ~$4–5 | Fair |
| ETH × G2 Tokens | 0.25× | $3,280 | $9.84 | ~$2 | ~$12 | Poor |
Slippage cost = actual trading volume × slippage % × 2 (round trip) + DEX fee + Gas. We calculated costs under different trading paths, assuming the average target Boost amount is $820, and found that the comprehensive conservative trading cost on BSC is around $3.5.
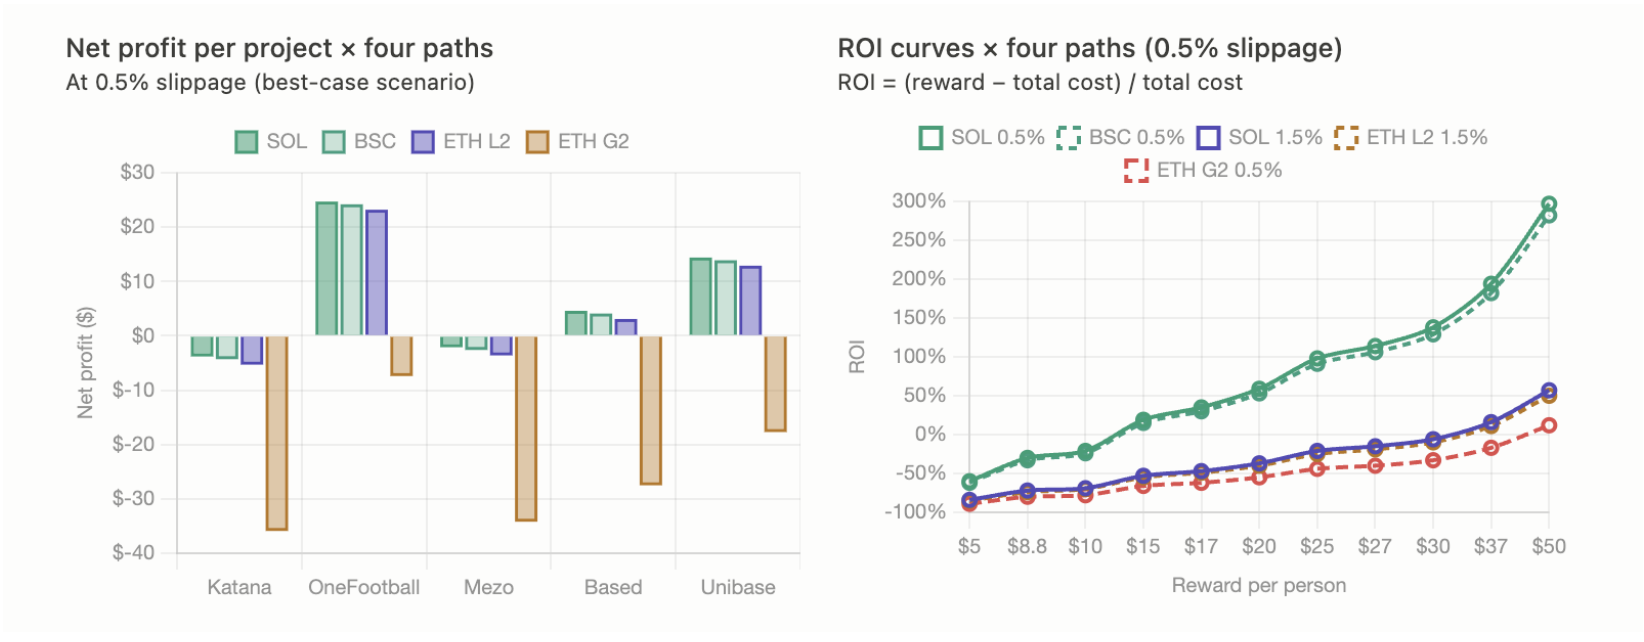
Assuming a slippage of 0.5%, the slippage fee is approximately $9.65, leading to a total cost of around $13, meaning that if the airdrop value is less than $13, it results in a loss.
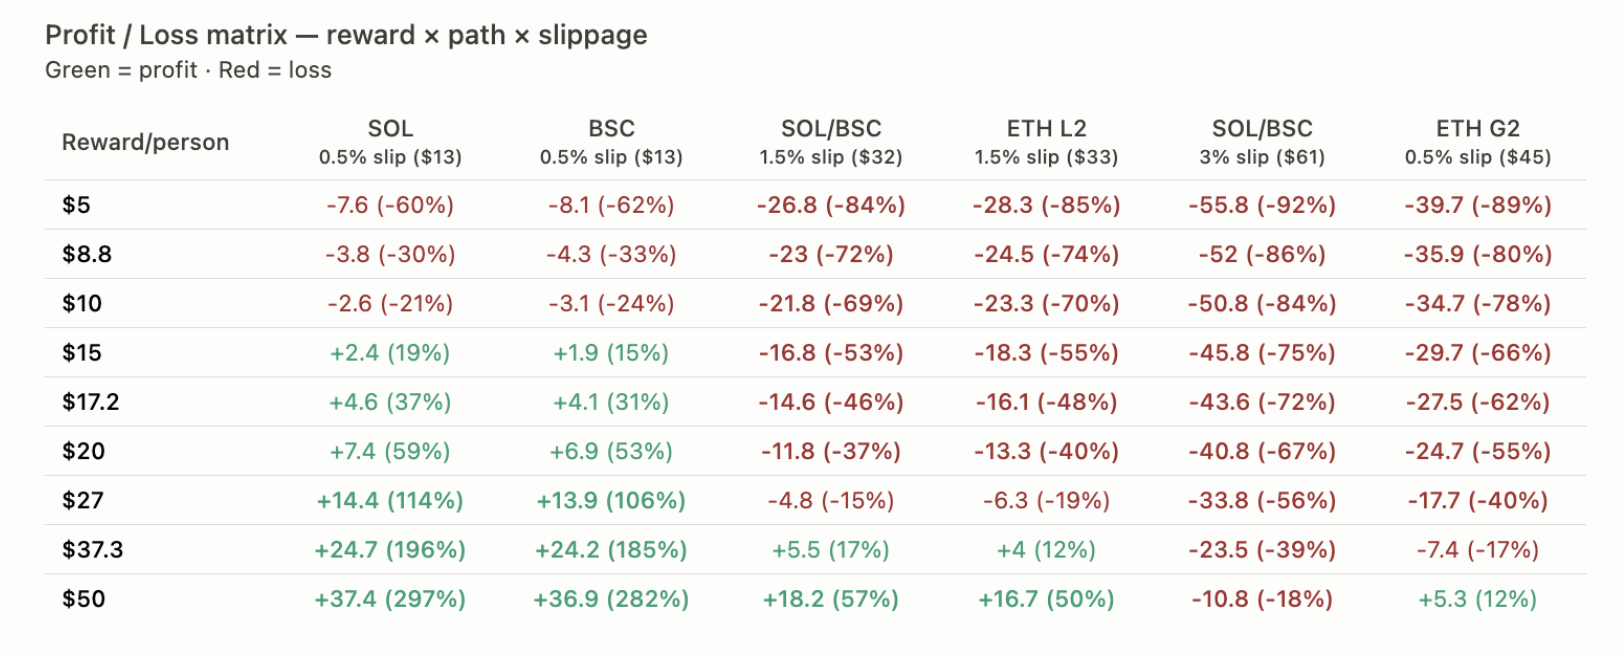
The above figure is a matrix showing users' breakeven points under different slippage levels and varying profits. In this graph, assuming an average reward value of $20 from the latest five projects, if slippage is 1%, it reaches the breakeven point; if slippage is 1.5%, a loss occurs.
In our data, the median average reward of 68 projects is only about $18, indicating that most ordinary users, without careful pair selection, are actually losing money by participating in X Launch, as the loss isn't merely in fees, but in unnoticed slippage incurred from trading Meme coins.
5. Multi-Party Game Mechanism
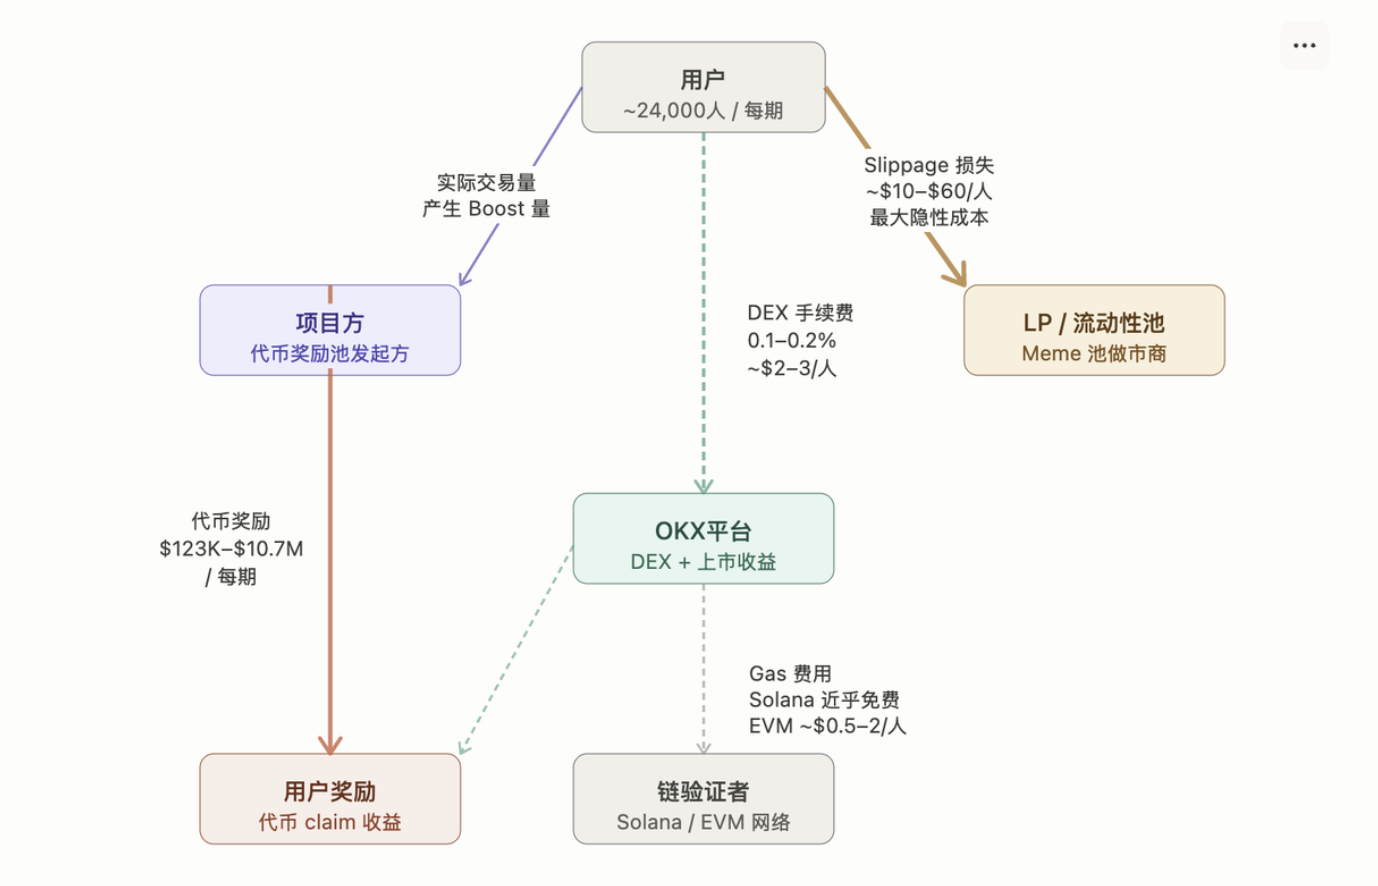
- Users are the starting point of the entire chain, with an average of about 24,000 participants per session. Users conduct actual trading on DEX, generating Boost that is transmitted to the project team, while simultaneously paying DEX fees (0.1–0.2%, about $2–3/person) to the OKX platform and incurring slippage losses ($10–60/person), which flow to liquidity providers/liquidity pools.
- Project teams initiate the token reward pool, receiving data from users' trading behaviors and issuing token rewards, with the scale fluctuating between $123K and $10.7M.
- The OKX platform occupies a central position, collecting DEX fees while also benefiting from the token listing revenues. The platform further sends trading requests to be settled on-chain by chain validators (on Solana or EVM networks), with users required to pay Gas fees, which are nearly free on Solana and about $0.5–2/person on EVM.
- LP/liquidity pools act as market makers for Meme and passively absorb slippage losses incurred from user trades, becoming implicit beneficiaries.
Overall, funds flow out from users, dispersed to OKX, LP, and chain validators, while project teams drive user trading volume through token incentives, forming a closed loop centered on trading activity. Although some value partially overflows to LPs on other public chains, most OKX Launch activities last only about 24 hours, resulting in limited spillover benefits. After X Launch ends, boosting on the OKX Boost leaderboard serves as a primary income source for OKX. For instance, on May 3, 2026, the 24-hour trading volume was 371.88 million, with daily DEX fees ranging between approximately 3.7 and 7.4 million.
免责声明:本文章仅代表作者个人观点,不代表本平台的立场和观点。本文章仅供信息分享,不构成对任何人的任何投资建议。用户与作者之间的任何争议,与本平台无关。如网页中刊载的文章或图片涉及侵权,请提供相关的权利证明和身份证明发送邮件到support@aicoin.com,本平台相关工作人员将会进行核查。


