Tonight, market sentiment is complex, with two pieces of news worth highlighting. First, Federal Reserve officials have once again released hawkish signals, emphasizing that interest rates need to remain stable for the long term, which directly suppresses rate cut expectations. Following the better-than-expected non-farm payroll data, the probability of a rate cut in June is only 6.1%. The high-interest rate environment continues to suppress the valuations of risk assets, which is bearish for BTC and ETH. Second, there has been a subtle change in the Middle East situation, with Iran assessing the U.S. 14-point peace proposal, showing signs of easing geopolitical risks. However, Trump has simultaneously issued an ultimatum, and uncertainty remains high. These two pieces of news present a mixed picture, and the market direction is not clear in the short term, but technical indicators have already given clear signals; let's look at the data directly.
Current Price and Time
The current time is May 6, 23:21, with BTC priced at 81,741 USDT, a 24-hour increase of 0.24%, overall in a narrow range of fluctuations. The Fear and Greed Index is at 46, indicating a neutral to cautious market sentiment, with strong wait-and-see behavior among funds.
Multi-Cycle Status Overview
On the daily level, MA5=79,952, MA10=78,383, MA30=76,092, with the moving average system in a bullish arrangement. The MACD histogram is at 86.94, and the DIF is above the DEA. The RSI is at 65.91, in a neutral to strong zone. The daily trend remains upward, but momentum has weakened, with prices repeatedly testing around 82,000.
On the 4-hour level, MA5=81,622, MA10=81,400, MA30=79,699, with the moving averages in a bullish arrangement. The MACD histogram is at 86.94, with DIF at 975.01 and DEA at 888.07, indicating that bullish momentum is still present. However, the RSI is at 63.24, slipping from the overbought area, pointing to short-term adjustment pressure.
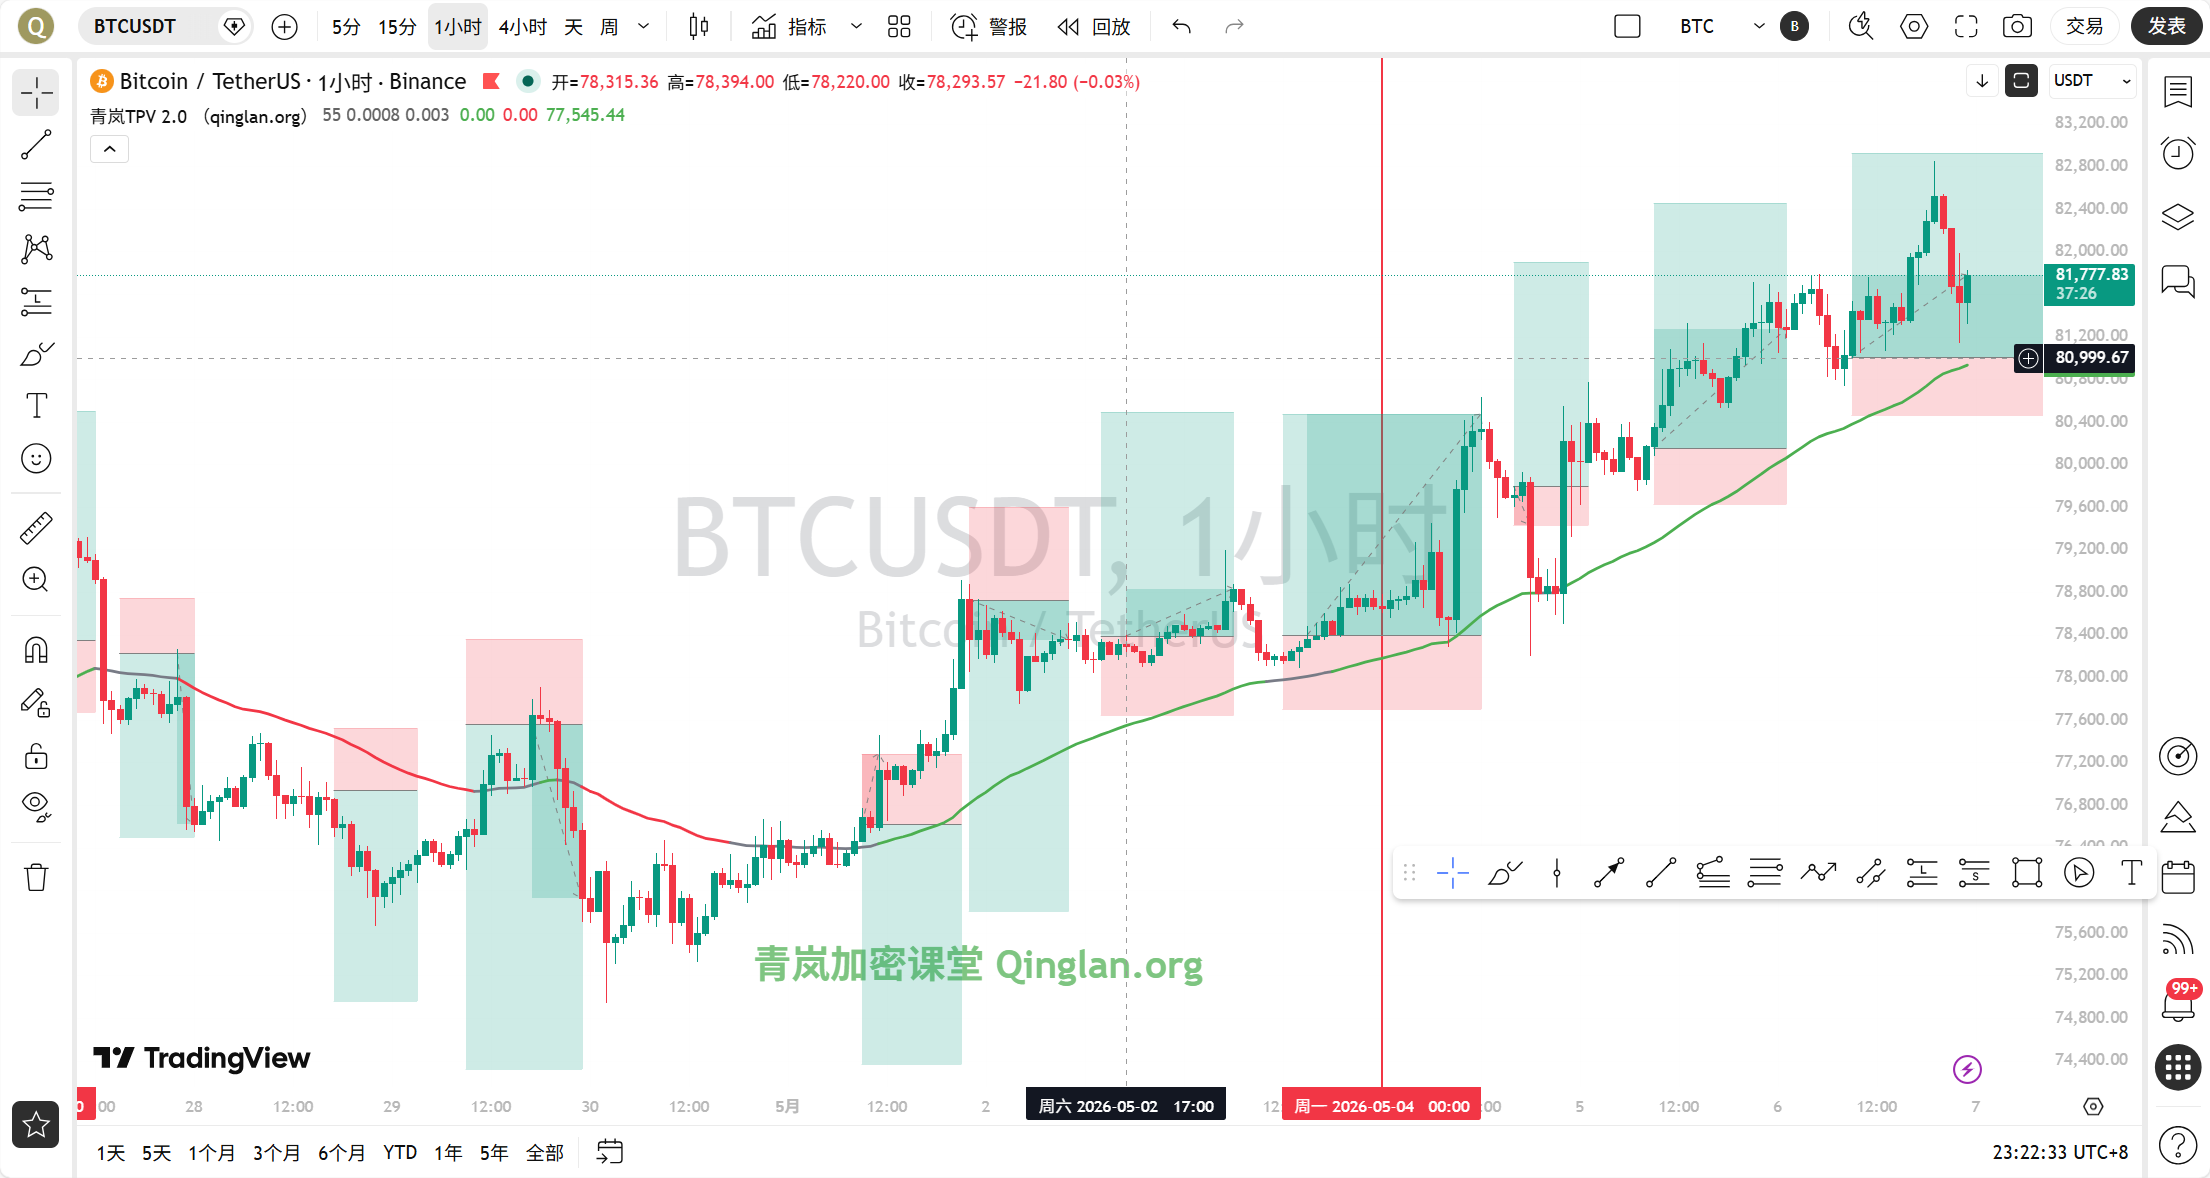
On the 1-hour level, MA5=81,936, MA10=81,875, MA30=81,496, with the moving average system starting to flatten. The MACD histogram is at -34.80, with DIF at 251.77 and DEA at 286.57, showing a death cross signal. The RSI is at 54.75, falling back from a high position to a neutral area. EMA55 is at 80,951, with the current price at 81,741, about 0.98% above EMA55, indicating that the bullish trend is still valid, but momentum has significantly weakened.
On the 15-minute level, MA5=81,635, MA10=81,727, MA30=81,989, with the moving average system in a bearish arrangement. The MACD histogram is at -85.67, with DIF at -75.52 and DEA at 10.15, running under a death cross. The RSI is at 35.40, entering a weak zone. Short positions are dominant, with prices under clear pressure.
TPV Signal Verification
According to the Qinglan TPV system, we use the 1-hour EMA55 as the dividing line for bullish and bearish positions. The current price is 81,741, above EMA55 at 80,951, confirming the bullish trend area. In the last 8 hours of 1-hour candlesticks, the closing prices have been above EMA55 8 out of 8 times, with 0 crossovers, and the price is 0.98% away from EMA55, not meeting the oscillation threshold, remaining in a one-sided bullish trend.
Conditions for Going Long Verification: First, the price has stabilized above the 1H EMA55, with two consecutive 1-hour closing prices above EMA55, meeting the condition. Second, in terms of support stabilization, the current price is around 81,741, and there has been no significant long lower shadow or bottom formation, making support signals unclear. Third, regarding the exhaustion of downward momentum, the MACD histogram has shortened for two consecutive periods, but the RSI has fallen from 54.75 and has not rebounded from below 30; no bullish engulfing pattern has appeared. In summary, both the support stabilization and momentum exhaustion signals in the conditions for going long are insufficient, making it unsuitable to chase long positions at this time.
Conditions for Going Short Verification: First, the price is under pressure below the 1H EMA55; the current price is above EMA55, so the condition is not met. Second, in terms of encountering resistance, there has been a long upper shadow on the 1-hour level, with prices encountering resistance near 82,000 and initially forming a top formation. Third, regarding the weakness of the rebound, the MACD histogram has shortened for two consecutive periods, with the RSI falling from a high position and a bearish engulfing signal appearing. Although the first condition for going short is not met, the price is under pressure and falling back above EMA55, which corresponds to a pullback in a bullish trend, requiring caution against false break risks.
According to the comprehensive TPV system, we are currently in a bullish trend area, but momentum is weakening, indicating a short-term need for a pullback. It is recommended to adopt a wait-and-see approach or take light short positions, with strict stop-loss measures.
On-Chain/Funding Aspects
In terms of on-chain data, the Fear and Greed Index is at 46, indicating neutral to cautious sentiment. BTC's market share is at 58.63%, with funds still rotating within BTC. In key news, a whale has deposited 166,000 ETH into Binance, valued at 395 million USD, which may trigger selling pressure, negatively impacting ETH and market sentiment in the short term. Hawkish comments from Federal Reserve officials suppress rate cut expectations, maintaining a high interest rate environment that continues to suppress the valuations of risk assets. In terms of geopolitical aspects, uncertainties remain in the Iran situation, but U.S. stock futures are surging across the board, indicating a slight recovery in risk appetite. Overall, the funding aspect is slightly bearish, but external sentiment provides some support.
Key Offensive and Defensive Levels
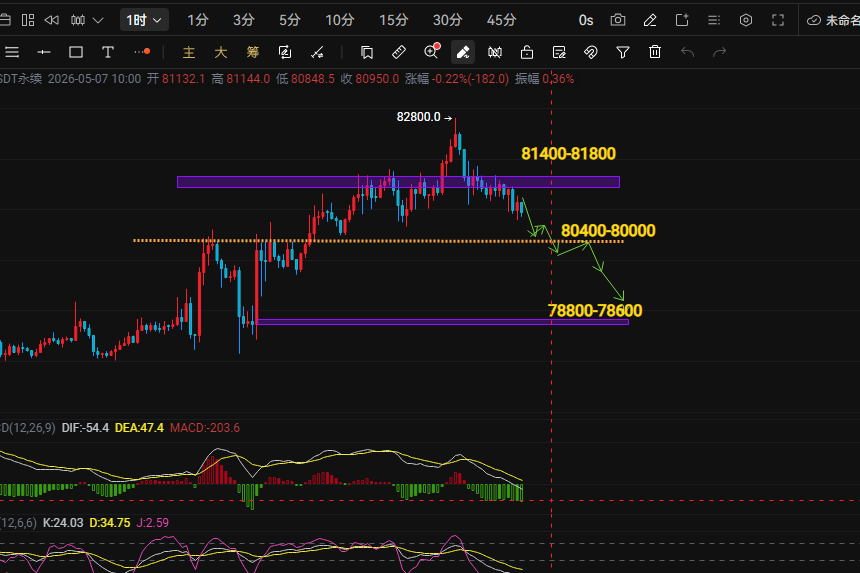
Upper resistance level: 82,000-82,400, which is the region of the 1-hour MA30 and previous highs, as well as near the 4-hour MA5. A breakthrough would look towards 84,000. Lower support level: 80,950-81,200, which is the region of the 1-hour EMA55 and 4-hour MA10. A breakdown could signal a weakening bullish trend, with further focus on the 80,000 round number.
Trading Thoughts
Direction: In the short term, looking for a pullback, taking light short positions, but the effectiveness of EMA55 support needs to be confirmed.
Entry Conditions: If the price rebounds to the 82,000-82,200 area and there is a long upper shadow or top formation on the 15-minute level, with the MACD histogram continuing to shorten, light short positions can be taken. If the price breaks below 81,200, confirmation of the pullback can lead to added short positions.
Stop-Loss Level: Set stop-loss for short positions above 82,500; if broken, exit the positions.
Target Levels: First target 81,200, second target 80,500, third target 80,000.
If prices show significant volume stagnation or a long lower shadow in the 80,950-81,200 area, consider taking light long positions, setting stop-loss below 80,800, and targeting 82,000-82,400.
Risk Warning
Currently, the battle between bulls and bears is fierce, with high uncertainty regarding geopolitical and macro news; it is recommended to control positions, implement strict stop-loss measures, and avoid chasing highs and lows.
Follow Qinglan Crypto Classroom to seize more trading opportunities! Welcome to visit the official website www.qinglan.org
📊 Qinglan TPV Trading Strategy Backtest Reference
🕒 Last Backtest Time 05-06 07:00:01
Total Analysis: 1330 Backtests: 1324 Accuracy Rate: 67.2% (890/1324)
免责声明:本文章仅代表作者个人观点,不代表本平台的立场和观点。本文章仅供信息分享,不构成对任何人的任何投资建议。用户与作者之间的任何争议,与本平台无关。如网页中刊载的文章或图片涉及侵权,请提供相关的权利证明和身份证明发送邮件到support@aicoin.com,本平台相关工作人员将会进行核查。