Dear friends, I am Sister Qinglan. This morning, the market was influenced by two significant pieces of news. On one hand, the Federal Reserve collectively took a hawkish stance, warning that inflation risks do not rule out further interest rate hikes, directly suppressing the sentiment of risk assets; on the other hand, the Hyperliquid giant whale long positions reached a new high, indicating that large funds have bullish confidence at the current position. These two forces, one bearish and one bullish, caused Bitcoin to become stuck around $80,955. In the Qinglan Crypto Classroom, we always emphasize data-driven analysis rather than speculation, so today we will use the TPV system to analyze the current market situation.
Current Price and Time
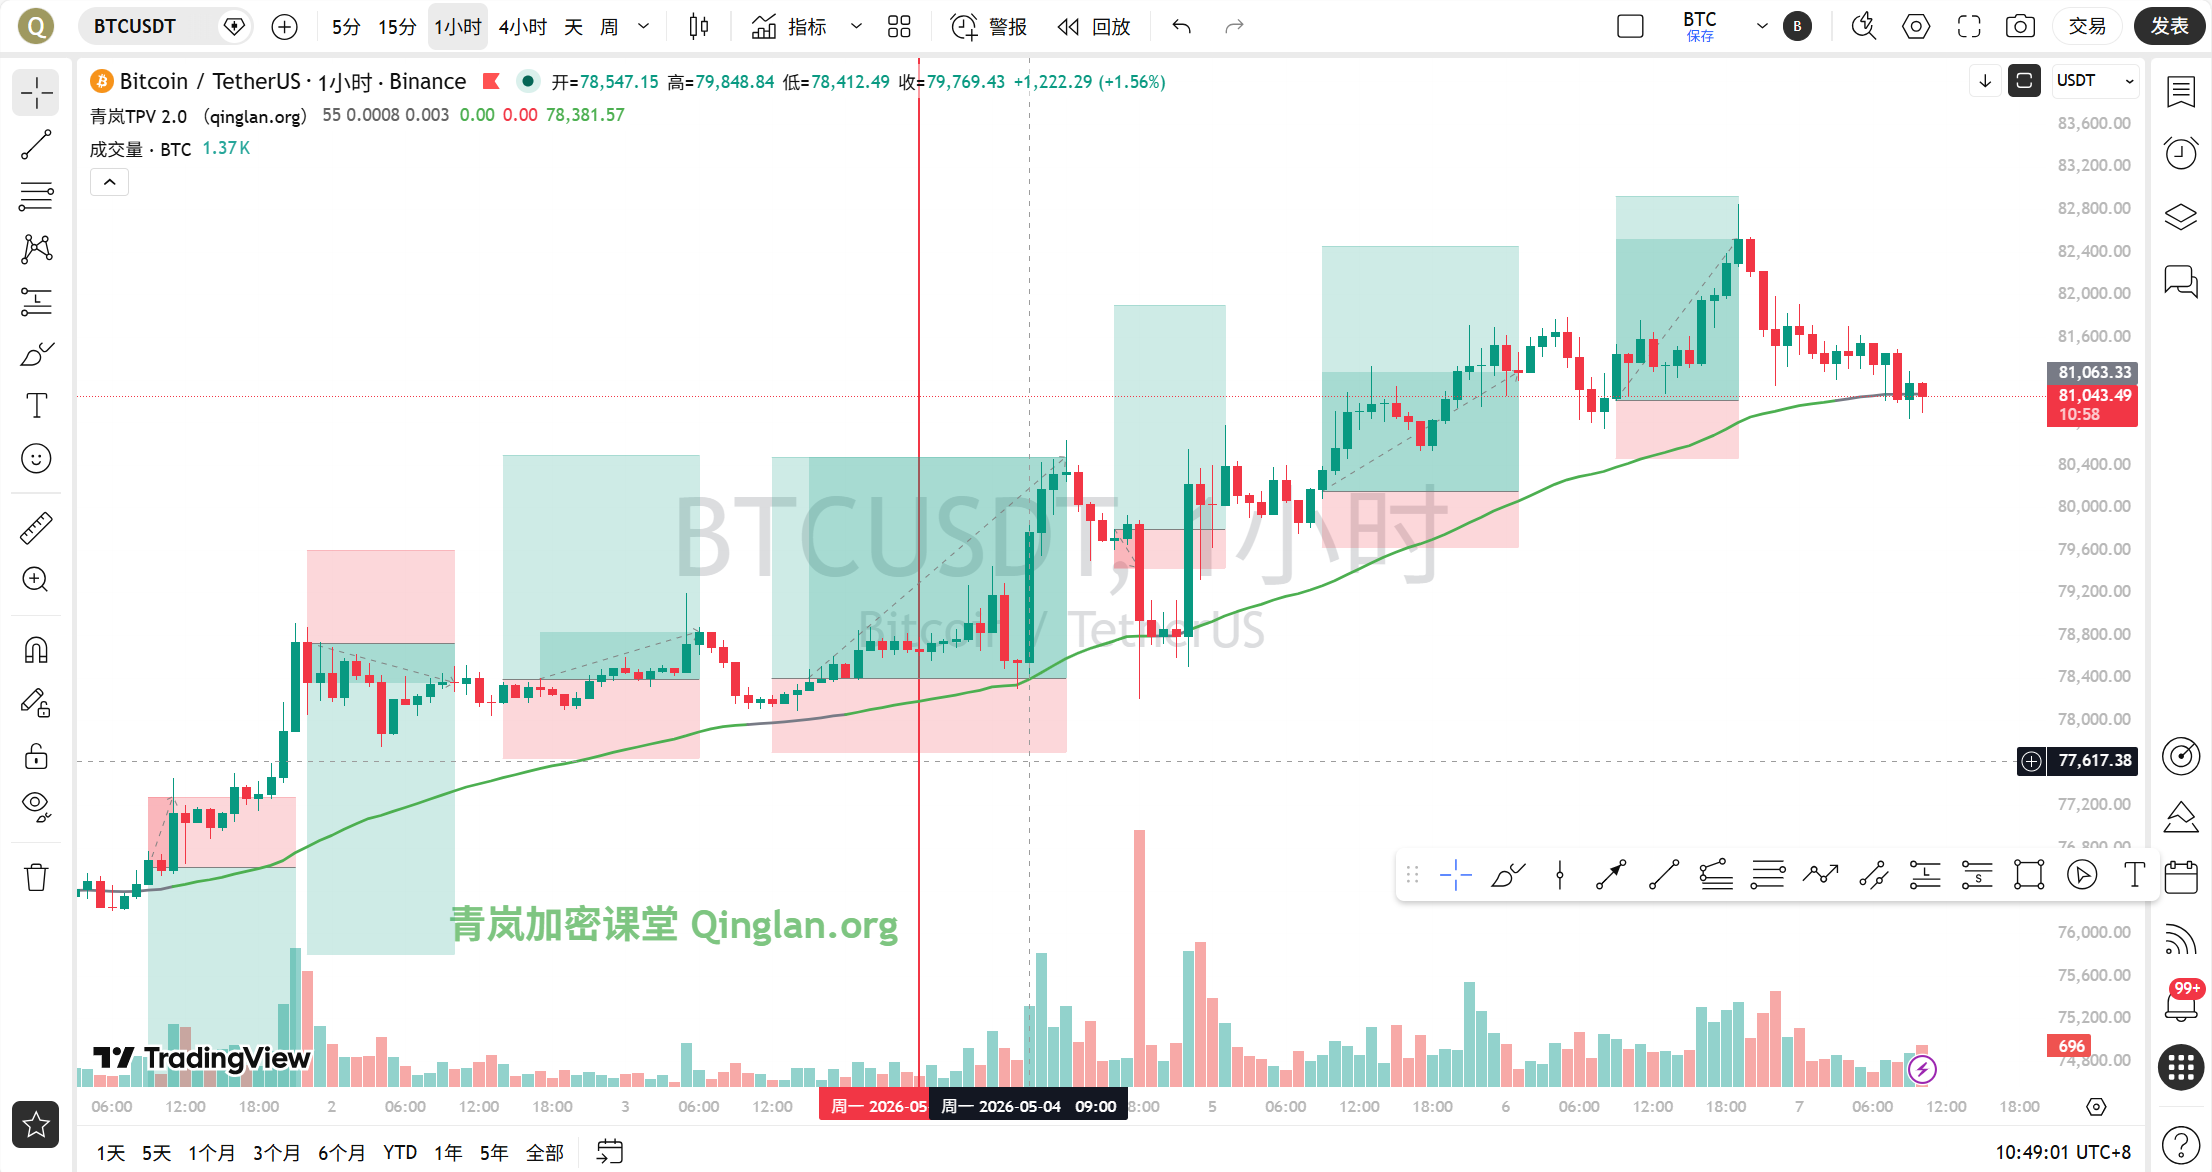
The current time is May 7 at 10:36, with Bitcoin priced at 80,955 USDT, a 24-hour increase of 0.67%. The price is near the 1-hour EMA55, indicating a tight fluctuation state, and the direction selection window is narrowing.
Multi-Cycle Status Overview
First, let's look at the daily chart. The daily MA5 is at 80,347, and the MA10 is at 78,712, with the moving average system showing a bullish alignment. The MACD bar is at 181.69, with DIF above DEA, indicating an overall bullish trend. The RSI is at 61.92, in a neutral to strong zone, with no overheating signals. The daily structure is healthy, but the upward momentum has slowed.
In the 4-hour level, the MA5 is at 81,618, the MA10 is at 81,507, and the price is operating below the moving averages. The MACD bar is at -78.97, and after DIF crossed below DEA, it has continued to weaken, with bearish momentum being released. The RSI is at 57.11, falling back from the overbought zone, with short-term momentum slightly bearish.
In the 1-hour level, the MA5 is at 81,185, the MA10 is at 81,316, and the price is running below the moving averages. The EMA55 is at 81,089, and the current price of 80,955 is below the EMA55. The MACD bar is at -104.50, with DIF and DEA below the zero axis, indicating significant bearish momentum. The RSI is at 25.46, entering the oversold area, suggesting a short-term rebound demand.
In the 15-minute level, the MA5 is at 81,046, the MA10 is at 81,086, and the price is fluctuating near the moving averages. The MACD bar is at -25.09, with DIF and DEA below the zero axis, indicating weakening bearish momentum. The RSI is at 40.21, in a neutral and low position.
In summary, the daily bullish trend has not broken, but the bearish momentum is dominant at the 4-hour and 1-hour levels, with short-term prices repeatedly testing near EMA55, belonging to a sensitive phase of bullish and bearish competition.
TPV Signal Verification
According to the Qinglan TPV system, we use 1-hour EMA55 as the boundary between bullish and bearish. The current price of 80,955 is below EMA55 at 81,089, determining the area as a bearish trend zone.
Check the short-selling conditions. First, the price is under pressure below EMA55. In the past 8 hourly candlesticks, the closing price was above EMA55 6 times and crossed it 3 times, indicating that the price has repeatedly crossed above and below, not continuously closing 2 candlesticks below EMA55; thus, condition one is not fully satisfied. Second, there is a resistance pattern. The recent hourly candlestick showed a long upper shadow, falling back after touching 81,300, indicating pressure above. Third, the rebound lacks strength. The MACD bar has shortened for 2 consecutive periods, but the RSI has rebounded from 25.46, with accumulating momentum after being oversold. In summary, the current signal leans towards bearish, but condition one has flaws, making it a weak bearish area rather than a strong bearish one.
The auxiliary oscillation data shows that the absolute amplitude of the price from EMA55 is 0.17%, less than the 0.3% threshold, indicating a tight fluctuation. The past 8 candlesticks crossed 3 times, close to the oscillation determination standard. Therefore, the system suggests an increased probability of oscillation, and it is not recommended to actively chase shorts; instead, one should wait for clearer signals.
On-Chain Funding Situation
The fear and greed index is at 46, in a neutral range, indicating that market sentiment is not extreme. The BTC market share is at 58.58%, maintaining a high level, suggesting that funds are still seeking refuge in Bitcoin. On-chain data shows that whales on Hyperliquid have reached new highs in long positions, which is a positive signal, but the Federal Reserve's hawkish rhetoric has suppressed risk appetite. Overall, the funding situation is neutral to bullish, but short-term sentiment is affected by macro factors.
Key Defense and Attack Levels
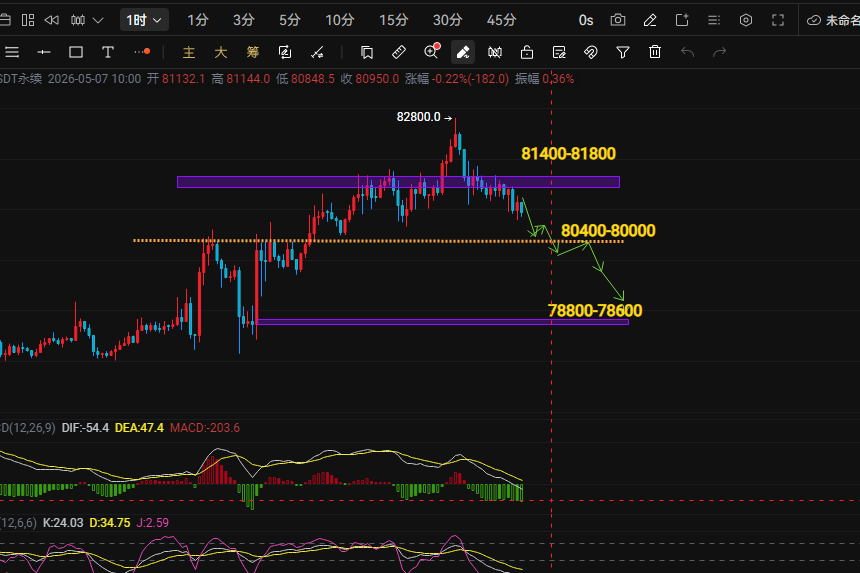
The first resistance level above is the 1-hour EMA55 at 81,089, which is the line between bullish and bearish. If the price stabilizes at this level, the bulls will regain control. The second resistance level is the 4-hour MA5 at 81,618, which is a short-term bearish defense line. The first support level below is the daily MA5 at 80,347, which is the baseline for the bullish trend. The second support level is the daily MA10 at 78,712; if broken, the trend will weaken.
Trading Ideas
Direction: The current system determines it is a bearish trend area, but the probability of oscillation is increasing, so it is not recommended to directly chase shorts. Wait for the price to rebound near the resistance level, and if a top formation or long upper shadow appears, consider lightly trying shorts. If the price directly breaks below the support at 80,347, one can follow up with shorts.
Entry Conditions: To short, the price must rebound to the 81,089-81,300 area, and the 1-hour candlestick should show a long upper shadow or a top formation, while the MACD bar weakens again. To long, the price must stabilize above 81,089, and the closing price of 2 consecutive hourly candlesticks must be above EMA55, while the MACD bar turns positive.
Stop Loss Levels: The stop loss for shorts is set above 81,500, and the stop loss for longs is set below 80,300.
Target Levels: The first target for shorts is 80,347, and the second target is 78,712. The first target for longs is 81,618, and the second target is 82,500.
Risk Warning
The current price is fluctuating tightly, with rapid bullish and bearish transitions; positions should be controlled at light volume to avoid chasing highs and cutting losses.
Follow the Qinglan Crypto Classroom to seize more trading opportunities! Welcome to visit the official website www.qinglan.org
📊 Qinglan TPV Trading Strategy Backtest Reference
🕒 Last Backtest Time 05-07 07:00:01
Total Analysis: 1353 Backtest: 1347 Accuracy: 66.9% (901/1347)
免责声明:本文章仅代表作者个人观点,不代表本平台的立场和观点。本文章仅供信息分享,不构成对任何人的任何投资建议。用户与作者之间的任何争议,与本平台无关。如网页中刊载的文章或图片涉及侵权,请提供相关的权利证明和身份证明发送邮件到support@aicoin.com,本平台相关工作人员将会进行核查。