Academician of the Cryptocurrency Circle: Will Ethereum fall below 2300 on May 8? Is this fluctuation a washout or a downward continuation? Latest market analysis and operational suggestions
The current price of Ethereum is 2290. Has this wave of fluctuations confused many people again? After plunging from a high point above 2400, it is now jumping around near 2295. Many friends who chased the high likely have already been holding their positions, and those who traded during the day have already stopped loss, while trend traders have entered. The cryptocurrency market is all about rhythm; this wave is not a one-sided decline but the main force cleaning out floating chips. I will clearly break down the key signals on the daily and 4-hour charts for everyone—where the resistance is, where to catch the bottom, and how to set stop losses—I'll explain it all clearly. After reading this, the next time you encounter such fluctuations, you won't be easily harvested back and forth.
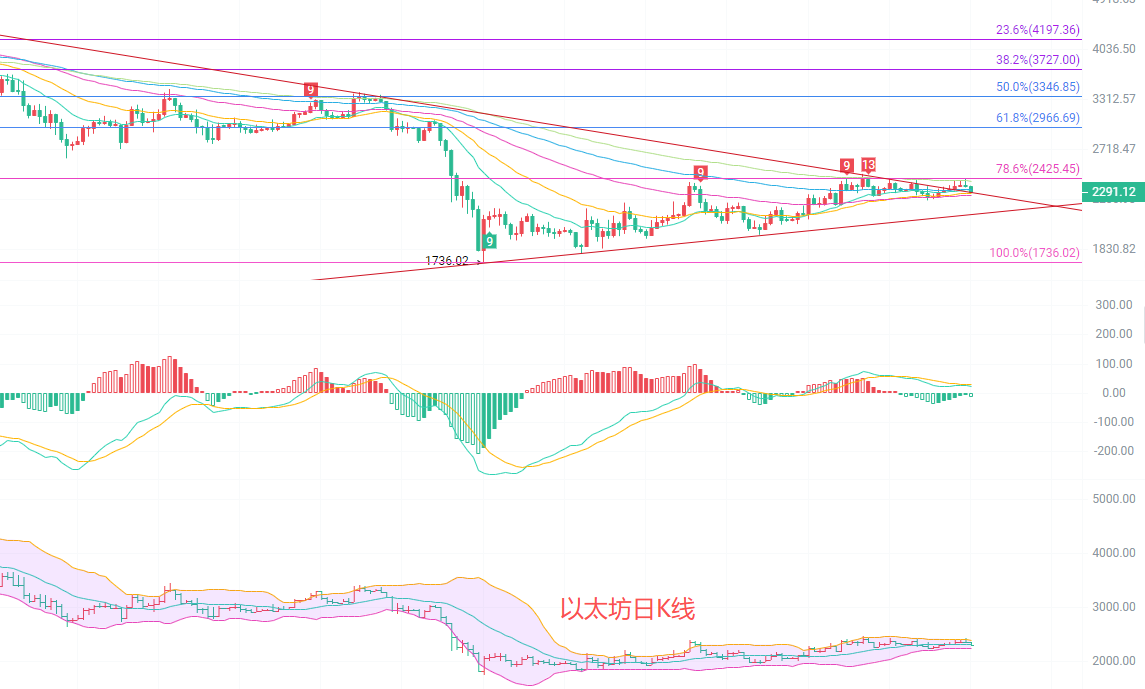
The daily K-line shows a decline of 2.32% within the day, closing with a bearish candle that has upper and lower shadows. The price has fallen back to near the middle track of the Bollinger Bands, currently being suppressed by the EMA15 line at 2314, with support below at the EMA30 line at 2286 and the lower track of the Bollinger Bands at 2247. The MACD indicator shows red bars continuing to shrink, and DIF is turning down close to DEA, with upward momentum clearly weakening. The Bollinger Bands are slightly narrowing, with the upper track at 2385 forming strong resistance and the lower track at 2247 providing support. In the short term, it is in the correction phase after a high-level fluctuation and is still operating within the 2200-2400 range, without forming a clear breakout signal.
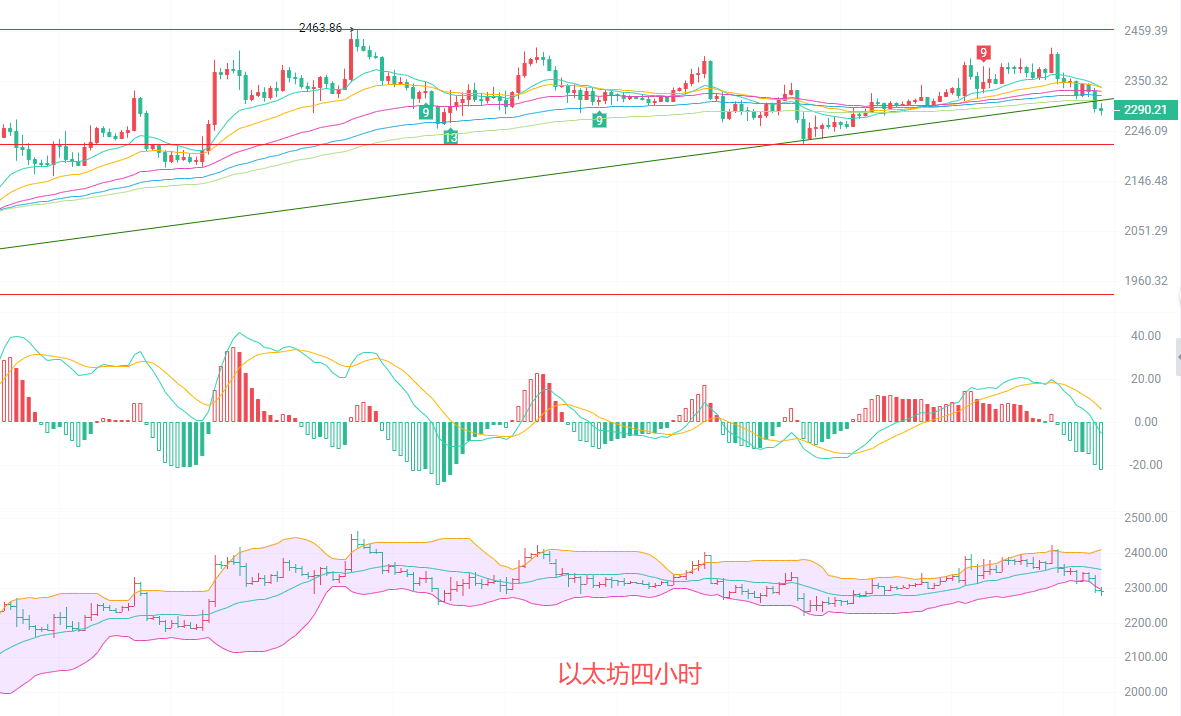
The four-hour Ethereum price has fallen below the EMA15 and EMA30 short-term moving averages, currently located near 2296, clearly suppressed by the EMA60 line at 2329. The MACD indicator shows green bars continuing to amplify, with DIF crossing down through DEA to form a death cross, and downward momentum is being released. The middle track of the Bollinger Bands at 2338 has become strong resistance in the short term, with the price currently hovering near the lower track at 2298. The KDJ indicator has entered the oversold area, indicating a short-term technical rebound demand. However, the moving averages are showing an initial downward arrangement, making the rebound height limited. There is dense selling pressure in the range of 2320-2340, while the key support levels below are at 2270 and 2250. If it falls below 2270, it may further probe down to the 2220 line.
Short-term reference: (Actual data has been updated; consult the author for details)
Buy from 2270 to 2290 with a stop loss at 2230, targeting 2320 to 2350
Sell from 2350 to 2380 with a stop loss at 2410, targeting 2290 to 2250
Many cryptocurrency friends have been asking: Has it really dropped to the end? Can we catch the bottom? Stop searching for answers everywhere! In a fluctuating market, it is recommended to reduce leverage, control positions, and avoid frequent operations. The essence of trading is survival, and profit comes second.

Warm reminder: The content above is solely created by the author of the public account. The advertisements at the end of the article and in the comment section are unrelated to the author. Please exercise caution in distinguishing them. Thank you for reading.
免责声明:本文章仅代表作者个人观点,不代表本平台的立场和观点。本文章仅供信息分享,不构成对任何人的任何投资建议。用户与作者之间的任何争议,与本平台无关。如网页中刊载的文章或图片涉及侵权,请提供相关的权利证明和身份证明发送邮件到support@aicoin.com,本平台相关工作人员将会进行核查。