Cryptocurrency Academic: Is Ethereum's daily chart signaling a trend change on May 9? Weakness in the 4-hour chart, trouble if critical support is broken! Latest market analysis and trading suggestions
The current price of Ethereum is 2310. To be honest, in such narrow fluctuations, the biggest test is patience. Many people always think they need to trade every day, but in the end, the more they trade, the more they lose, missing the real trend. ETH is still choosing its direction on the daily level; the weakness in the 4-hour chart is just a short-term adjustment, and there's no need to panic excessively. In the crypto world, slow is fast; control your actions and wait for signals at key positions before acting is much better than disorienting yourself every day.
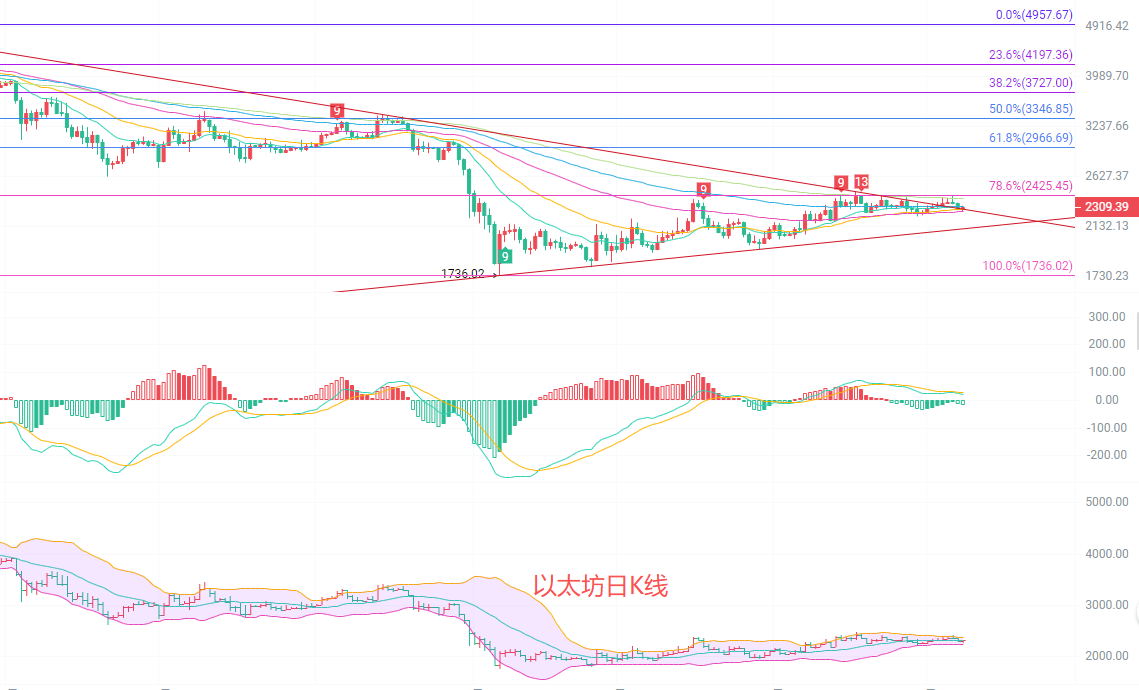
The daily K-line is oscillating narrowly around the EMA15 line at 2313, with short-term moving averages consolidating, and the north-south struggle is in a deadlock. Below, the EMA30 line at 2287 and the EMA60 line at 2267 form a strong support zone, and the medium-term upward trend has not been broken. The MACD indicator shows a slight expansion of green bars, with the DIF turning downward, indicating that the northward momentum is weakening and there is a need for a pullback to confirm support. The Bollinger Bands are in a contraction state, with the upper band at 2382 and the lower band at 2246 narrowing, indicating that the oscillation range is compressing and a directional breakthrough is imminent; current focus should be on the situation of breaking the range.
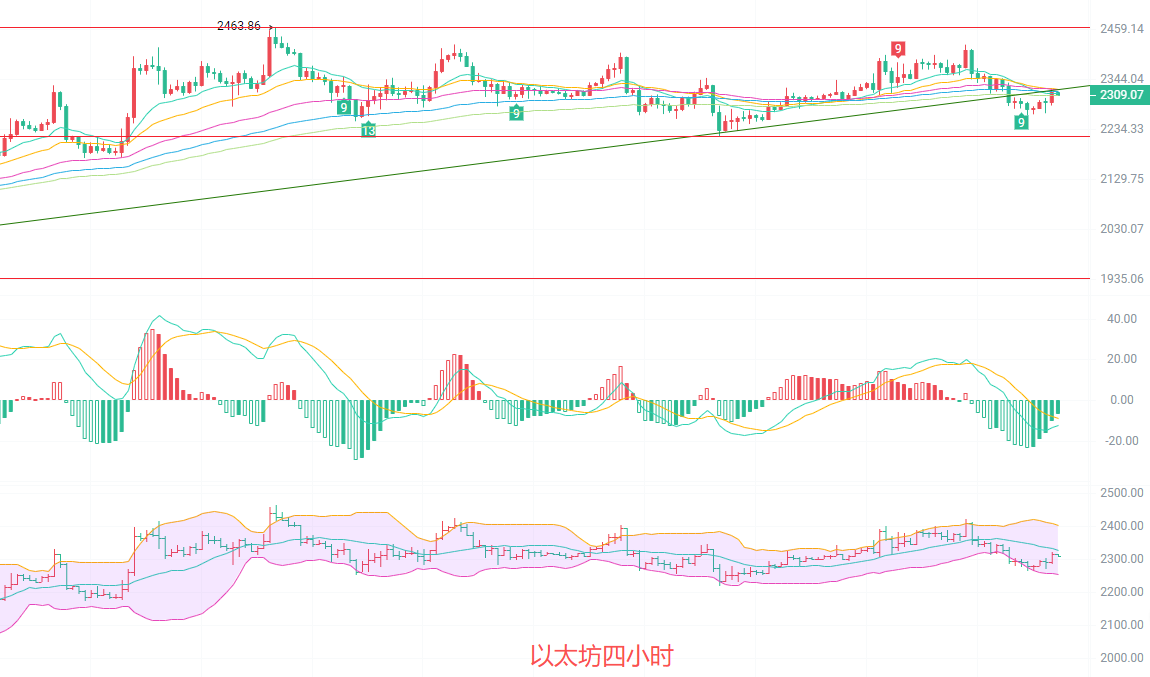
The four-hour K-line has broken below the EMA15, EMA30, and other short-term moving averages, with the moving average system showing a downward arrangement. The upper range between 2320 and 2330 forms a short-term pressure zone. The MACD indicator continues to operate below the zero axis, with increased green bars, indicating that the downward momentum is dominant, and the price is running near the lower band of the Bollinger Bands, showing clear signs of weakness. There is support around the previous low of 2218, and the current price is in a pullback process; if it cannot quickly recover above 2330, it is highly likely to continue its downward trend, so one must be cautious of the risk of breaking support levels. At this time, it is necessary to patiently wait for the trend to develop.
Short-term reference: (Practical data has been updated, please consult the author for details)
Buy on the way up from 2270 to 2290, stop loss at 2230, target from 2320 to 2350
Sell on the way down from 2350 to 2380, stop loss at 2410, target from 2300 to 2265
There is no 100% win rate in cryptocurrency trading; do not be superstitious about any analysis, including what I said today. Properly set stop losses as a lifesaving baseline, do not hold positions excessively, and never invest all at once. The safety of your principal is always the top priority. The market is ever-changing, do not stubbornly stick to one direction, learn to adjust flexibly, and do not let temporary gains or losses affect your mindset. Take it slow; steady progress is the way for long-term success.

Reminder: The above content is solely created by the author's official account, and the advertisements at the end of the article and in the comments section are unrelated to the author. Please be cautious in identifying them. Thank you for reading.
免责声明:本文章仅代表作者个人观点,不代表本平台的立场和观点。本文章仅供信息分享,不构成对任何人的任何投资建议。用户与作者之间的任何争议,与本平台无关。如网页中刊载的文章或图片涉及侵权,请提供相关的权利证明和身份证明发送邮件到support@aicoin.com,本平台相关工作人员将会进行核查。