Cryptocurrency Insider: 5.10 Ethereum 2327 Horizontal Market Grinding! Analyzing Key Support and Resistance Without Worries! Latest Market Analysis and Operating Suggestions
Ethereum's current price is 2329, many cryptocurrency friends say that prolonged sideways movement must lead to a drop, while others shout that it will rise soon, but these are all nonsense. Orders without data support are just bluffing. The current price is stuck around 2327, seemingly quiet, but in fact, the victory or defeat of both sides has long been hidden in the details. The current fluctuations are actually a good thing for us, giving us enough time to adjust our rhythm and refine our strategy. Many people find sideways movement boring, but it is exactly at such times that one's trading mentality is most tested. Don't let short-term fluctuations affect your emotions. When the market starts, let's seize the opportunity together and cheer each other on!
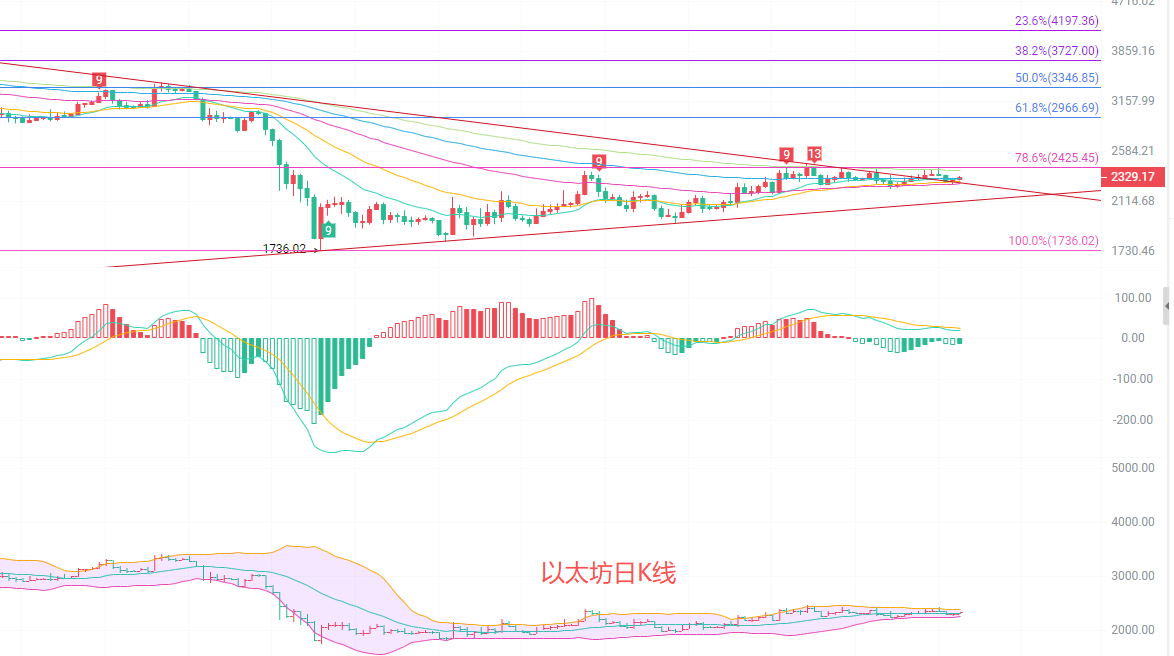
The daily candlestick has increased slightly by 0.94%, and is in a stage of converging fluctuations. Currently, it is stabilizing above the short-term moving averages EMA15 and EMA30, forming initial support. However, the medium to long-term moving averages EMA60 and EMA90 are still in a downward trend, indicating that the overall trend has not yet reversed. In the MACD indicator, the DIF continues to converge towards the DEA, with green bars continuously shortening, and downward momentum significantly weakening. The Bollinger Bands are continuing to narrow, with the upper band at 2381 and the lower band at 2253, compressing the price fluctuation range. In the short term, the market is likely to maintain fluctuations, and it is essential to pay close attention to the direction of the breakout. A breakout above the upper band or a drop below the lower band will open up new space.
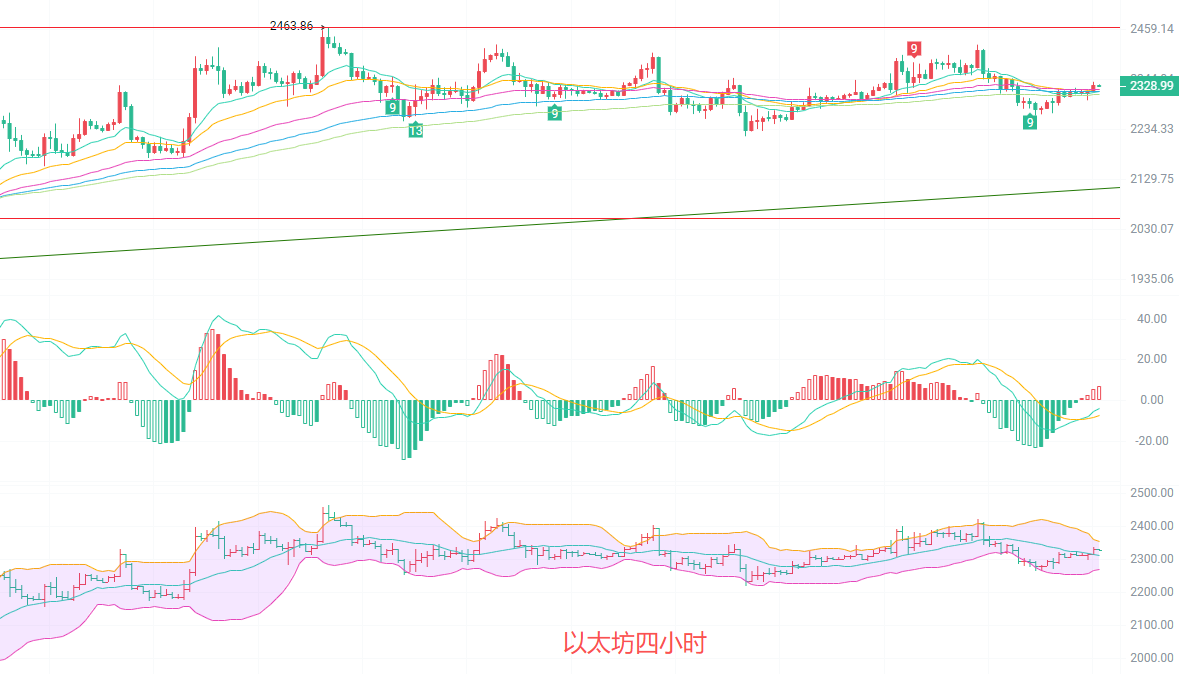
The four-hour candlestick is in a dense overlapping area of multiple EMA moving averages, with the forces of both sides leaning towards balance. The Bollinger Bands are currently flat, with the upper band at 2354 and the lower band at 2270, and the price is repeatedly fluctuating along the middle band, showing significant range fluctuation characteristics. The MACD indicator has formed a golden cross, with the red bars continuously slightly enlarging, indicating that short-term upward strength has increased. However, the pressure level around 2332 has been tested multiple times without breaking, limiting rebound momentum. The recent low of 2218 serves as effective support, and the overall trend has not escaped the fluctuation box, lacking clear trending signals. In this market, it is better to control your actions than anything else. Not trading means no loss. Wait for the breakout before buying in; it will be worth it!
Short-term Reference:
Up from 2310 to 2315, stop loss at 2290, target at 2350 to 2380, breakout look for above 2400
Aggressive traders down from 2350 to 2355, stop loss at 2375, target at 2300 to 2270
In the current fluctuating market, it is not advisable to hold heavy positions; prioritize small positions for trial and error. Stop losses must be strictly enforced to avoid repeated losses. After breaking key levels, increase positions with the trend; controlling risk is the top priority.

Kind Reminder: The above content is solely created by the author on the public account. Advertisements at the end of the article and in the comments section are not related to the author. Please exercise caution and discernment. Thank you for reading.
免责声明:本文章仅代表作者个人观点,不代表本平台的立场和观点。本文章仅供信息分享,不构成对任何人的任何投资建议。用户与作者之间的任何争议,与本平台无关。如网页中刊载的文章或图片涉及侵权,请提供相关的权利证明和身份证明发送邮件到support@aicoin.com,本平台相关工作人员将会进行核查。