Dear friends, I am Sister Qinglan. Today, market sentiment has warmed up somewhat, with the focus on two major events. Firstly, the easing of geopolitical risks, as there are signs of dawn in Russia-Ukraine talks, Bitcoin rebounded and broke through $81,000, with altcoins also soaring, directly boosting risk appetite. On the other hand, Strategy purchased 56,000 BTC in April, outperforming other public companies by 28 times, and the ongoing large-scale accumulation by institutions has strengthened market confidence. These two significant positive factors combined have set a bullish tone for today’s market. However, we need to be cautious, as South Korea is about to impose a virtual asset income tax, and the expected selling pressure from large ETH deposits to exchanges may limit the upside potential. Next, let's use data to see what the current market situation is.
Current Price and Time
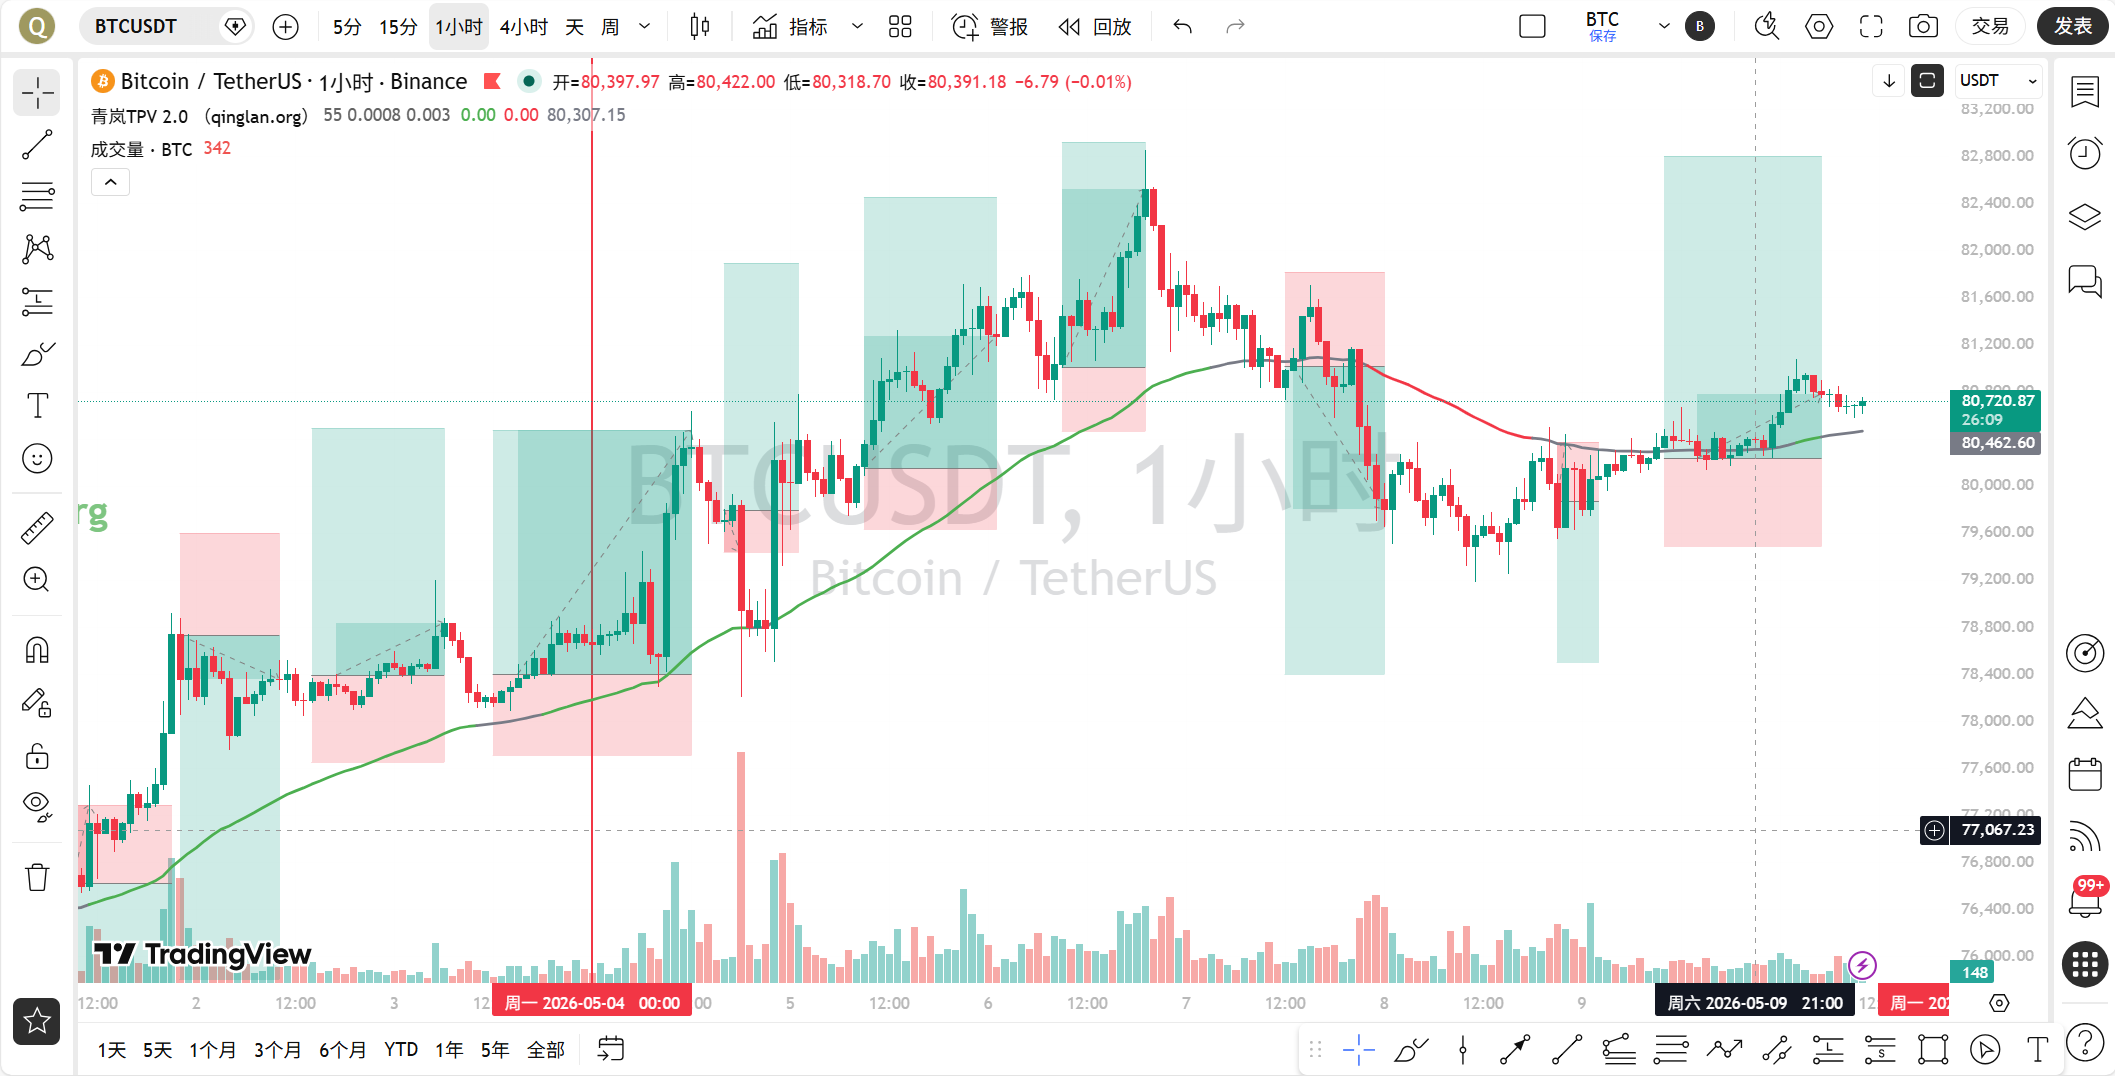
The current time is May 10, 10:26, and the latest price for BTC is 80,720 USDT. The 24-hour increase is 0.61%, and the Fear and Greed Index is at 47, which is in a neutral range, indicating that market sentiment is not overly enthusiastic and there is still room for rational trading. BTC's market share is 58.27%, which shows that funds are still seeking safety among mainstream coins.
Multi-Cycle Status Overview
First, let’s look at the daily level. Daily MA5=80,608, MA10=79,929, MA30=77,211, with the price firmly above all moving averages, indicating a bullish alignment of short-term moving averages. The MACD shows a golden cross, with DIF=1,854.52, DEA=1,840.51, and a bar value of 14.01; although the bar value is small, the golden cross signal is clear. RSI=59.43, in a neutral to strong area, showing no signs of overheating. The daily structure indicates that BTC has the potential for an upward breakout after consolidating around the $80,000 mark.
Next, let’s look at the 4-hour level. 4-hour MA5=80,642, MA10=80,433, MA30=80,769, with the price hovering near MA30. The MACD shows a golden cross, with DIF=116.29, DEA=107.94, and a bar value of 8.36, indicating that although the momentum bar is small, it remains positive. RSI=60.56, also in a neutral to strong area. The 4-hour cycle shows that the price has formed support above $80,000, but the upper MA30 constitutes short-term pressure and requires a volume breakout to open up space.
The 1-hour level is the core observation cycle for today. 1-hour MA5=80,709, MA10=80,779, MA30=80,488, with the price fluctuating between MA10 and MA30. The MACD shows a death cross, with DIF=128.29, DEA=136.22, and a bar value of -7.92, indicating that bearish momentum is being released but not significantly. RSI=66.48, close to the overbought area but not yet reached. EMA55=80,488, and the current price of 80,720 is about 0.29% higher than EMA55, indicating line fluctuation. The key point is that in the past 8 1-hour candlesticks, the closing prices were greater than EMA55 8/8 times, with 0 crossings, indicating that the price has consistently been above EMA55, with a clear bullish trend; however, line fluctuation has increased the probability of oscillation.
15-minute level. 15-minute MA5=80,653, MA10=80,674, MA30=80,751, with the price operating below MA30. The MACD shows a death cross, with DIF=-18.63, DEA=-11.39, and a bar value of -7.24, indicating that bearish momentum continues. RSI=44.35, in a weak area. The 15-minute analysis shows short-term pullback pressure, but the amplitude is limited, constituting a high position oscillation consolidation.
TPV Signal Validation
According to the Qinglan TPV system, we take the 1-hour EMA55=80,488 as the boundary between bullish and bearish. The current price of 80,720 is obviously higher than EMA55, and the closing prices of the past 8 1-hour candlesticks were all above EMA55, meeting the conditions for bullish trend positioning. Oscillation auxiliary data shows that the absolute amplitude from EMA55 is 0.29%, lower than the 0.3% threshold, and the closing prices for the past 8 candlesticks were 8/8 times greater than EMA55, with 0 crossings, not meeting the oscillation conditions; however, line fluctuation has increased the probability of oscillation, and we need to be wary of false breakouts.
Long Condition Verification: First, the price must stabilize above the 1-hour EMA55, with 2 consecutive candlesticks closing above EMA55; this condition is met. Second, regarding support stabilization, the current price is receiving support near EMA55 but has not yet formed a clear long lower shadow line or bottom formation structure; further observation of subsequent candlesticks is needed. Third, in terms of declining momentum exhaustion, the 1-hour MACD bar value is -7.92; did it shorten for 2 consecutive cycles? From the data, the MACD bar value began at -7.92; however, previous data is lacking, making it impossible to confirm continuous shortening. RSI=66.48, has not rebounded from below 30. Overall, part of the conditions for going long is met, but the formation and momentum signals are not strong enough, requiring a wait for clearer signals.
Short Condition Verification: First, the price must be under pressure below the 1-hour EMA55; the current price is above EMA55 and the condition is not met. Second, regarding pressure encountered, the price is oscillating above $80,000 but has not formed a clear long upper shadow line or top formation. Third, regarding weakening rebound power, the MACD bar value is negative, but the RSI has not fallen back from above 70. The short condition is not established.
Oscillation Handling: The current price is at an amplitude of 0.29% from EMA55, less than 0.3%, and the closing prices of the past 8 candlesticks were all above EMA55, with 0 crossings, not meeting the oscillation threshold. However, line fluctuation suggests that the market may enter a narrow consolidation, making it unsuitable to chase highs or lows.
On-Chain/Funding Status
In terms of on-chain data, the Fear and Greed Index is at 47, neutral, with no extreme sentiment. BTC's market share is 58.27%, indicating that funds are still concentrated in mainstream coins; the sustainability of altcoins needs observation. On the news front, large ETH deposits into exchanges increase selling pressure expectations, but institutional accumulation of BTC forms a hedge. Overall funding is neutral to bullish but watch out for short-term impacts following the implementation of Korea's tax policies.
Key Attack and Defense Levels
Upper resistance levels: First resistance level at 81,000, which is the previous high and also a psychological barrier. Second resistance level at 82,000, an important resistance level at the daily chart level. Lower support levels: First support level at 80,488, which is the 1-hour EMA55, the boundary between bullish and bearish. Second support level at 80,000, a round number, and near the 4-hour MA10. If it falls below 80,000, it may test 79,500.
Trading Ideas
Based on the current market situation, I propose the following trading ideas. Direction: Bullish, but primarily focusing on low buying during pullbacks, not chasing highs. Entry Conditions: Wait for the price to pull back to near the 1-hour EMA55, specifically in the 80,488-80,500 range, look for a long lower shadow line or bottom formation structure, while the 15-minute MACD bar value begins to shorten, and the RSI rises from below 40; then a small position can be opened. If the price directly breaks through 81,000 and stabilizes, one can chase long but confirmation with volume is needed. Stop-Loss Level: Set the stop-loss for long positions below 80,000, specifically at 79,950; if it drops below this, exit the position. Target Level: First target at 81,000, second target at 82,000. If the price encounters resistance near 81,000 and forms a top formation or long upper shadow line, consider shorting, but it must be a quick entry and exit.
Risk Warning
The current market is in a state of intertwined easing geopolitical risks and macro uncertainties; line fluctuations increase the risk of false breakouts, so please strictly control your positions and set stop-losses to avoid heavy speculation.
Follow Qinglan Crypto Classroom to grasp more trading opportunities! Welcome to visit our official website www.qinglan.org
📊 Qinglan TPV Trading Strategy Backtest Reference
🕒 Last Backtest Time 05-10 07:00:02
Total Analysis: 1422 Backtests: 1416 Accuracy Rate: 66.6% (943/1416)
免责声明:本文章仅代表作者个人观点,不代表本平台的立场和观点。本文章仅供信息分享,不构成对任何人的任何投资建议。用户与作者之间的任何争议,与本平台无关。如网页中刊载的文章或图片涉及侵权,请提供相关的权利证明和身份证明发送邮件到support@aicoin.com,本平台相关工作人员将会进行核查。