Cryptocurrency Scholar: The weak pattern on May 16 hides a reversal opportunity, the time to position in Ethereum at low levels has arrived! Latest market analysis and trading suggestions
Ethereum is currently priced at 2230. Recently, Ethereum's market movements have been chaotic, with many pin bar washout events. The difficulty of short-term trading has greatly increased, making it easy to be misled by short-term trends. The overall daily and four-hour trends are relatively weak, and the overall environment is not suitable for aggressive trading. It is better to miss opportunities than to blindly make wrong trades; if one cannot understand the trend, it is better to stay out of the market and rest. Ensure to set trading points in advance, strictly execute stop-loss discipline, and avoid heavy gambling. Market opportunities are continuously emerging, so there is no need to rush to enter; first, ensure the safety of funds.
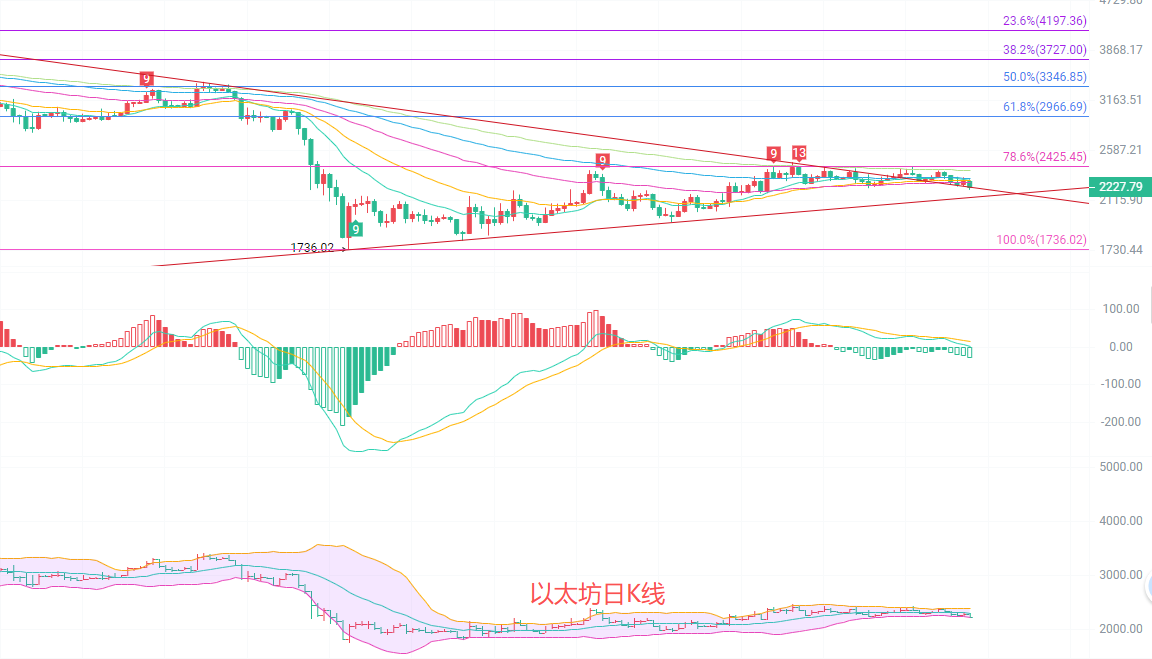
The daily candlestick is at the lower edge of the fluctuation since April 25. From the moving average system, the price has fallen below the short-term moving averages EMA15, EMA30, and EMA60, only gaining weak support above EMA120, with a mid-term trend leaning bearish. The MACD indicator shows that the DIF has crossed below the DEA, with a green bar beginning to appear, indicating that downward momentum is starting to release; the middle line of the Bollinger Bands is continuously declining, with the price touching the lower line around 2226, indicating a weak rebound demand in the short term. However, the upper pressure at 2314 is quite strong, and without breaking through the previous level, reversal is hard to say.
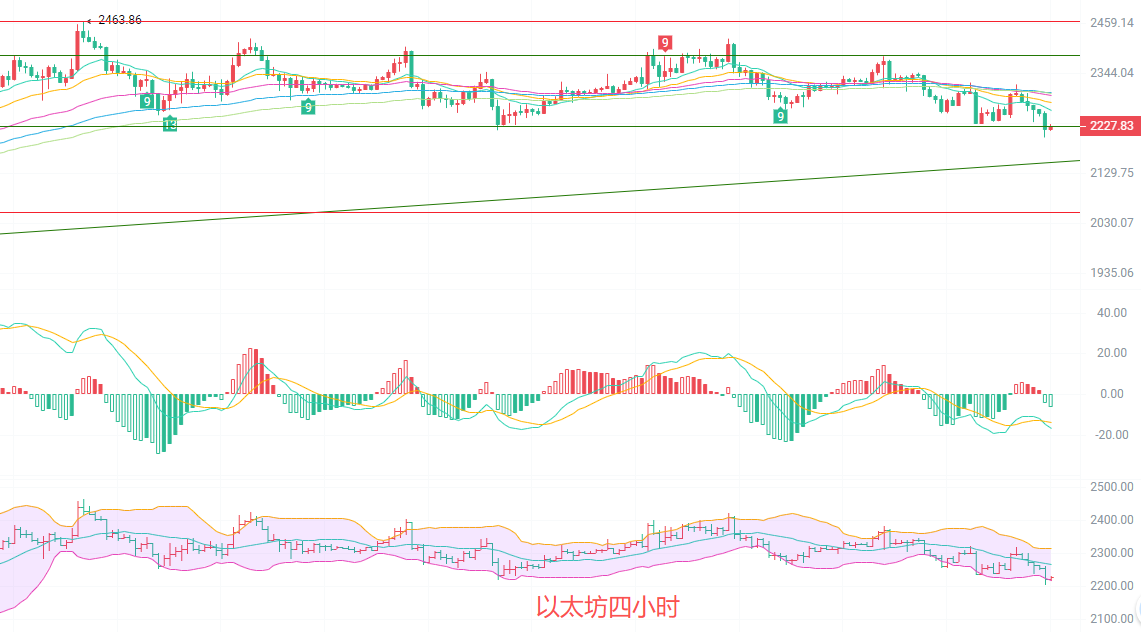
The four-hour candlestick shows a clear descending channel continuing to fall from around 2375, currently breaking below the lower line of the Bollinger Bands at 2219, with a minimum reaching 2203, indicating evident short-term overselling. The moving average system is arranged downward, with EMA15 and EMA30 forming dual pressure, weakening the rebound strength continuously. The MACD indicator shows that the DIF and DEA are dead crossing below the zero line, with the green bar amplifying, indicating that short-term downward momentum is still dominant; the Bollinger Bands are opening downward, with the price running along the lower line. If it cannot quickly recover above 2250, it is highly likely to continue a fluctuating downward rhythm.
Short-term reference:
Buy up from 2210 to 2180, stop loss at 2150, target at 2240 to 2260
Sell down from 2260 to 2270, stop loss at 2290, target at 2220 to 2200
The current trend is leaning south, with upward movements only for short-term rebounds; it is necessary to strictly control positions and avoid holding against the trend. If the price breaks 2290, the downward idea will be invalid, and timely adjustments are needed.

Kind reminder: The above content is solely created by the author on Weibo; the advertisements at the end of the article and in the comments section are unrelated to the author, so please identify carefully. Thank you for reading. For the WeChat public account, search "Cryptocurrency Scholar" in the WeChat search page.
免责声明:本文章仅代表作者个人观点,不代表本平台的立场和观点。本文章仅供信息分享,不构成对任何人的任何投资建议。用户与作者之间的任何争议,与本平台无关。如网页中刊载的文章或图片涉及侵权,请提供相关的权利证明和身份证明发送邮件到support@aicoin.com,本平台相关工作人员将会进行核查。