Dear friends, I am Sister Qinglan. Today's market sentiment can be said to be quite complex. On one hand, there is positive support; on the other, negative news is coming in densely. We will highlight two of the most significant events to start with. First, the news of Japan's regulatory progress and tax rate cuts has led Japanese brokers to rush to launch Bitcoin trusts, and SBI and Rakuten are also developing related products independently. This is undoubtedly a long-term positive, expected to attract institutional funds into the market, injecting fresh liquidity. However, at the same time, the total liquidation across the network in the past 24 hours has reached 466 million USD, with long positions suffering severely; the funding rates are generally below 0.005%, and bearish forces are noticeably strengthening. This intertwining of longs and shorts is precisely the moment to test our trading system. Today, Sister Qinglan will use the Qinglan TPV system to help everyone see the true state of the current market.
Current Price and Time
The current time is May 17, 10:05, and the Bitcoin price is 77,810 USDT. The 24-hour decline is 1.22%, and the market fear and greed index is only 31, which is in the fear zone. At this position, many people are asking whether this is the bottom or halfway up. Don't rush, we will break it down step by step.
Multi-Timeframe Status Overview
Let's first look at the daily chart. The daily MA5 is at 79,094, and the MA10 is at 80,080, with the price clearly under pressure below the short-term moving averages. The MACD histogram is at -547.36, with the DIF and DEA operating in a dead cross, and bearish momentum continues to be released. The RSI is at 47.38, in a weak neutral zone, and has not entered the oversold area. The overall daily chart shows a pattern of oscillation downward, with the bulls lacking counterattack strength.
Next, let's look at the 4-hour chart. The 4-hour MA5 is at 78,107, and the MA10 is at 78,540; the price is similarly pressed. The MACD histogram is at -187.38, with the DIF and DEA in a dead cross widening downward, and bearish momentum is still increasing. The RSI is only at 4.49, having entered the extreme oversold area. Here, it is important to note that an RSI this oversold on the 4-hour chart often indicates that short-term rebound demand is accumulating, but the trend is still dominated by bears.
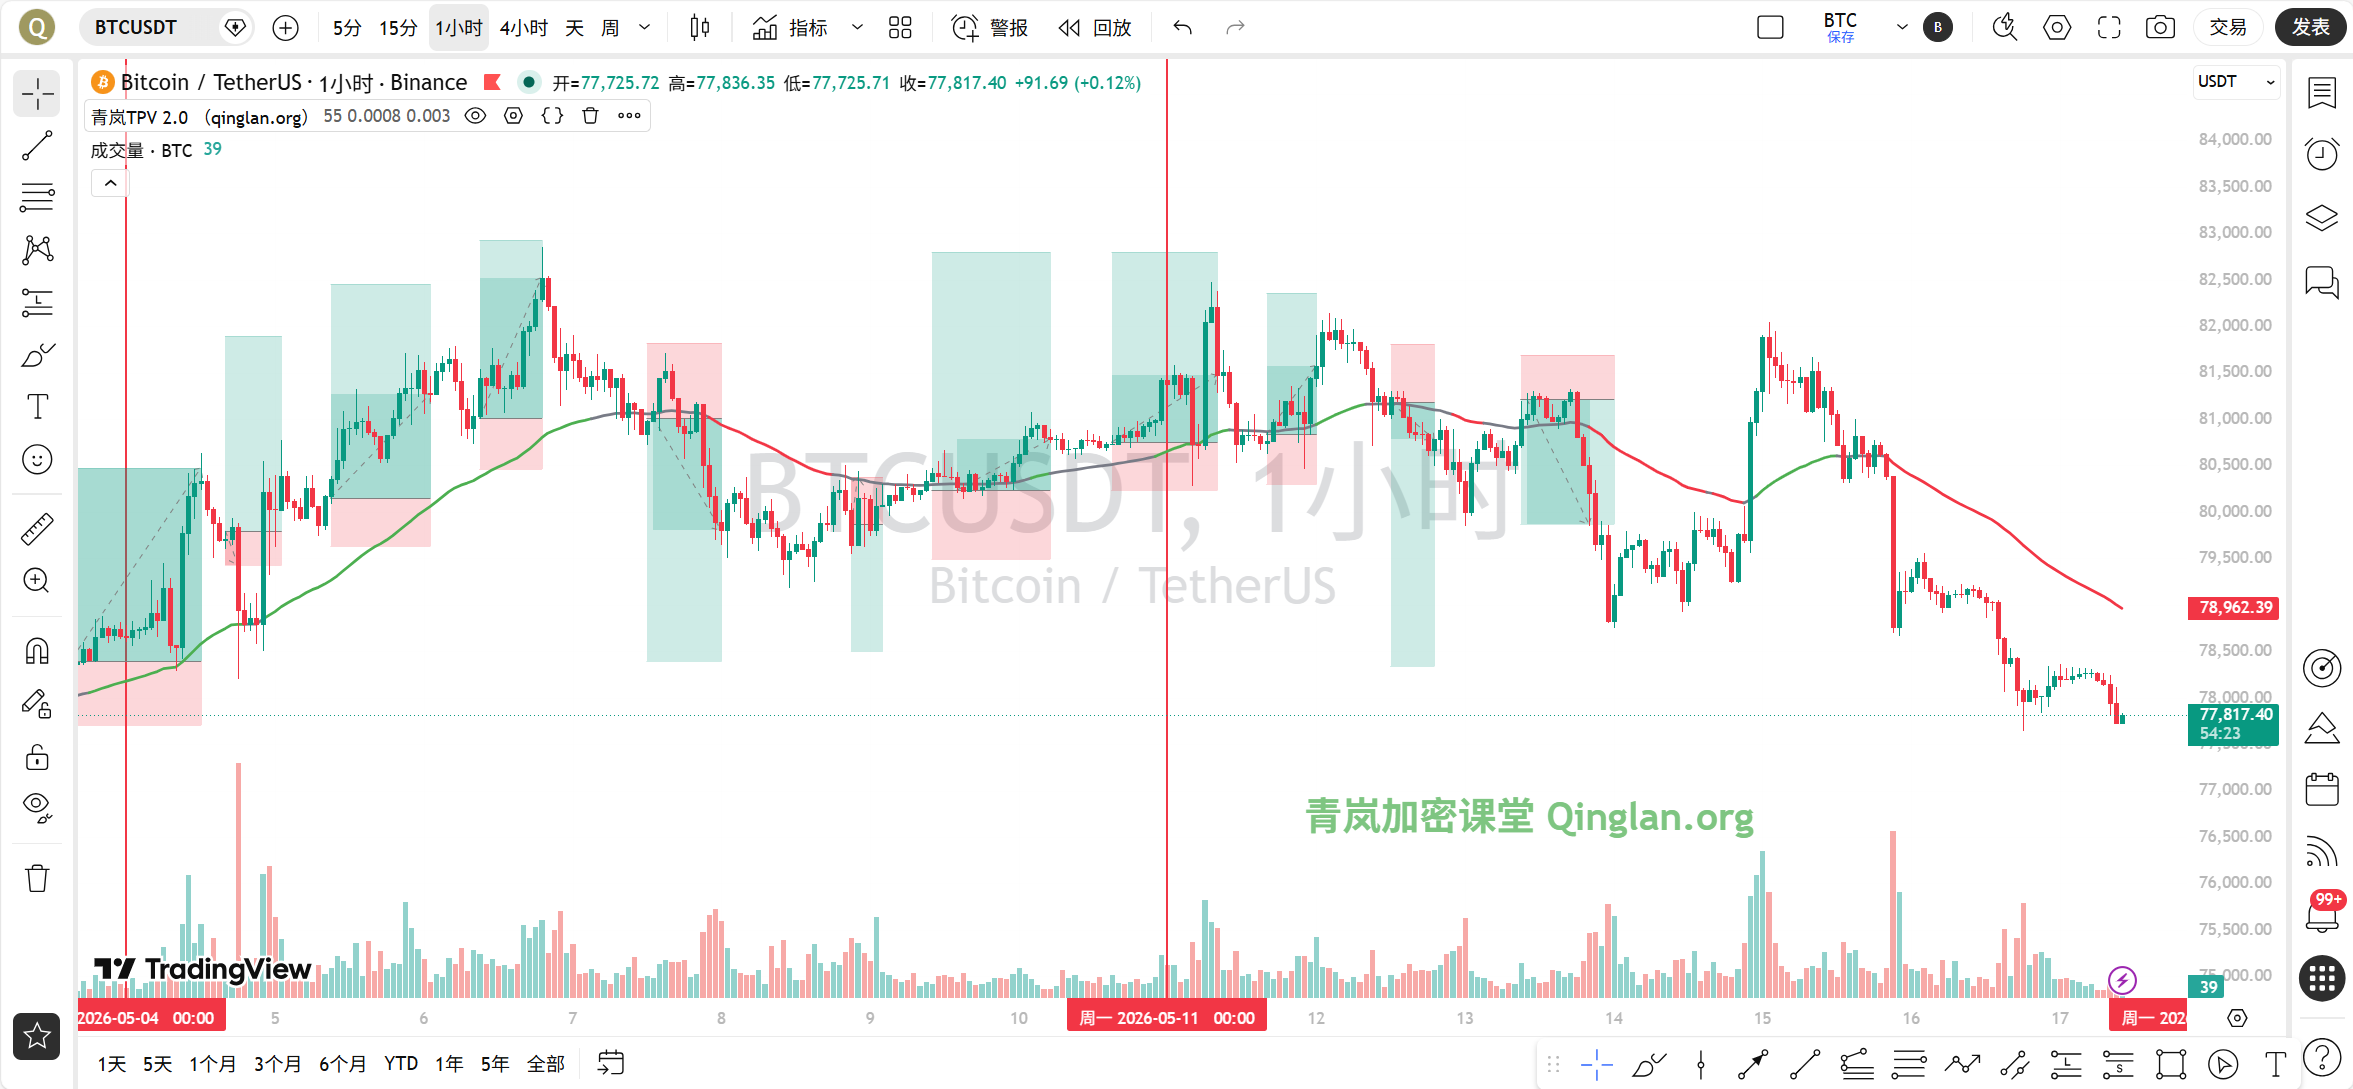
On the 1-hour chart. The 1-hour MA5 is at 77,963, and the MA10 is at 78,103, with the price operating below the moving averages. The MACD histogram is at 18.80, although it is still positive, the DIF and DEA remain below the zero line, and the rebound strength is very limited. The RSI is at 39.70, in a weak area. The most critical point is that the 1-hour EMA55 is at 78,908.83, and the current price is 77,810, which is 1.39% away from EMA55, clearly in a bearish trend area.
On the 15-minute chart. The 15-minute MA5 is at 77,873, the MA10 is at 77,999, and the MA30 is at 78,167, with the moving averages in a bearish arrangement. The MACD histogram is at -47.94, with the DIF and DEA in a dead cross. The RSI is at 29.36, entering the oversold zone. There is a technical correction demand in the short term, but the strength is questionable.
TPV Signal Verification
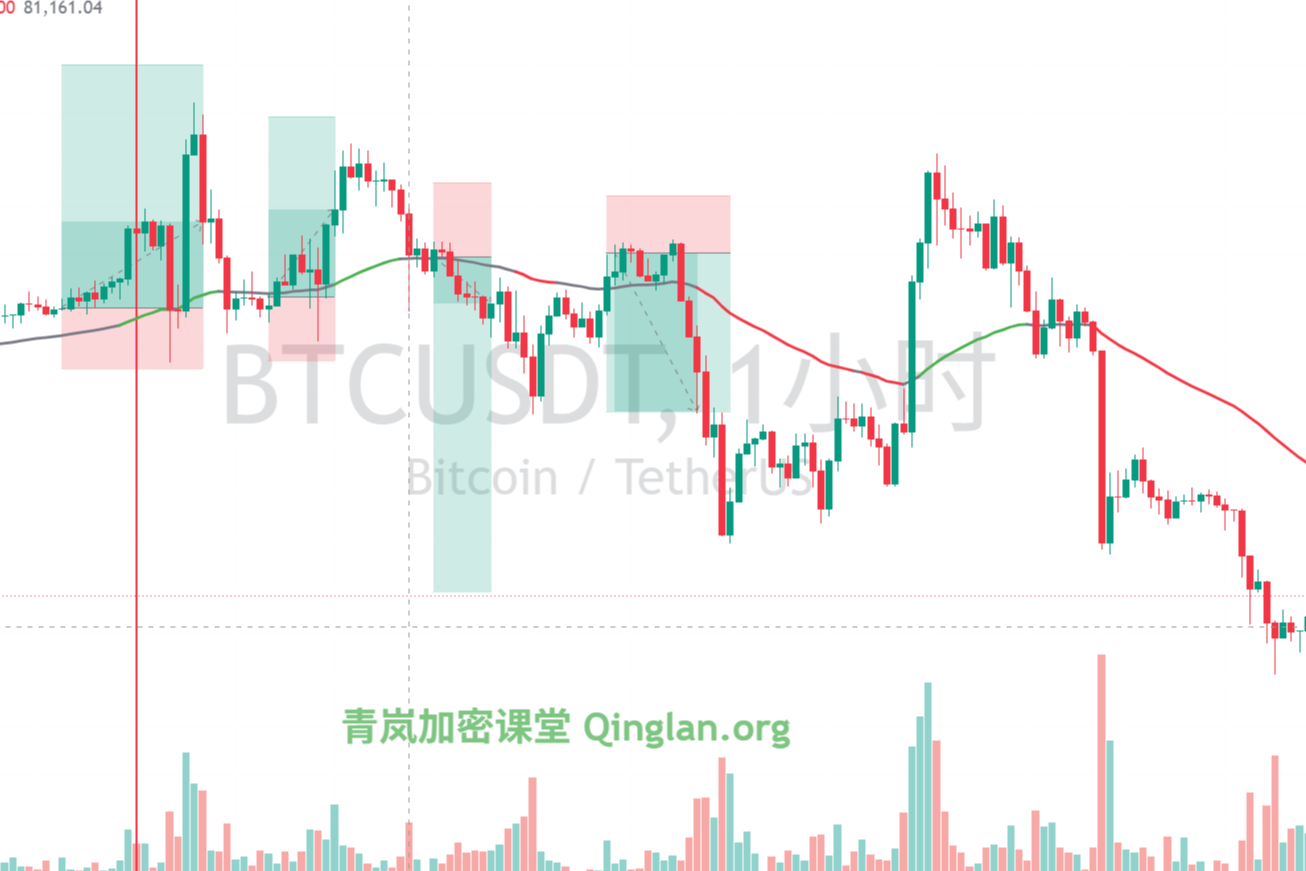
Now we enter the core step, using the Qinglan TPV system to verify the current signals. First, let's look at the trend positioning. The current price is 77,810, far below the 1-hour EMA55 of 78,908.83, and in the past 8 1-hour candlesticks, the closing price was greater than EMA55 zero times, and the crossing occurred zero times, which does not meet the oscillation threshold. Therefore, it is currently in a clear bearish trend area.
Short Conditions Verification. First, the price is under pressure below the 1-hour EMA55, and the closing prices of two consecutive 1-hour candlesticks are less than EMA55, which fully meets this condition. Second, resistance has been encountered. From the 4-hour and 1-hour levels, when the price rebounded to around MA10, there were significant pullbacks, forming effective high points, with clear long upper shadow signals. Third, the rebound is weak. Although the 1-hour MACD histogram has shortened for two consecutive periods, the DIF and DEA remain below the zero line, and the RSI has retreated from 39.70, showing insufficient rebound momentum. All three short conditions are met, indicating a valid bearish signal.
Long Conditions Verification. First, the price needs to stabilize above the 1-hour EMA55, which is clearly not satisfied currently. Second, support must stabilize. Although the 15-minute and 4-hour RSI have entered the oversold zone, there is no clear bottom formation or long lower shadow stabilization signal in the daily and 1-hour levels. Third, the bearish momentum has not exhausted. The daily MACD histogram is still expanding, and the 4-hour MACD histogram is also expanding, indicating that momentum has not exhausted. Long conditions are not met, caution is advised for long positions.
On-chain/Funding Situation
In terms of on-chain data, the fear and greed index is at 31, with market sentiment leaning towards panic. Funding rates are generally below 0.005%, with bears dominating, indicating strong bearish sentiment in the market. The 24-hour liquidation is 466 million USD, mainly from long positions, where bulls have suffered heavy losses, further intensifying short-term selling pressure. However, the favorable regulatory news from Japan and Morgan Stanley's increase in BTC ETF holdings provide support for the medium and long term, but short-term bearish forces still prevail.
Key Support and Resistance Levels
Under the current bearish trend, the first resistance level above is at the 1-hour EMA55 of 78,908; this is the dividing line between longs and shorts. If the price rebounds to this area and a long upper shadow or top formation occurs, it will be a good opportunity to increase short positions. The second resistance level is at the 4-hour MA10 of 78,540, which is the resistance against short-term rebounds. The first support level below is at the psychological level of 77,000, which is a mental support. If this breaks, the next support level is around 75,000, which is the previous low area.
Trading Strategy
Direction: Bearish trend, focusing on shorting, no longs.
Entry Conditions: Wait for the price to rebound to the vicinity of the 1-hour EMA55, specifically the 78,900-79,000 area. If a long upper shadow or top formation occurs, and the MACD histogram again shortens, you can enter a short position. If the price directly breaks below 77,000, you can add to the short position, but be cautious with position control.
Stop Loss Level: If entering around 78,900, set the stop loss above 79,500, which is breaking above and stabilizing on the 1-hour EMA55. If entering by adding to a short position, set the stop loss above 77,500.
Target Level: The first target is 77,000, and the second target is 75,000. If bearish momentum continues, it can look down to 73,000.
Risk Warning
The current market is highly volatile, with intense long and short battles; please strictly control positions, set stop losses, and do not hold onto losing positions.
Follow Qinglan Crypto Classroom to grasp more trading opportunities! Welcome to visit the official website www.qinglan.org
📊 Qinglan TPV Trading Strategy Backtest Reference
🕒 Last Backtest Time May 17, 07:00:02
Total Analysis: 1579 Backtests: 1573 Accuracy Rate: 66.4% (1044/1573)
免责声明:本文章仅代表作者个人观点,不代表本平台的立场和观点。本文章仅供信息分享,不构成对任何人的任何投资建议。用户与作者之间的任何争议,与本平台无关。如网页中刊载的文章或图片涉及侵权,请提供相关的权利证明和身份证明发送邮件到support@aicoin.com,本平台相关工作人员将会进行核查。