Abstract
In May 2026, the global cryptocurrency market underwent a profound liquidity repricing under the triple impact of the Federal Reserve's power transition, unusual movements in the bond market, and a Bitcoin crash. On May 15, Kevin Warsh officially took over as Chairman of the Federal Reserve, facing the challenging situation of a 6% year-on-year surge in the PPI in April, which nearly nullified three years of anti-inflation efforts. Warsh's three major policy changes—accelerating the reduction of the balance sheet, redefining the inflation target, and weakening forward guidance—fundamentally challenged the market pricing logic. Meanwhile, the yield on the 30-year U.S. Treasury bond broke through the psychological barrier of 5%, and the global bond market experienced a rare sell-off, with the rapid rise in the risk-free interest rate directly lowering the valuation tolerance for risk assets. Bitcoin fell from approximately $82,000 to about $76,000 under multiple pressures, with ETF funds continuously experiencing a net outflow of over $1.5 billion, making $76,000 a key short-term support level. This report analyzes the essential logic behind this adjustment based on the three core variables mentioned above and looks ahead to market trends under three scenarios.
1. Warsh Takes Office: The Federal Reserve's Power Transition and Policy Logic Reconstruction
On May 15, 2026, Jerome Powell officially stepped down as Chairman of the Federal Reserve, handing over the position to Kevin Warsh, a researcher at the Hoover Institution at Stanford University and former Fed governor, on the last day of his term. Warsh's confirmation was marked by a Senate vote of 54 in favor and 45 against, indicating that his policy stance would likely face ongoing pressure from various parties. On his first day in office, Wall Street seemingly concluded "decently" with the Nasdaq Composite Index rising by over 1%, but deep changes were already brewing beneath the surface in the market pricing.
Warsh's policy initiatives revolve around three main directions. First, accelerating the reduction of the Fed's balance sheet. The current size of the Fed's balance sheet is about $6.7 trillion; Warsh criticizes this and advocates a more aggressive approach to balance sheet reduction. Accelerating this process would mean directly pulling liquidity out of the financial system, raising long-term interest rates and tightening the overall monetary environment, posing systemic pressure on risk assets, including crypto assets. Second, redefining the inflation target regime. Warsh questions the authority of the 2% numerical target and prefers a more vague expression of "price stability," which means a potential increase in actual tolerance for inflation, but also adds randomness to the policy and complicates market predictions. Third, weakening forward guidance and dot plots. Warsh advocates reducing or eliminating forecasting tools such as "forward guidance" and "dot plots," aiming to increase the Fed's policy flexibility; however, this would also amplify the information friction between the market and the central bank, intensifying short-term volatility.
For the cryptocurrency market, Warsh's stance bears a subtle duality. Before being nominated as Fed Chair in January 2026, Warsh publicly stated that Bitcoin is an "important asset" and "a good policeman of policy," showing an open attitude towards cryptocurrencies. However, this moderate stance creates a structural contradiction with the urgent tasks he now faces: encountering inflation data showing a 6% year-on-year PPI surge in his first month in office, Warsh must prioritize proving credibility in anti-inflation measures rather than advancing crypto-friendly policies. Therefore, in the short term, Warsh's anti-inflation task poses liquidity pressure on the crypto market; in the long term, his attitude towards digital assets may create a friendlier regulatory environment for institutional entry into the crypto market. Weighting both sides, the market continues to focus more on when the tightening of liquidity will manifest rather than on potential future regulatory benefits.
2. Bond Market Movements: Warnings of a Global Liquidity Turning Point
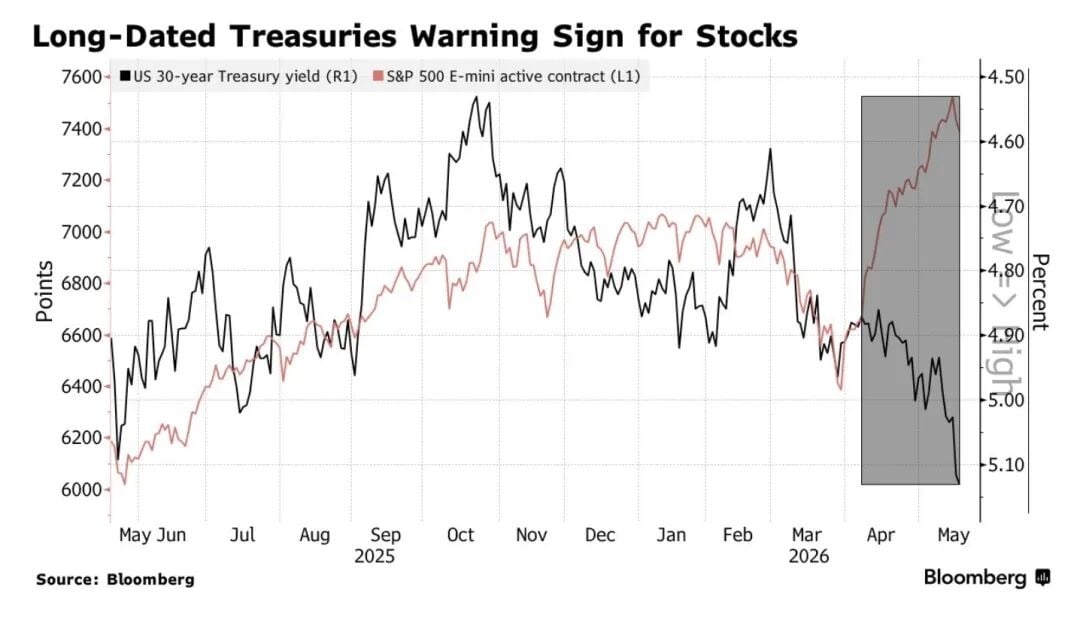
If the leadership change at the Federal Reserve is merely a disturbance at the expectation level, then the simultaneous movements in the bond market provide a more direct reality shock to risk assets. In May 2026, the global bond market faced a rare sell-off, with yields on government bonds in multiple countries soaring to multi-year and even decades-high levels. The yield on the U.S. 30-year Treasury bond broke the psychological barrier of 5% in mid-May, reaching 5.12%, the highest level since 2007; the yield on the 10-year U.S. Treasury bond concurrently rose to 4.63%, also a notably high level in recent years. The yield on Japan's 10-year government bonds reached a 30-year high of 2.797%, while the 30-year British government bond yield rose to 5.86%, and France's 30-year yield reached 4.675%. Even Germany's 30-year bond, which had long been close to negative rates, rose to 3.704%.
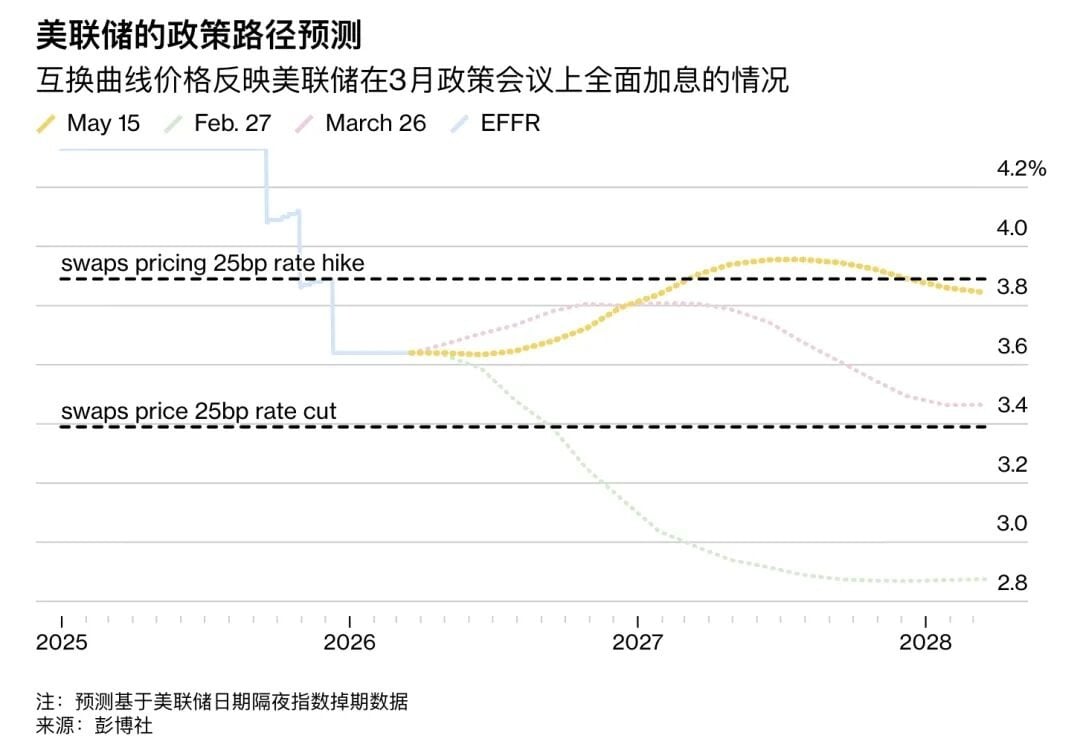
The immediate trigger for this global bond sell-off was the unexpectedly high U.S. PPI data for April. PPI rose by 1.4% month-on-month, far surpassing the market expectation of 0.3%, marking the largest monthly increase since 2022; year-on-year, PPI reached 6%, nearly offsetting three years of the Fed's anti-inflation efforts. As a leading indicator of CPI, the surge in PPI made the market realize that inflation was not retreating to the 2% target as expected, prompting an immediate reassessment of global pricing. Even more crucially, the anticipated interest rate cut path was completely shattered—prior to the crash, the market widely expected two interest rate cuts in 2026, with the first cut in June almost certain; following the crash, the likelihood of a rate cut plummeted to 15%, and even a slight rate hike expectation began to emerge, with the probability of a 25 basis point hike before July 2027 rising to 60%. The narrative of "Higher for Longer" returned.
The soaring bond yields transmitted to the crypto market through multiple channels. First, the opportunity cost increased; the rise in the risk-free interest rate diminished the attractiveness of zero-yielding assets like Bitcoin relative to cash and short-term Treasury bonds. Second, risk appetite decreased; under expectations of tightening liquidity, high-beta assets suffered systemic sell-offs. Third, the strengthening dollar; actual interest rate rises typically accompany a strengthening dollar index, which exerts additional pressure on risk assets denominated in dollars. Finally, the leveraging accelerator effect; in early May 2026, the market accumulated a substantial amount of leveraged long positions, margin calls triggered forced selling, resulting in a waterfall-like de-leveraging. Data shows that on the day Bitcoin fell below the low of $78,704, over $304 million in leveraged long positions in the entire market were liquidated, of which approximately $94 million in Bitcoin longs were liquidated. This series of transmission links together constituted the macro foundation for this Bitcoin crash.
3. Bitcoin Crash: Defense of Key Support at $76K Amid Triple Selling Pressure
In mid-May 2026, Bitcoin experienced a new round of sharp declines under multiple macro pressures. It dropped from around $82,000 to $76,800, with a decline of about 6%, leading to the liquidation of over $304 million in leveraged long positions across the market. Notably, the peculiarity of this decline lies in the simultaneous emergence of triple selling pressure signals, making it difficult for market participants to simply attribute it to a technical correction.
The first selling pressure comes from the continuous withdrawal of funds from ETF institutions. Since May 7, 2026, the U.S. spot Bitcoin ETF has recorded a continuous net outflow, with a single-day outflow of $648 million, the highest level since January 29; total net outflow since May 7 has exceeded $1.5 billion. The scale of this institutional fund outflow indicates a fundamental shift in institutional investors' macro pricing logic for Bitcoin—no longer viewing Bitcoin as a benefiting asset in a monetary easing environment but rather incorporating it into traditional risk asset pricing frameworks for hedging. The outflow of ETF funds is both a result of the decline and a cause of it: falling prices trigger programmatic stop-losses, which exacerbate selling pressure, forming a negative feedback loop.
The second selling pressure arises from synchronized active selling in both the spot and perpetual contract markets. According to Glassnode data, the cumulative transaction volume difference in the spot market dropped sharply from +$16.9 million to -$126.2 million, while the cumulative transaction volume difference in the perpetual contract market recorded a substantial negative value of -$368.5 million. The simultaneous shift to negative for both indicates that sellers are actively and independently selling in both the spot and futures markets rather than being passively liquidated. This pattern of synchronized active selling across two markets typically corresponds to a more prolonged selling pressure cycle in history, as passive liquidation is a one-time event, while active selling represents a sustained pessimistic judgment by sellers about future market conditions.
The third selling pressure originates from a sharp increase in hedging demand in the options market. The option's 25-Delta skew quickly rose from 10.9% to 14.4%, reflecting a significant increase in market participants' demand for protection against downside risks. A higher skew indicates a stronger relative demand for put options, which is an instinctive response from institutional investors when exposed to systematic risk. Vikram Subburaj, CEO of India's Giottus Exchange, pointed out that Bitcoin's first support level is around $76,000, with the secondary support range between $74,000 and $75,000. If this region is broken, it may trigger a deeper correction. Observing on-chain data, the range of $76,000 to $75,000 corresponds to price levels before the 2024 ETF-driven rally and is also a dense transaction zone for many leveraged positions. Once lost, technical stop-loss sell orders may trigger larger-scale chain reactions.
4. Stagflation Risks Resurface: The Dual Dilemma of Stubborn Inflation and Slowing Growth
The U.S. April CPI increased by 3.8% year-on-year, the highest level since June 2023; the PPI surged by 6% year-on-year and 1.4% month-on-month, marking the largest monthly increase since 2022. The probability of stagflation (the possibility of facing stagflation shocks before the end of the year) jumped from 11% to 40% within a month, and the market's pricing of "stagflation" is rapidly warming up. The alarming aspect of this data is not just the numbers themselves, but their lethal compression of the Federal Reserve’s policy space: traditionally, addressing economic slowdowns requires interest rate cuts, but high inflation prevents the Fed from cutting rates; combating inflation necessitates rate hikes, yet signals of slowing economic growth limit the room for rate increases. The Federal Reserve finds itself in a "dilemma," and the continuation of this dilemma itself is the greatest source of uncertainty in the market.
The rise in stagflation risk has a particularly complex impact path on the crypto market. From the nominal interest rate perspective, high inflation raises nominal interest rates, enhancing the risk-free return benchmark, which in turn increases the opportunity cost of zero-yielding assets like Bitcoin. From the real interest rate perspective, if the rise in nominal rates does not keep pace with inflation, real rates may still fall, theoretically providing some support for Bitcoin; however, the peculiarity of this round is that the Fed's policy response speed is notably lagging—markets have begun to reprice for rate hikes while the Fed is still in a transitional period following the new chair's appointment. This "policy vacuum" prevents the market from relying on the "Fed put option" (i.e., the implicit promise of the central bank to intervene during sharp market drops), amplifying the magnitude of downward volatility.
At the same time, global risk assets are experiencing synchronized declines. The Korea Composite Stock Price Index dropped 6.12% in a single day, triggering a circuit breaker, the Nikkei 225 Index fell 6.22%, the Nasdaq Index dropped 1.54%, and the Shanghai Composite Index accumulated a decline of 2.5% over two days. This pattern of cross-market synchronized declines indicates that this round of adjustments is not an isolated event in the crypto market but is a systemic reflection of tightening global liquidity across various risk assets. The bond market has "sounded the alarm" for both the AI bull market and the crypto market—when the "safety net" of risk-free interest rates disappears, all high-valuation assets reliant on future cash flow discounting face repricing pressure.
5. Market Structure Observation: Institutionalization Process and Internal Differentiation
Despite the sharp price decline in the short term, the institutionalization process of the crypto market has not been interrupted by this round of adjustments. Galaxy Digital successfully completed the first phase delivery of a Bitcoin computing power-related investment product aimed at institutional clients, delivering the first Phase 1 data center on time and within budget to CoreWeave (CRWV), marking the transformation of Bitcoin mining infrastructure to AI/HPC computing power leasing has entered a substantial commercialization stage. This continuation of structural trends indicates that institutional funds are systematically increasing their allocation to underlying crypto assets on a longer time scale rather than abandoning their positions due to short-term volatility.
At the same time, differentiation within the crypto mining camp is intensifying. Keel Infrastructure (formerly Bitfarms) reported a net loss of $145.4 million in its Q1 earnings report published in May 2026, with revenue decreasing by 23% year-over-year to $37 million; however, its stock price rose by over 8% on the day of the earnings report. The market's focus was not on the losses themselves but on whether its 2.2GW AI/HPC data center development pipeline could convert into formal leases between 2027 and 2028. The narrative of "replacing Bitcoin mining tail assets with long-term leases for AI infrastructure" is becoming the most recognized logical mainline among the mining transition camp.
On-chain data also reflects a differentiated characteristic of "accumulation amid panic." Despite significant outflows from ETFs, there has been an acceleration in net inflows of Bitcoin to exchanges, with about $1.68 billion per week flowing into cold wallets, indicating that some long-term holders are accumulating positions while prices are low. The supply from long-term holders has begun to stabilize, and the sale of high-price chips in the $100,000 to $126,000 range has almost been completed, indicating a significant release of potential selling pressure. Historically, when the derivatives market is in extreme bearish positioning (with the 30-day funding rate at the 6th percentile, the lowest level since early 2023), it tends to precede a sharp rebound rather than a consistent decline—because when all participants are short, the source of additional selling pressure is limited, but any rebound catalyst could trigger a large-scale short covering, fueling a "V-shaped reversal."
6. Conclusion: Three Scenario Simulations and Investment Framework
Looking ahead to the trends in the crypto market in late May and June 2026, the probabilities and triggering conditions of three scenarios warrant close attention. The most likely scenario is "range-bound consolidation": Bitcoin will find technical support in the $75,000 to $77,000 range, while the market digests macro negatives and awaits new catalysts. If bond yields stabilize and the $76,000 support remains effective, the market may enter a 2 to 4-week consolidation period, waiting for the next directional signal. In this scenario, the overall crypto market will exhibit a pattern of "not falling, not rising," with alpha opportunities emerging more from individual coin selection rather than systemic bullishness.
The triggering conditions for the bullish scenario require dual or multiple favorable resonances: first, the Fed or Warsh releases clear easing signals (e.g., conveying a dovish stance at the June FOMC meeting); second, a substantive easing of the geopolitical situation in the Middle East (with the Strait of Hormuz issues returning to the negotiation table); third, confirmation that April inflation data is receding. If all three conditions are met simultaneously, the rekindling of interest rate cut expectations will drive Bitcoin back above the $80,000 mark and possibly challenge the $85,000 to $87,000 range. The current assessment of the bullish scenario's win rate is around 25%, with the main obstacle being Warsh's unlikely rapid shift towards easing in the initial phase of his tenure.
The bearish scenario is currently the direction that requires the most vigilance: if the yield on the 30-year U.S. Treasury continues to rise and effectively breaks through the 5.2% to 5.3% range, the rapid rise of the risk-free interest rate could open the downside space to $74,000 to $75,000; a more extreme tail risk could open a channel between $54,000 and $38,000 (corresponding to Stifel's trendline analysis target), which would imply a complete retracement of the gains from the 2025 bull market, significantly extending the duration of the bear market. The current probability of the bearish scenario is about 20%, but the risk-reward profile is asymmetrical—once the $74,000 support is breached, programmatic stop-losses could trigger cascading sell-offs, leading to declines exceeding the reasonable range based on fundamentals.
In summary, the current market is in a structural turning point where "macro pressure testing" and "institutionalization deepening" coexist. The warning from the bond market has not yet been lifted, and the support range of $76,000 to $75,000 is facing severe tests. However, against the backdrop of extreme pessimistic sentiment, continuous accumulation by long-term holders, and the ongoing narrative of mining transformation, market bottom signals are gradually accumulating. Investors at this stage should maintain position flexibility, avoid aggressive chasing of price increases or heavily buying at the bottom, and patiently await the emergence of macroeconomic turning points. When the "Fed put option" is reactivated and bond yields turn downward, the next round of increases in the crypto market will have a more solid macro foundation.
免责声明:本文章仅代表作者个人观点,不代表本平台的立场和观点。本文章仅供信息分享,不构成对任何人的任何投资建议。用户与作者之间的任何争议,与本平台无关。如网页中刊载的文章或图片涉及侵权,请提供相关的权利证明和身份证明发送邮件到support@aicoin.com,本平台相关工作人员将会进行核查。


