Cryptocurrency Scholar: The first effective rebound of the downtrend line on May 21! Around SOL86, how to judge the authenticity of the rebound? Latest market analysis and operational advice explained
Brothers trading SOL, raise your hands! Some friends have recently been asking about the market for SOL, looking confused? Just when they bottomed out, it fell; just when they cut their losses, it rose, being slapped in the face back and forth, and their mentality is almost breaking down? Today, we will directly pull apart the double cycle market of SOL clearly, from moving averages, MACD, to Bollinger Bands, every signal will be explained to you, and key long and short positions and stop losses will be laid out clearly, so that after reading, you will know how to operate next, and you won’t be like a headless fly anymore!
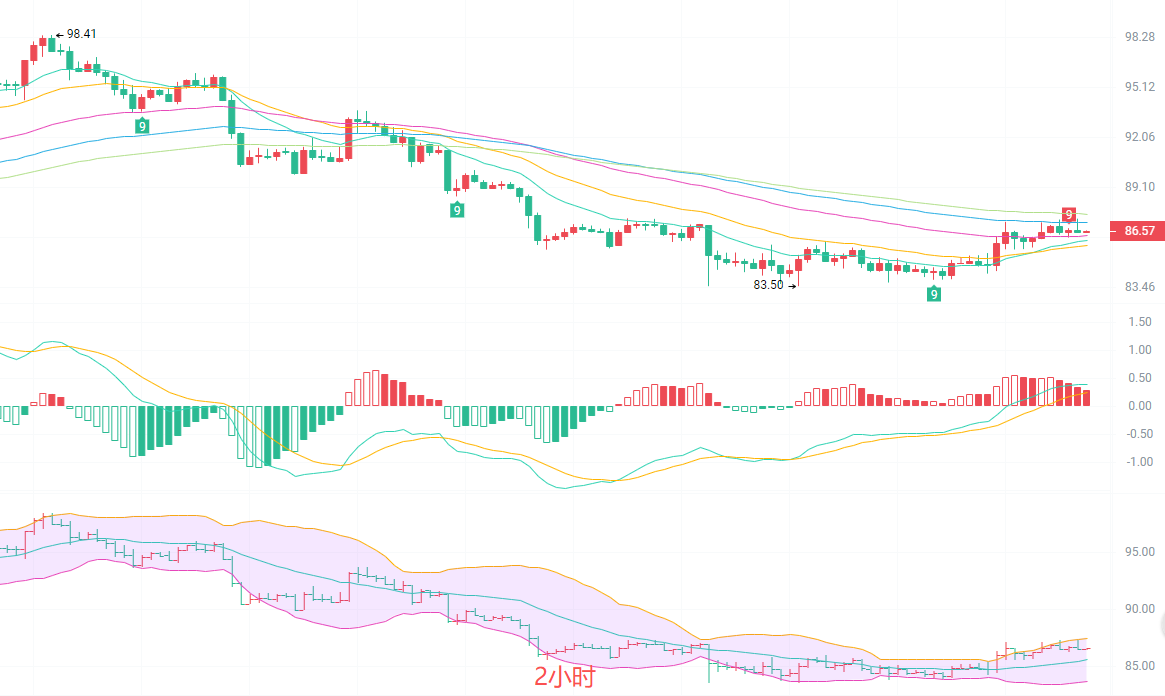
Looking at the 2-hour cycle, the current price of SOL is 86.48, having rebounded from a low of 81.40, it has already stood above the short-term moving average group, while the mid-term moving averages are still arranged downward, indicating that the rebound has not changed the larger downward trend. After the MACD indicator experienced a golden cross, the red bars continued to expand, with bullish momentum gradually being released. The middle track of Bollinger Bands at 85.57 has strong support, the upper track at 87.46 is a strong pressure in the short term, and the price is currently within a rebound channel between the middle track and the upper track. In the short term, if it can stabilize above 87, there is a possibility of further probing to 88.5, otherwise, it is highly likely to return to fluctuate downward.
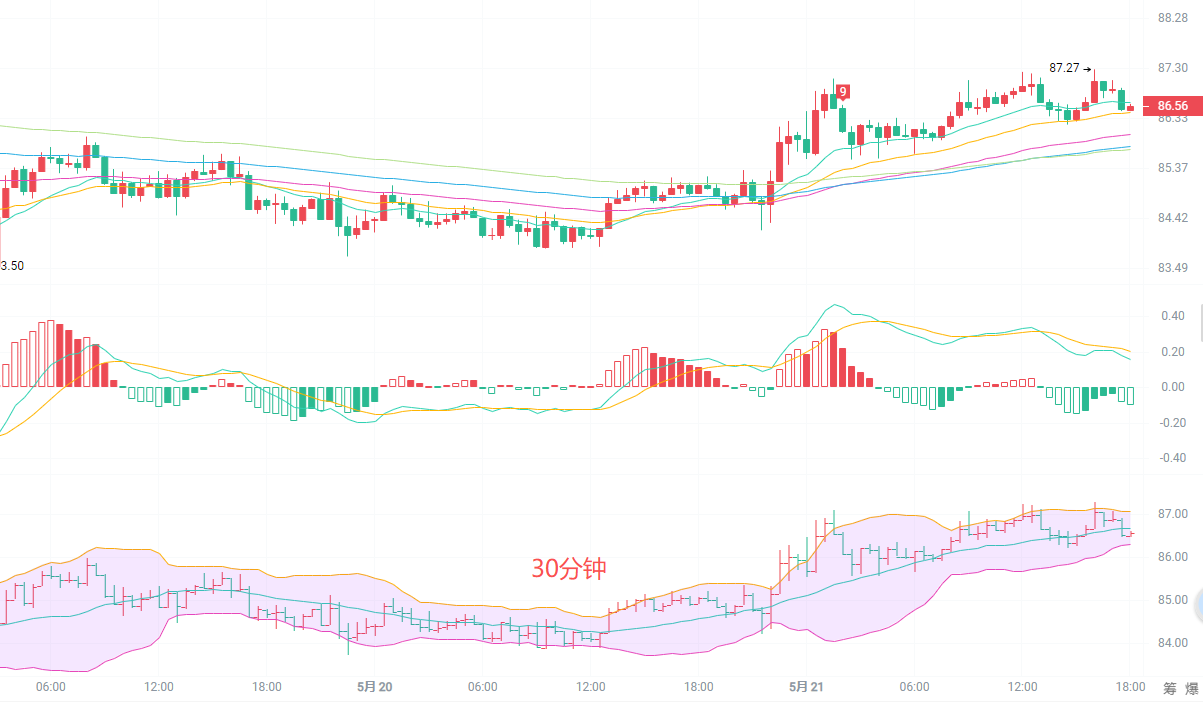
On the 30-minute cycle, the price remains fluctuating above the middle track of Bollinger Bands, and the short-term moving averages are arranged upward, indicating that the small-scale trend is still bullish. However, the MACD indicator has shown signs of a death cross, the red bars are continuously shrinking, and upward momentum has significantly weakened. Additionally, the price has repeatedly tried to hit the upper track without success, with insufficient upward force, making it highly likely to retrace and test the support near the middle track of Bollinger Bands at 86.6. Overall, the small-scale upward momentum is insufficient, indicating a need for a pullback to build strength; at this time, chasing longs carries a high risk, and it is necessary to wait for a stabilization after a pullback before considering.
Long and short entry points
Long strategy: Rebound at 86.0-86.2 upward, stop loss at 85.5, target 87.3-87.5 with a breakout looking at 88.2
Short strategy: Rebound at 87.3-87.5 downward, stop loss at 88.0, target 86.0-85.8 with a breakdown looking at 84.5

Friendly reminder: The above content is only created by the author for Weibo; the advertisements at the end of the article and in the comments section are unrelated to the author, please identify them carefully. Thank you for reading.
免责声明:本文章仅代表作者个人观点,不代表本平台的立场和观点。本文章仅供信息分享,不构成对任何人的任何投资建议。用户与作者之间的任何争议,与本平台无关。如网页中刊载的文章或图片涉及侵权,请提供相关的权利证明和身份证明发送邮件到support@aicoin.com,本平台相关工作人员将会进行核查。