Academician of the Cryptocurrency Circle: On May 22, the forces of long and short positions are fiercely hedging, is the Bitcoin volatility range about to reach a breaking point? Latest market analysis and operational suggestions
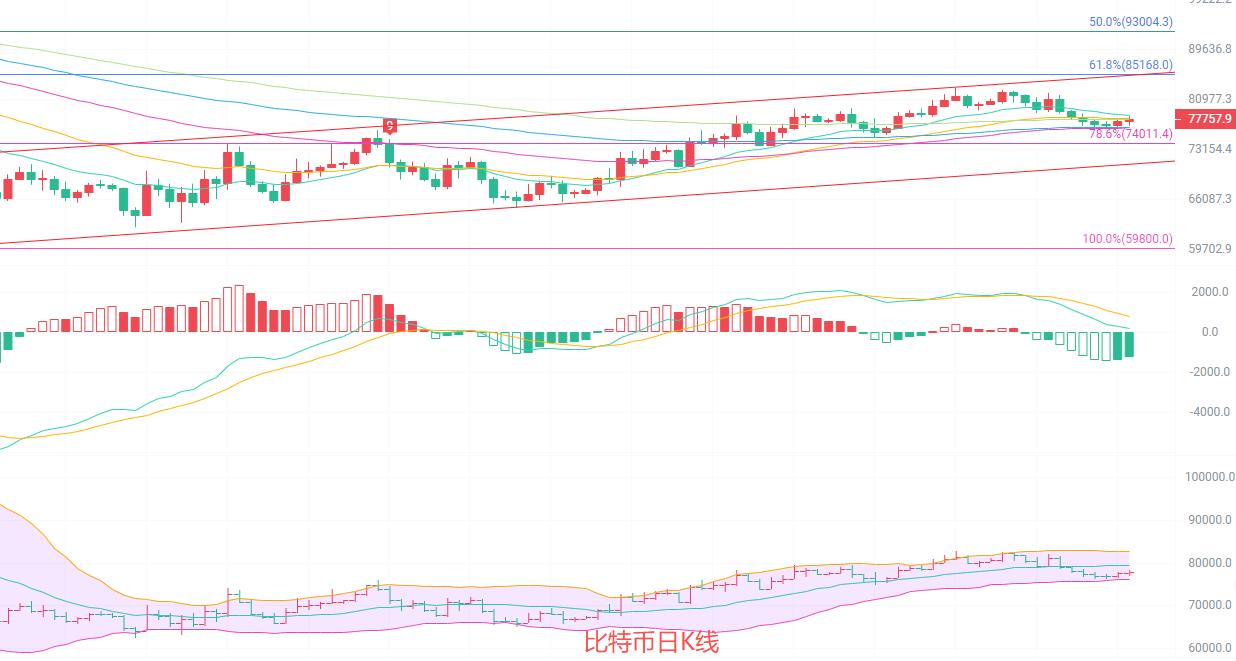
The current price of Bitcoin is 77,700, the daily K-line is below the middle track of the Bollinger Bands, and the overall Bollinger Bands are converging. The upper track is 82,633 and the lower track is 76,187, the short-term volatility range is narrowing. In terms of moving averages, EMA15 has crossed below EMA30, indicating a short-term bearish trend, but EMA60 at 76,452 still provides support below the price, forming a pattern of upper pressure and lower support. The MACD indicator shows that DIF has crossed below DEA, and the green bars continue to expand, with southward momentum dominating. The KDJ indicator's three lines diverging downward indicates a short-term need for a correction, with a focus on the effectiveness of support at the lower track of the Bollinger Bands at 76,200; if it breaks down, it may open up downward space.
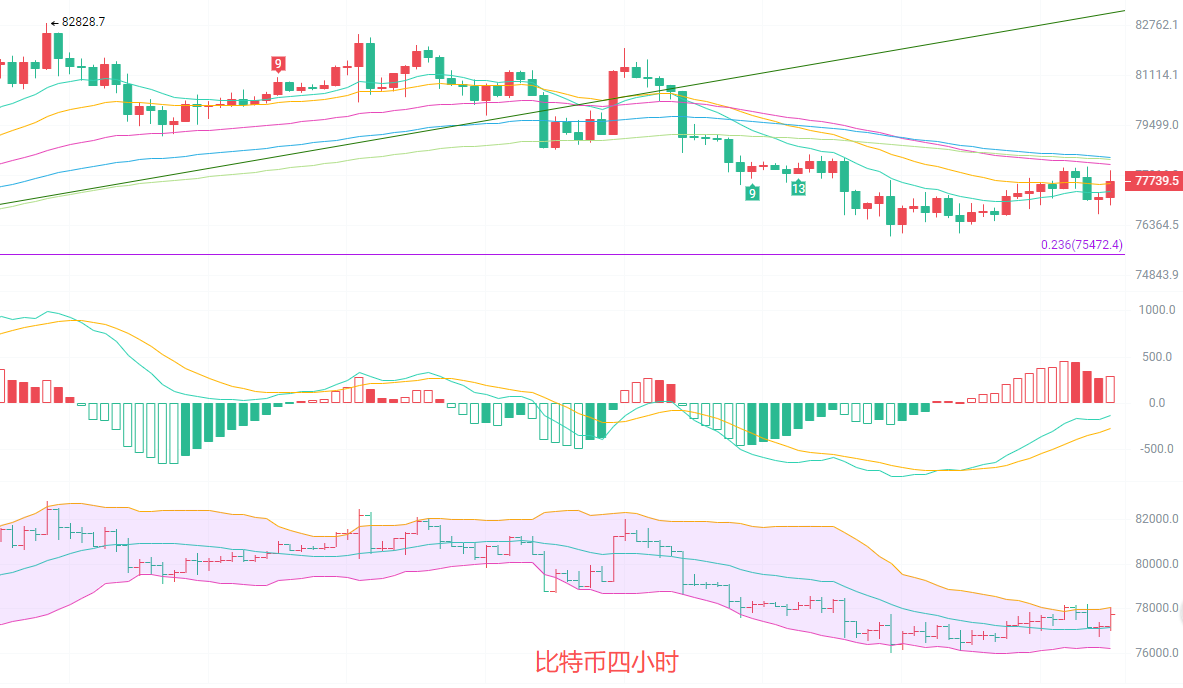
The four-hour K-line is near the middle track of the Bollinger Bands, with the bands opening downward; the upper track is 78,032 and the lower track is 76,242. The price has tested the upper track multiple times but has not been able to break through effectively, indicating obvious resistance. In the moving average system, EMA15 has turned upward, forming a potential golden cross with EMA30, suggesting short-term rebound momentum; however, EMA60 at 78,262 still exerts pressure on the price from above, limiting rebound space. In the MACD indicator, DIF has crossed above DEA, with red bars continuing to expand, indicating that northward momentum is recovering. Currently, it is in a weak rebound phase after a decline and has not yet broken the downward trend line, still overall pressured by the southward trend.
Short-term strategy reference: Follow the large cycle trend, with small stop-losses for quick in-and-out trades.
If trading north from 76,800 to 77,000, set a stop-loss at 76,000, aiming for a target of 78,000 to 78,500.
If trading south from 78,300 to 78,500, set a stop-loss at 79,300, aiming for a target of 77,200 to 76,500.
If the upper northward pressure level breaks through 79,000, it indicates that the northward recovery exceeds expectations, requiring a stop-loss to exit. The current market is showing a downward bias, with a priority on short-selling during rebounds; long positions should only be engaged in short-term recovery speculation, controlling positions to within 30%.
The current price of Bitcoin is in a back-and-forth struggle, with both bulls and bears in a deadlock. Many traders tend to fall into the trap of guessing tops and bottoms, and subjective directional predictions can often lead to missteps. Market trends do not comply with personal expectations; holding positions against the trend is a major trading taboo. No matter how good the analysis is, it should only serve as a reference; practical operations must strictly adhere to risk management principles and reasonably control position sizes. In the cryptocurrency space, profits are not about single instances of explosive gains but about long-term stability. Being calm and following the trend, without panic, is essential to avoid risks and seize opportunities.

Friendly reminder: The above content is solely created by the author on Weibo. The advertisements at the end of the article and in the comments section are unrelated to the author, please discern carefully. Thank you for reading.
免责声明:本文章仅代表作者个人观点,不代表本平台的立场和观点。本文章仅供信息分享,不构成对任何人的任何投资建议。用户与作者之间的任何争议,与本平台无关。如网页中刊载的文章或图片涉及侵权,请提供相关的权利证明和身份证明发送邮件到support@aicoin.com,本平台相关工作人员将会进行核查。