Dear friends, I am Qinglan. Today, May 25th's market, we must first focus on two significant news items. The first is that the U.S. Republican Party is pushing for a Bitcoin Reserve Bill, aiming to accumulate 5% of the world's Bitcoin, which is a strong positive signal that directly strengthens the narrative of Bitcoin as digital gold. In the long run, this is an important signal of increasing sovereign demand. But on the other hand, 2,650 Bitcoins from the Satoshi era miners have shifted to market makers, which is a typical negative signal as large whales moving to market makers often indicate selling pressure. These two pieces of news, one positive and one negative, combined with the current market sentiment which is extremely fearful, with a Fear and Greed Index of only 25, suggest that the market is at a critical juncture of bullish and bearish dynamics. Our analysis today will seek to find the true direction from these data.
Current Price and Time
The current time is May 25th, 10:18, with Bitcoin quoted at 77,299 USDT, a 24-hour increase of 0.41%. The overall volatility is small, but the technical indicators are brewing a trend change. We need to use the Qinglan TPV system to break down the true state of this position.
Multi-Cycle Status Overview
First, let's look at the daily chart. The daily MA5 is at 76,854, MA10 is at 77,126, MA30 is at 78,610, and the price is currently oscillating between MA5 and MA10 but below MA30. The MACD DIF is -180.40, DEA is 254.80, and the histogram is -435.20, indicating that bearish momentum continues to release, but the RSI is only 33.00, having entered the oversold region. The daily chart reflects a bearish trend, but oversold conditions may trigger a rebound.
4-Hour Cycle. MA5 is at 76,965, MA10 is at 76,663, MA30 is at 76,851, and the price has already risen above MA5 and MA10. The MACD DIF is -67.42, DEA is -250.58, and the histogram is 183.17, which is a clear bullish divergence signal, indicating diminishing bearish momentum and that bulls are beginning to attempt a counterattack. RSI is at 61.92, in a moderately strong area.
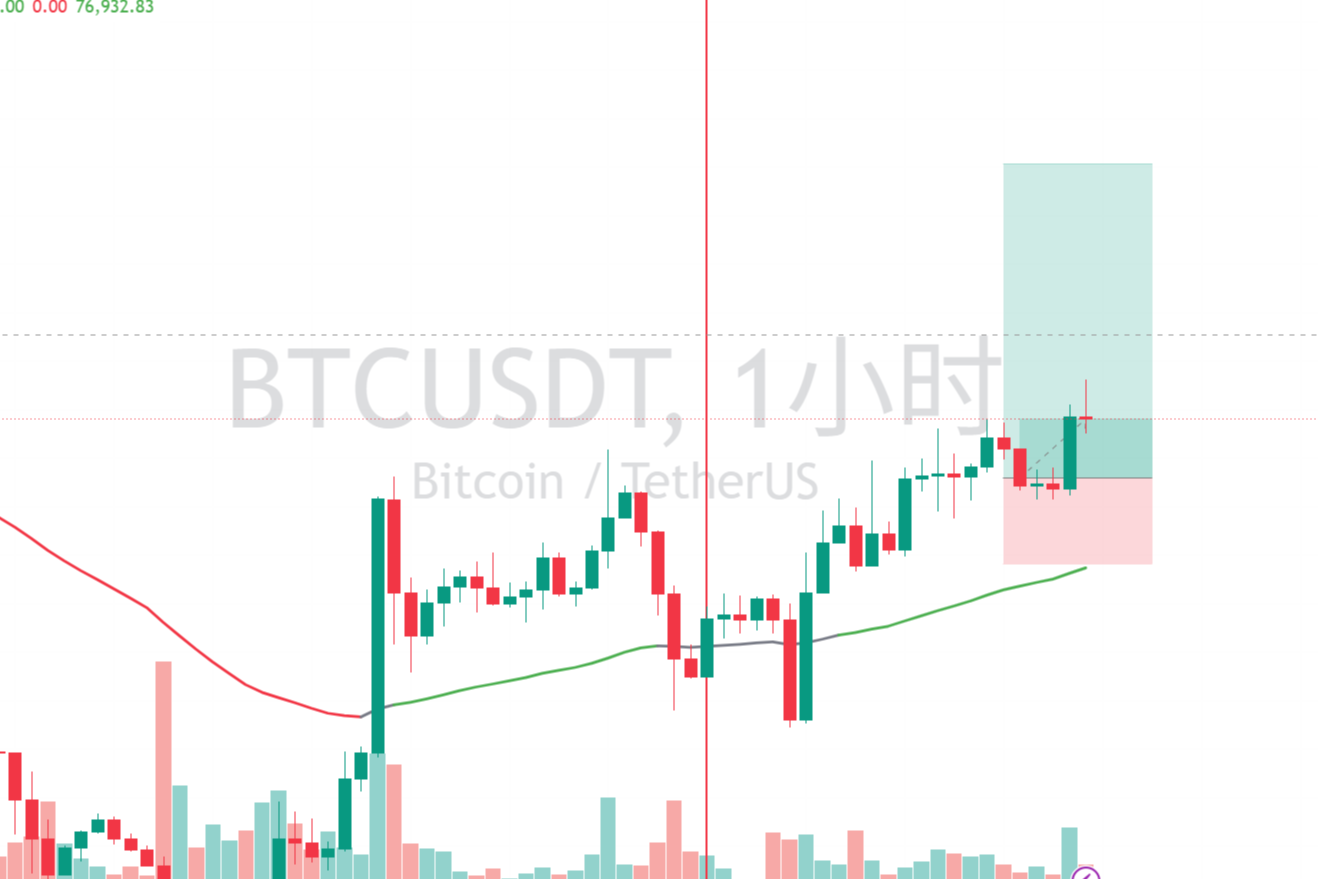
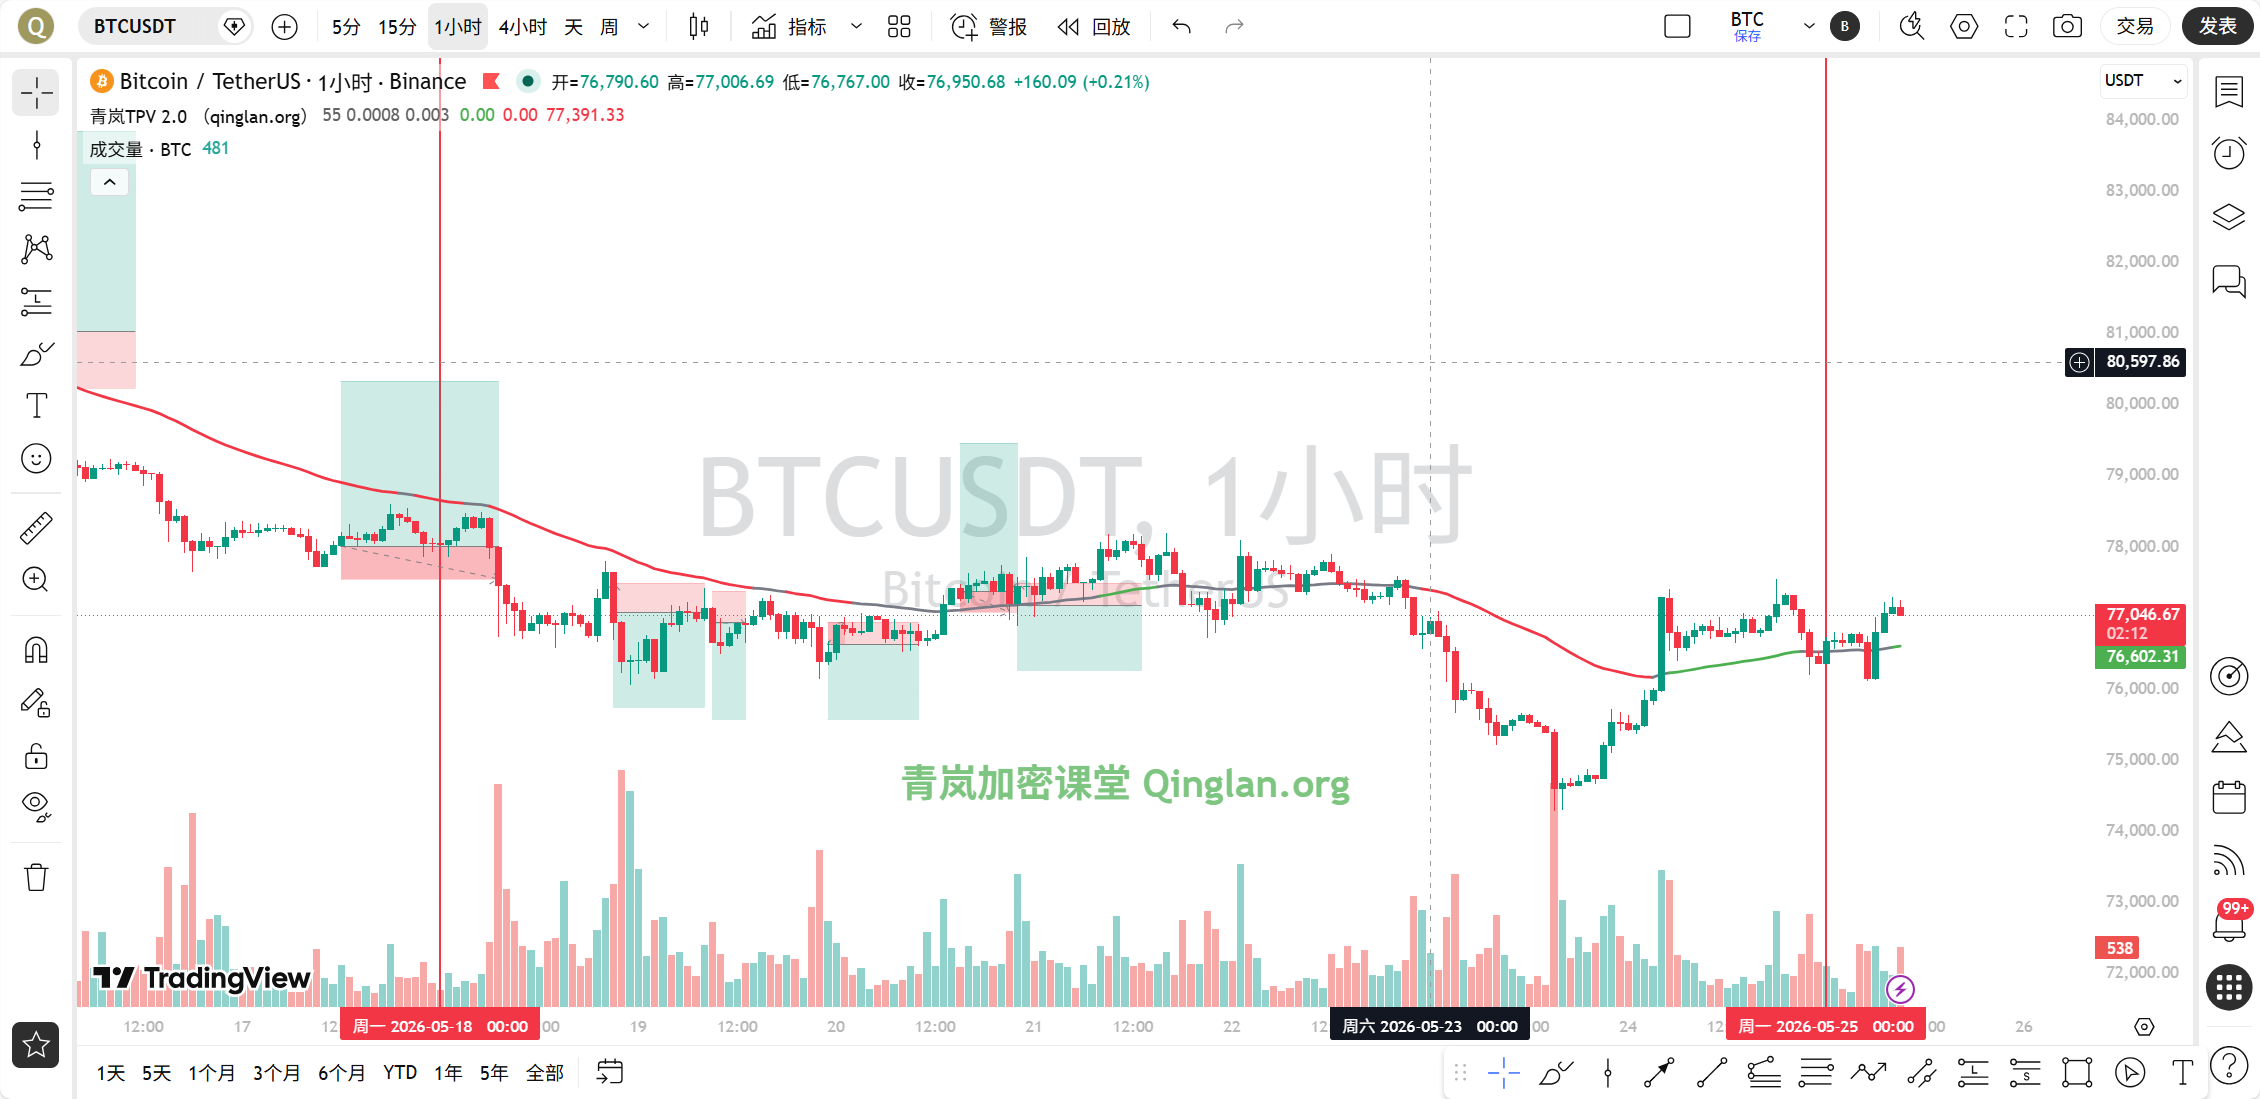
1-Hour Cycle. MA5 is at 77,053, MA10 is at 76,821, MA30 is at 76,828, and the price is above all these moving averages. EMA55 is at 76,638, and the current price is at 77,299, about 0.86% higher than EMA55. The MACD DIF is 147.30, DEA is 121.77, and the histogram is 25.52, indicating that bullish momentum continues to expand. RSI is at 52.66, neutral but leaning stronger.
15-Minute Cycle. MA5 is at 77,190, MA10 is at 77,181, MA30 is at 76,879, and the price is operating above MA5 and MA10. The MACD DIF is 139.55, DEA is 119.49, and the histogram is 20.06, indicating ongoing bullish momentum. RSI is at 63.62, strong but not overbought.
In summary, the daily chart indicates bearish but oversold conditions, the 4-hour chart shows bullish divergence, while the 1-hour and 15-minute charts are in a bullish arrangement. This is a typical short-long pattern, and we need to use the TPV system to confirm if we can go long.
TPV Signal Verification
According to the Qinglan TPV system, we take the 1-hour EMA55 as the boundary for bullish and bearish. The current price of 77,299 is above EMA55 at 76,638, so the trend is positioned as bullish.
Now to verify the conditions for going long. First, the price must stay above the 1-hour EMA55. In the last 8 1-hour candlesticks, the closing price has been above EMA55 7 times, and it has crossed it 2 times; the condition of 2 consecutive candlesticks closing above EMA55 has been met. Second, support must stabilize. From the 4-hour chart, the price has formed a bottom characteristic near 76,600, and there is a MACD bullish divergence, which is an effective support signal. Third, bearish momentum must be exhausted. The 1-hour MACD histogram has shortened for 2 consecutive periods, and the RSI has risen from 33 to 52, which meets the conditions for momentum exhaustion. All three conditions are met, and the TPV system provides a signal to go long.
Data from the oscillation also confirms that the current price is 0.86% above EMA55, exceeding the 0.3% oscillation threshold, and of the 8 candlesticks, 7 have closing prices above EMA55, with only 2 crossings, not matching the characteristics of oscillation, indicating a unilateral bullish trend.
On-Chain Funding Situation
On the chain data front, the Fear and Greed Index is at 25, indicating extreme fear, which is often characteristic of market bottom regions. BTC's market share is 58.26%, suggesting that funds are still seeking refuge in Bitcoin. However, there has been a net inflow of 18,500 BTC in the last 7 days into CEX, indicating increased inflow to exchanges and some short-term selling pressure. The good news is that the U.S. Republican Bitcoin Reserve Bill is anticipated to lead to long-term capital inflow, while the 2,650 BTC transferred by Satoshi era miners may be absorbed by market makers. Overall, the on-chain data exhibits mixed bullish and bearish signals, but extreme fear often corresponds to a phase bottom.
Key Support and Resistance Levels
The key resistance above is at the daily MA30 at 78,610, and near the 4-hour high at 78,000. The key support below is at the 1-hour EMA55 of 76,638, and the 4-hour bottom divergence initiation point at 76,000. If the price breaks below 76,638, the long logic becomes invalid and needs to be reassessed.
Trading Ideas
Based on the TPV system’s signal to go long, we provide the following trading ideas.
Direction: Go long.
Entry Conditions: The current price of 77,299 has met the conditions, but for more stability, it is advisable to enter when the price pulls back near the 1-hour EMA55, specifically in the 76,600-76,800 range, or wait for confirmation of the 15-minute MACD golden cross before entering. If the price directly breaks through 78,000, a long position can be pursued, but with light exposure.
Stop Loss: Strictly set below the 1-hour EMA55 at 76,500. If the price breaks below this level, it indicates that the bullish trend has been compromised, and one must exit.
Target Levels: The first target is 78,000, the second target is 78,600, which corresponds to the daily MA30 level. If 78,600 is broken, one can look towards the psychological level of 80,000.
Risk Warning
This strategy is based on the current technical indicators and on-chain data, but the 2,650 BTC transferred by Satoshi era miners may trigger short-term selling pressure. If the price breaks below 76,500, the bullish logic becomes invalid, and one must stop loss.
Follow Qinglan Crypto Classroom to seize more trading opportunities! Welcome to visit our official website www.qinglan.org
📊 Qinglan TPV Trading Strategy Backtesting Reference
🕒 Last Backtesting Time 05-25 07:00:02
Total Analysis: 1767 Backtests: 1599 Accuracy Rate: 66.9% (1070/1599)
免责声明:本文章仅代表作者个人观点,不代表本平台的立场和观点。本文章仅供信息分享,不构成对任何人的任何投资建议。用户与作者之间的任何争议,与本平台无关。如网页中刊载的文章或图片涉及侵权,请提供相关的权利证明和身份证明发送邮件到support@aicoin.com,本平台相关工作人员将会进行核查。