Good evening everyone, I am Xin Ya. Recently my market analysis skills have been hot, and I can't help but recite a poem.
With sharp eyes observing the market's waves, Xin Ya discusses the Dao of entanglement.
Patterns outline the forces of yin and yang, segments divide and define the center.
Price fluctuations follow a rhythm, retracements and reversals hide subtle skills.
Understanding the rise and fall of matters, following strategies with calm and composure.
Fine, let's have another five-character poem.
New eyes observe the clouds and winds, Xin Ya's heart discerns depth and shallowness.
Explaining the rise and fall of trends, the entanglement method establishes the world.
Let’s take a brief review. This morning at six o'clock, Bitcoin was around 76,000, with KDJ and RSI both giving a gold cross on the one-hour chart, and the price was pulled up to around 77,700, with RSI in the middle position. During this process, there was resistance at 77,300. The four-hour MACD's bullish and bearish columns changed positions around 76,600. We can mark these two positions. The four-hour MACD, with the DIF line already entering the zero axis, the histogram expanding while trading volume does not keep up, showing a weak rebound momentum. The current running price has returned to the central area of last week's 76,800 to 77,800 entanglement. Due to weekend washouts, the current amplitude will increase. Both lower at 75,200 and upper at 79,400 are reasonable ranges.
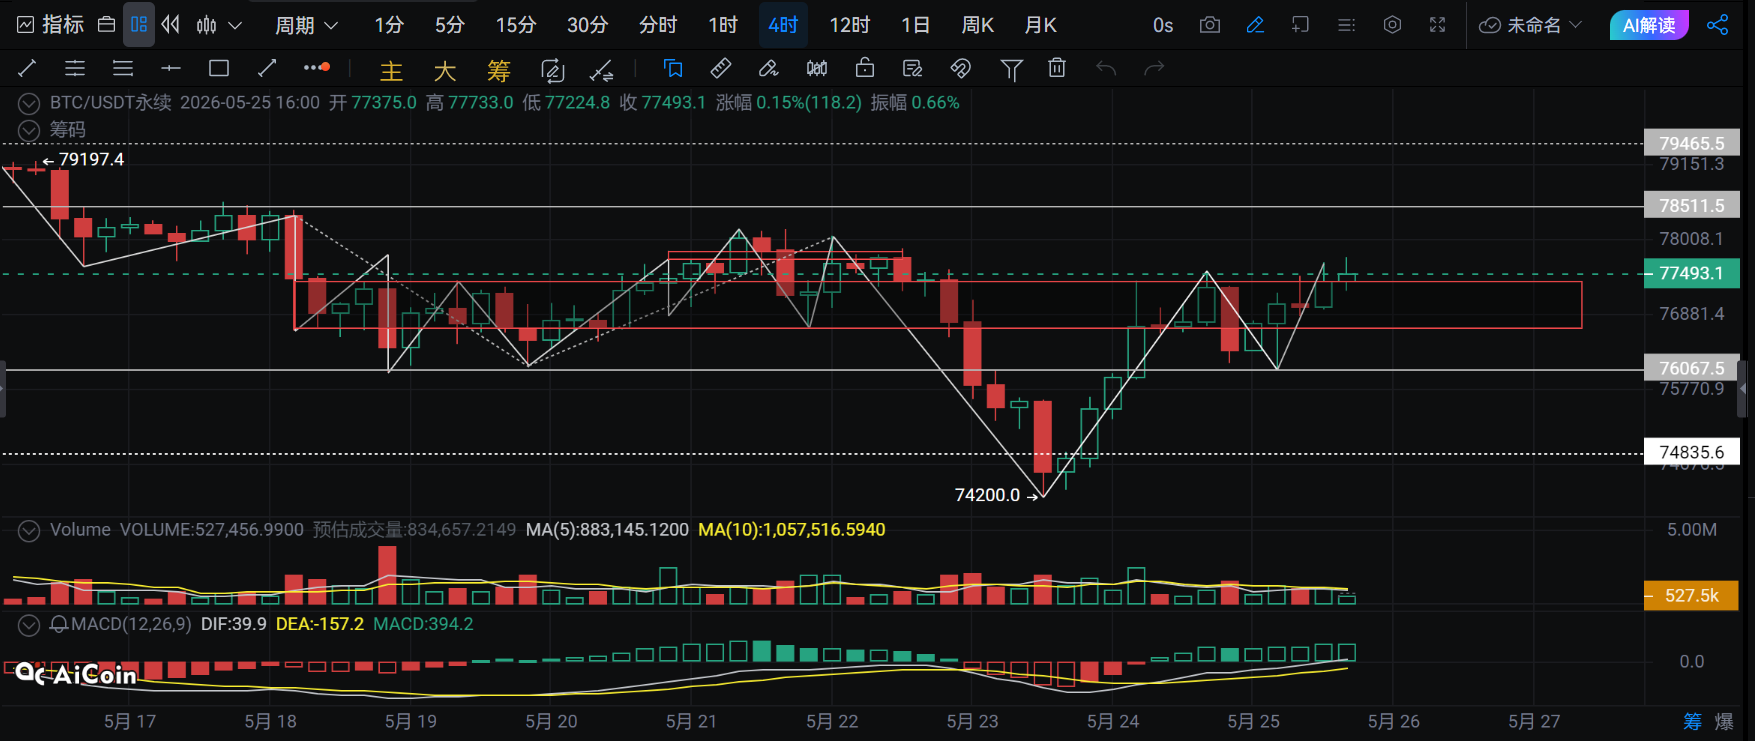
On the four-hour chart, the EMA120 and EMA144 are around 77,800, and on the one-hour chart, both EMAs are around 76,800. It is important to note that the daily EMA120 is around 77,600, and the EMA144 is around 78,750. There are multiple levels of resistance above, which will form a potential psychological pressure expectation, but due to the weekend's washout, even if the pressure needs to be tested, it won't be significant.
Key attention levels above are 77,800, 78,500, and 79,500.
Key attention levels below are 77,300, 76,800, and 76,000.
In my view, the market will lean towards volatility, and the range has expanded. The major directional signals have not appeared. The lower level of 76,000 and the upper level of 78,500 will be tested. The best risk-to-reward strategy is to trade in the 76,000 to 78,000 range repeatedly. The pressure of multiple levels should be planned lightly, and high-frequency trades can be handled with shorts. Stop-loss for swings only needs to be a few hundred points. As long as there are no losses, it can be repeatedly profited. If you prefer not to trade frequently, leave a buffer for additional short positions around 78,200.
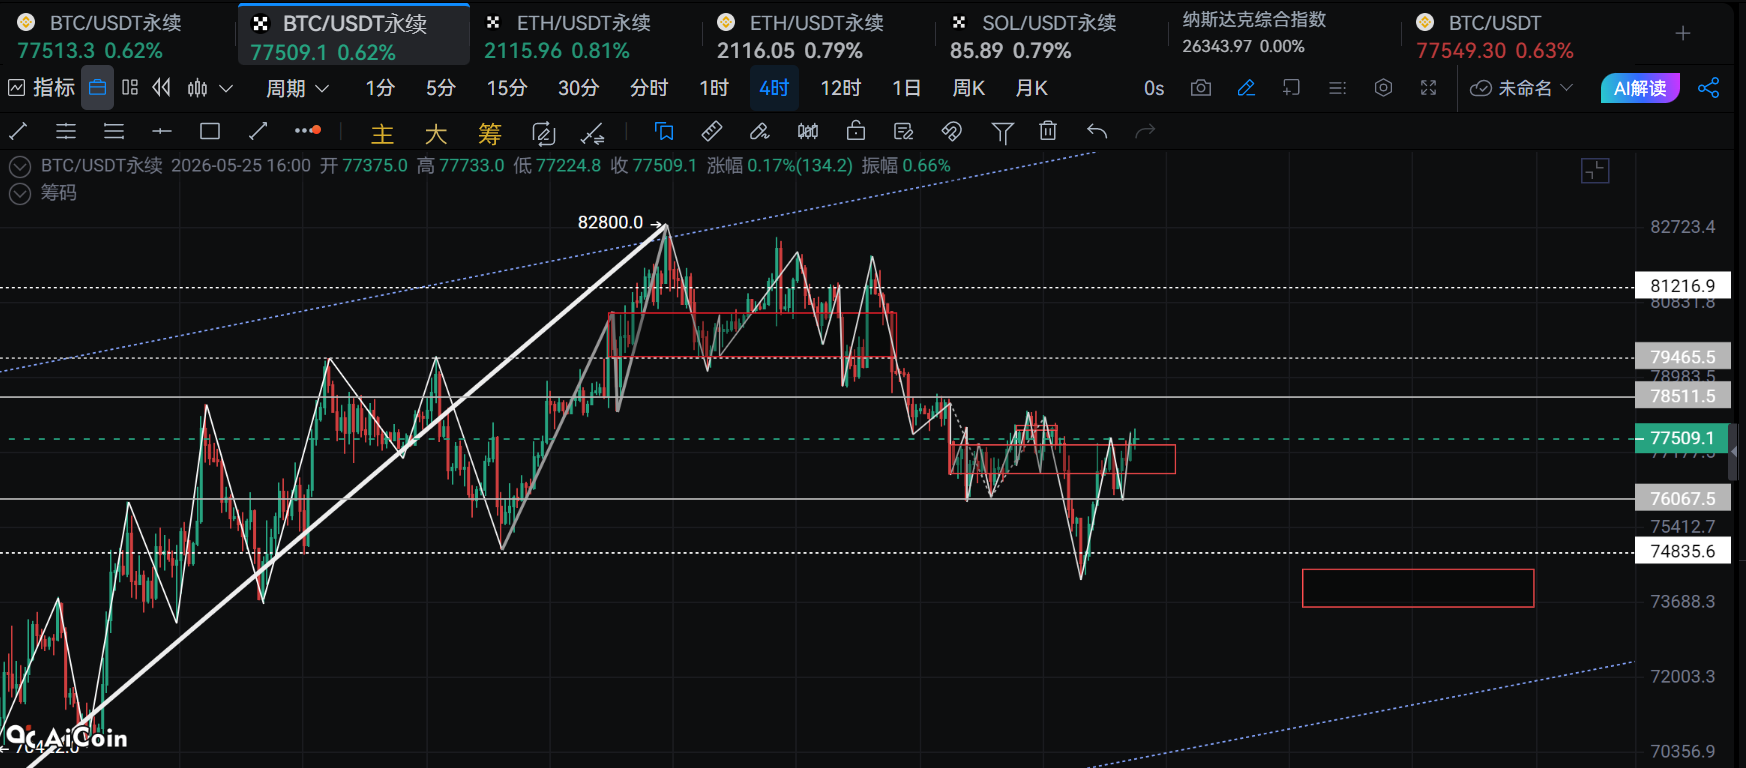
As for the major direction, I am not optimistic about people considering the above moving averages as strong resistance. Because the four-hour pattern is in the process of forming a diamond bottom, the risk on the left side is extremely high, and the market can only be handled through swings. The current structure has many possible evolutions and will depend on the suppression effect near 78,500. If it goes up first and meets strong resistance, once it falls below 76,000 again, it will aim for around 74,800 to form a new midpoint. If the resistance is not strong, it will only retest 76,000 and continue to build the diamond; only then will there be a clear signal.
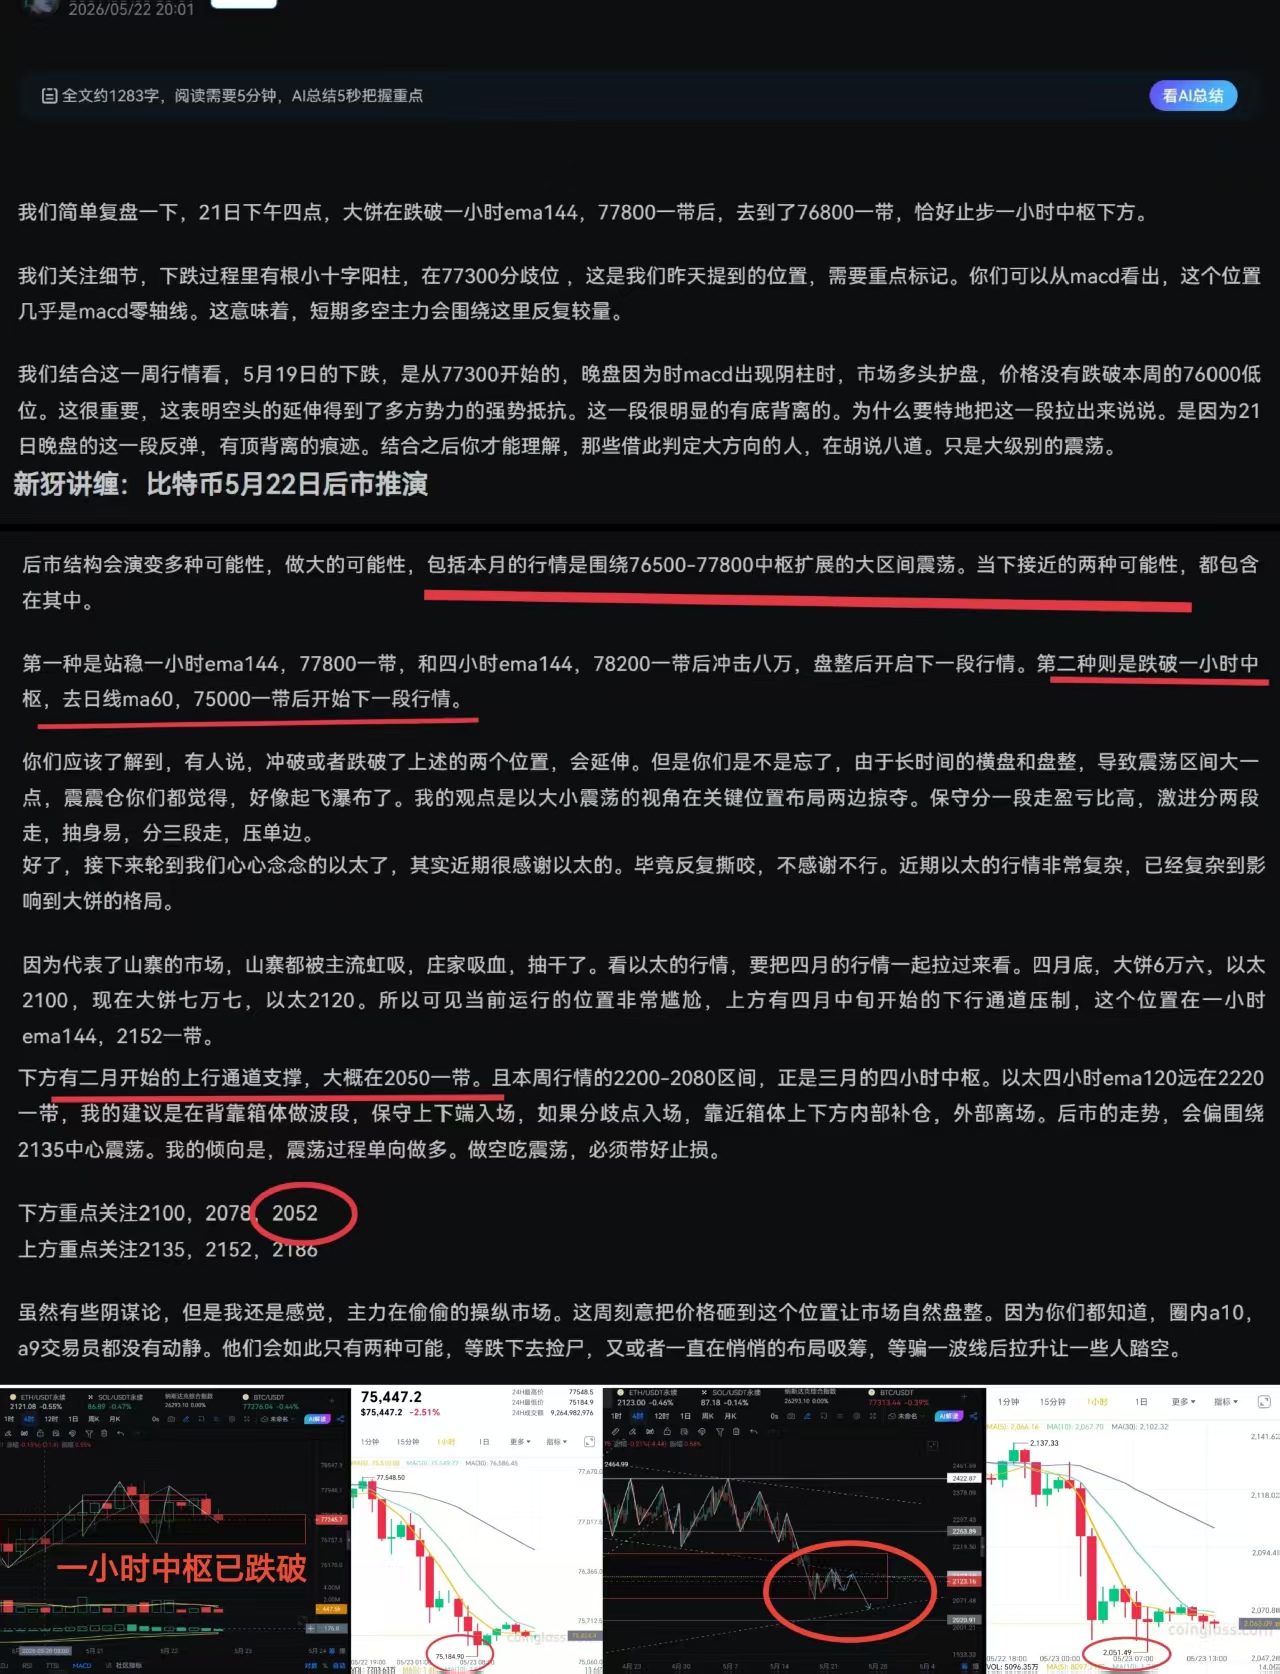
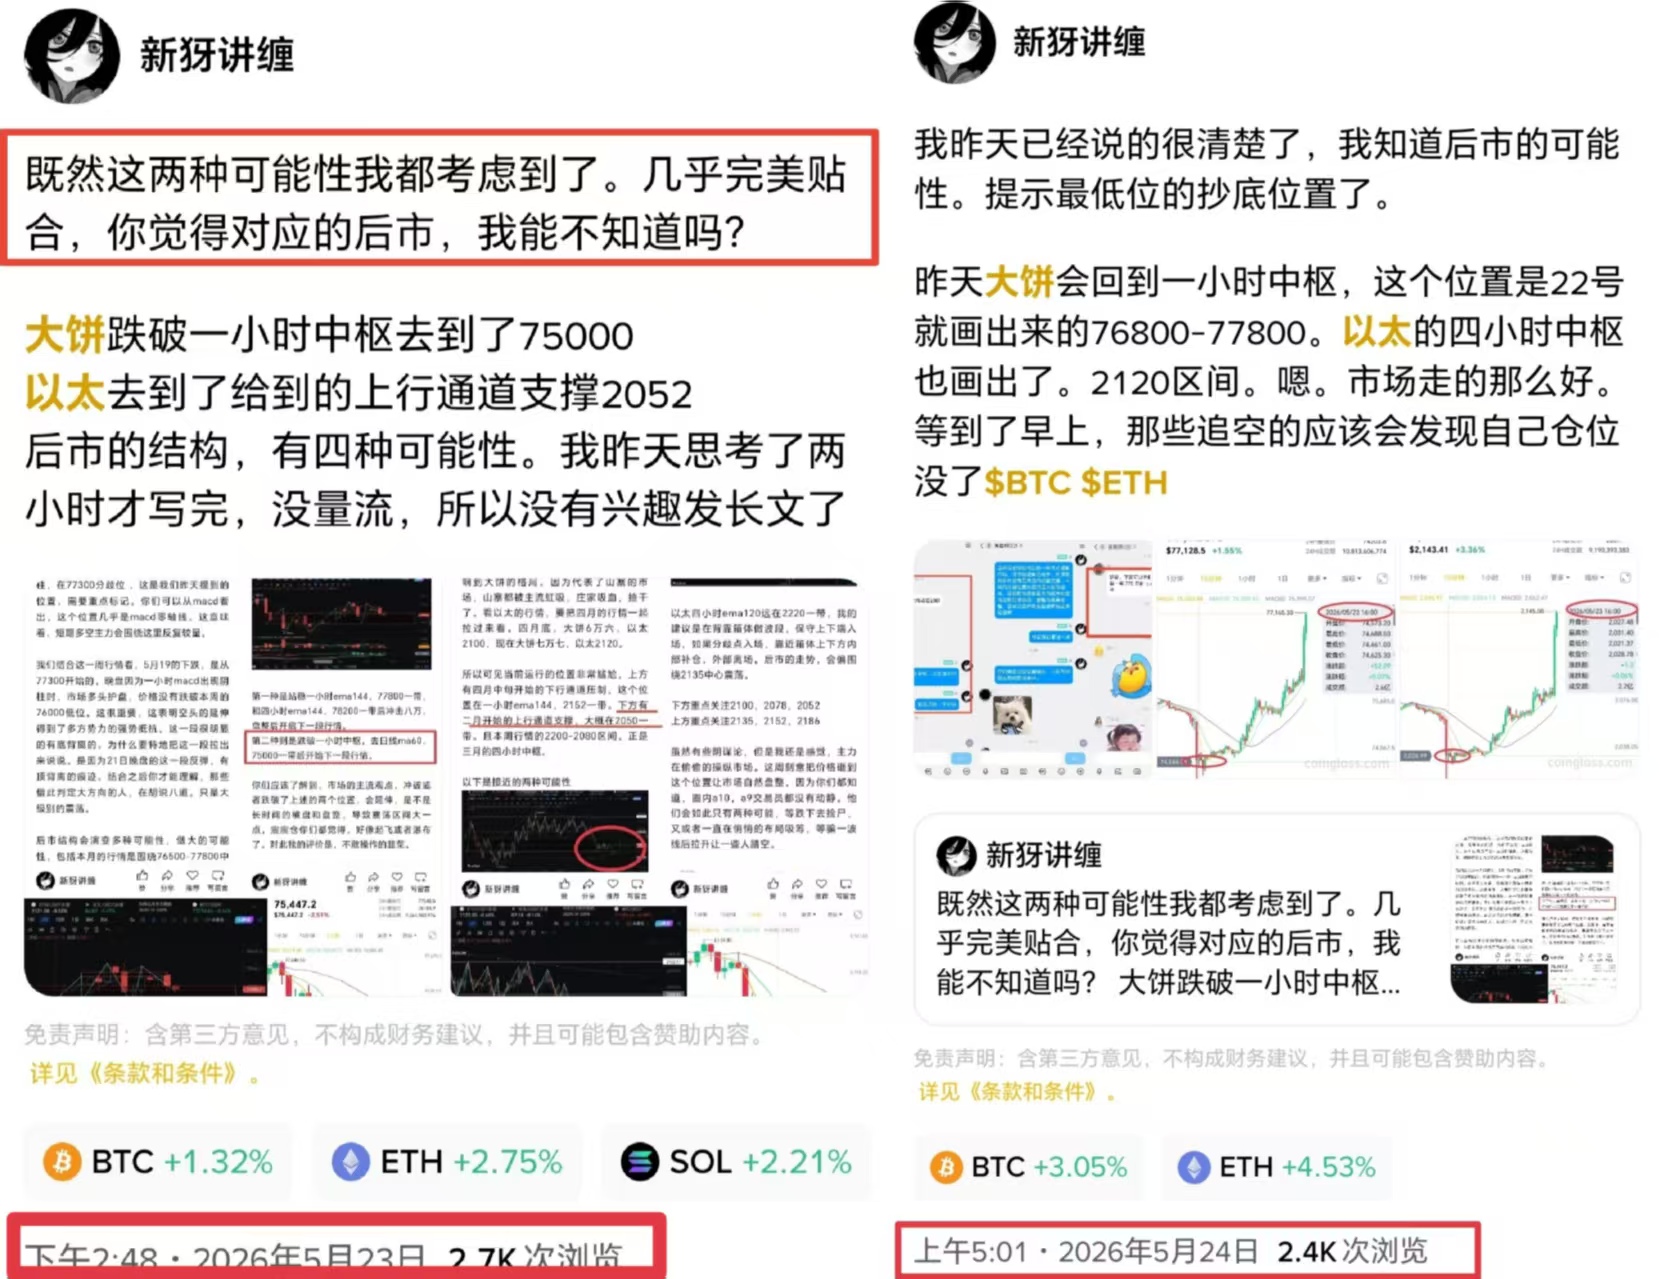
Anything that infers major direction based on known information is nonsense. If you had properly examined Xin Ya's thoughts on the 22nd and the hints on the 23rd, you would naturally understand that the main force is not extremely ruthless, but my thinking is above that.
Observing Ethereum's four-hour chart from last night at eight and four this morning, two bearish candles surrounded one bullish candle, with the pin location being significant. In the second segment of the decline on the 23rd, falling to 2060, it rebounded to 2100 before the daily close, strongly pulling upwards during the day with the price peaking at around 2,120. Observing the four-hour K-line, it is clear to see the divergence around 2100. Currently, the one-hour EMA120 and EMA144 are around 2,115, displaying a damping effect, while the resistance zone is at around 2,150, the lower boundary of the descending channel that began in April.
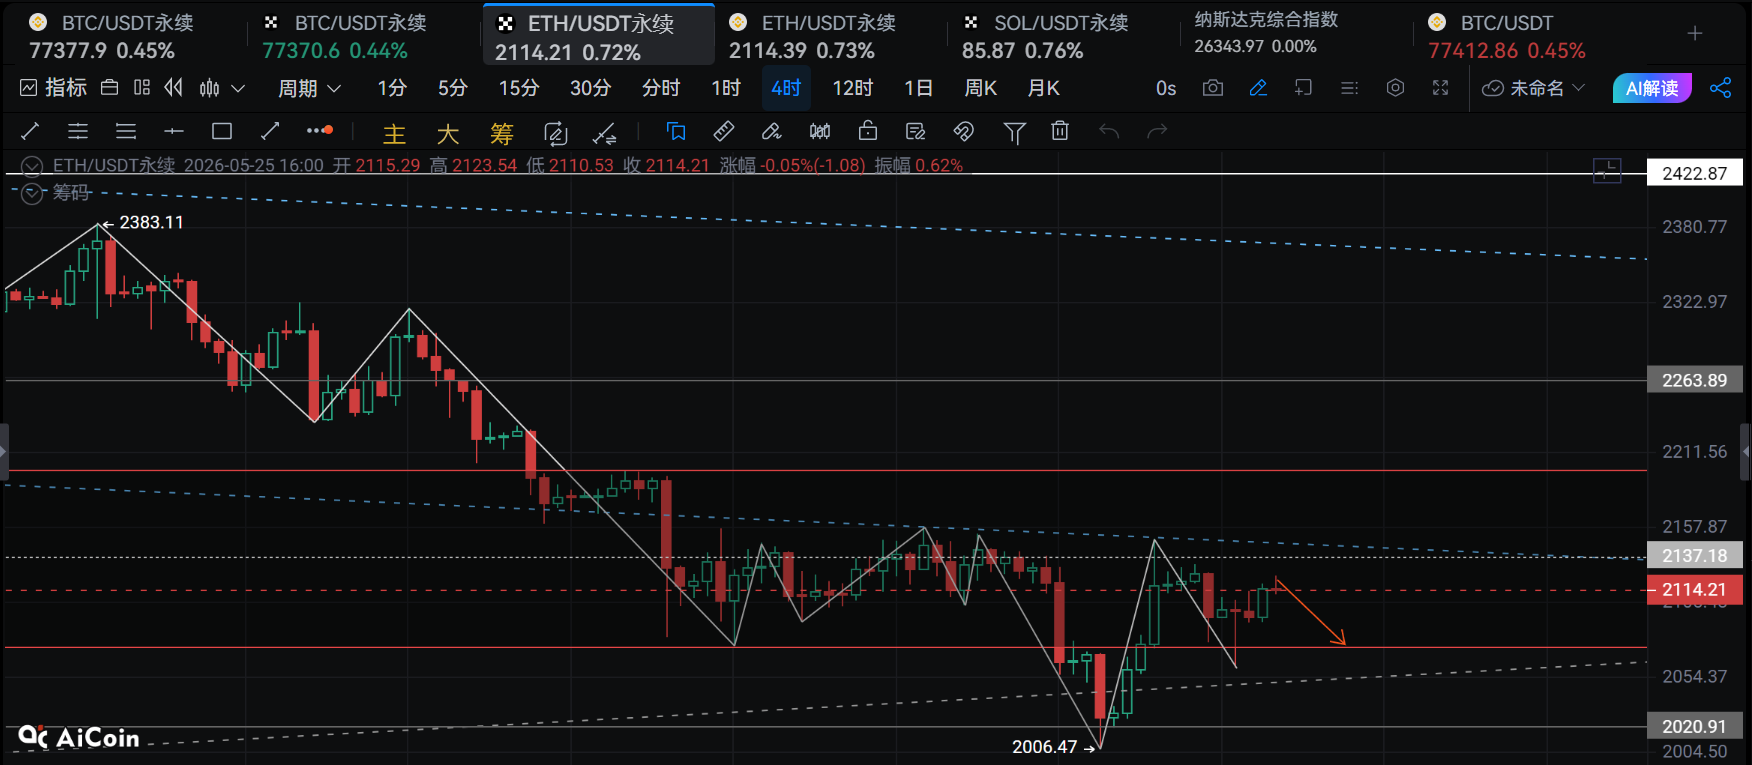
The structure has many possibilities, but my inclination is to test downwards first. Because from the K-line progress, one can sense the main force's expectation: dropping for a while, weak rebound, hmm, dropping again, tricking a bit to shift positions and catch some waves, rebound, and if that doesn't work, continue to test.
Therefore, my approach is to handle it with a bias towards volatility; at all divergence points, treat them as reasonable oscillation ranges, 2068-2147. Currently, focus on three divergence positions: 2080, 2100, and 2135. Still, handling it lightly with a bias towards shorts, eating from both ends in high-frequency trades. If not wanting to trade frequently, leave a buffer zone for additional short positions.
All the possibilities were deduced last week, but unfortunately, you didn't pay attention; otherwise, you could have profited from the full V rebound.
Following along, official account: Xin Ya talks about entanglement.
免责声明:本文章仅代表作者个人观点,不代表本平台的立场和观点。本文章仅供信息分享,不构成对任何人的任何投资建议。用户与作者之间的任何争议,与本平台无关。如网页中刊载的文章或图片涉及侵权,请提供相关的权利证明和身份证明发送邮件到support@aicoin.com,本平台相关工作人员将会进行核查。