Bitcoin (BTC) Market Analysis
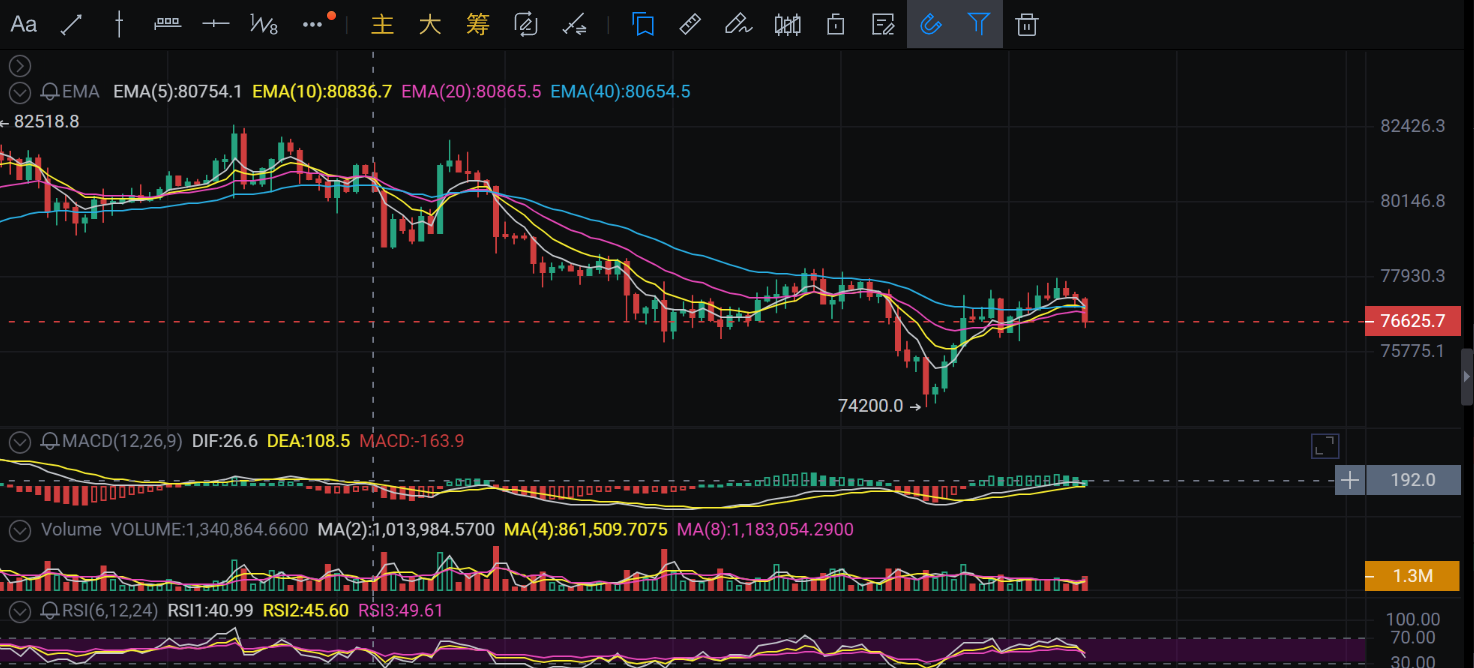
Current Status: High volatility, intense battle between bulls and bears, just before direction choice
Moving averages entangled, lacking direction
Observing the EMA indicators, the four moving averages EMA(5), EMA(10), EMA(20), and EMA(40) are highly intertwined, with values all within the extremely narrow range of 80650-80860.
Interpretation: This indicates that the market is currently in a state of extreme entanglement, with short-term and mid-term holding costs almost identical. Such “moving average entanglement” usually occurs on the eve of a trend change; once the price effectively breaks through this range (either up or down), it often triggers a smooth one-sided trend.
MACD death cross continues, bears dominate
The MACD indicator shows that the DIF (26.6) is below the DEA (108.5), and the MACD histogram is negative (-163.9).
Interpretation: Although the price is still consolidating, the momentum indicators are weak. The death cross state means that the bearish forces have a slight upper hand in the short term, and rebounds are weak. If the price cannot quickly rise to reclaim lost ground, it may trigger further pullbacks.
RSI indicator extremely low
The RSI1 value is only 40.99, in a weak area (below 50).
Interpretation: Market sentiment is weak, and buying interest is not strong.
Key Levels
Resistance above: Around 77930 (previous high point of the rebound).
Support below: 74200 (previous low point).
BTC Trading Strategy:
Mostly wait and see, waiting for a breakthrough. Currently in "garbage time," the fluctuations are extremely grinding.
Short selling idea: If the price bounces back to around 78000 and meets resistance with insufficient volume, consider a short position, aiming to see a return to 76000.
Long buying idea: Only when the price breaks out of the EMA dense area with sufficient volume and stabilizes, or if it tests 74200 without breaking below and shows a bullish divergence, is it a solid point to enter long.
Ethereum (ETH) Market Analysis
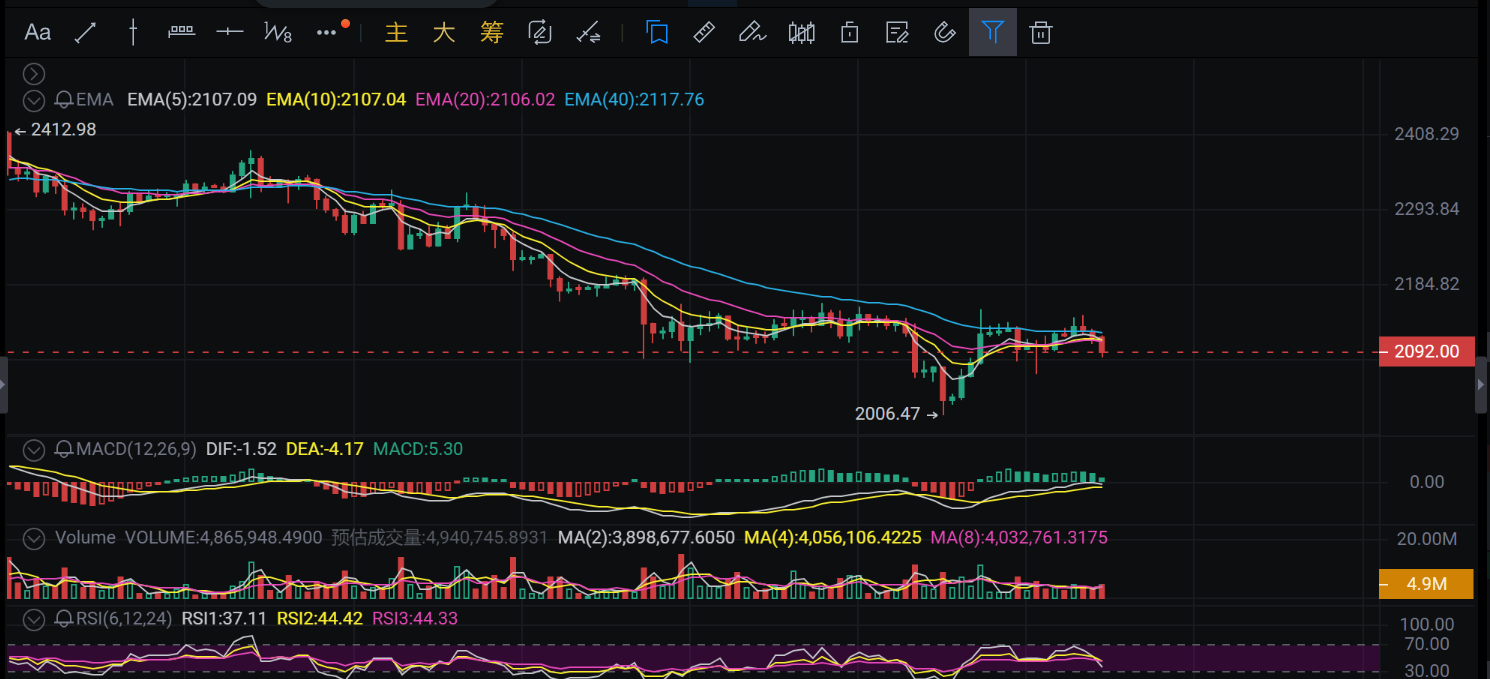
Current Status: Oversold rebound, bottom construction ongoing, stronger than BTC
Moving averages begin to turn, early signs of bullish arrangement
Unlike BTC, ETH's EMA(5) 2107 and EMA(10) 2107 have flattened out or slightly tilted up, with prices stabilizing above the short-term moving averages.
Interpretation: This is a positive signal, indicating that after the previous deep decline (falling to 2006), buying interest is entering, and the short-term trend is shifting from bearish to bullish.
MACD golden cross expansion, strong momentum
The MACD indicator shows that the DIF (-1.52) is still below the zero axis, but it has crossed above the DEA (-4.17), forming a golden cross, and the red momentum bars (5.30) are appearing.
Interpretation: This is a typical signal of a bottom rebound. Compared to BTC's death cross, ETH's momentum is obviously stronger, indicating that funds are flowing from BTC to ETH, or that ETH's selling pressure has been fully released.
RSI indicator recovering
The RSI1 value is 37.11; although still at a low level, considering the candlestick shape, the RSI bottom is rising.
Key Levels
Resistance above: 2184 (near EMA40, strong resistance level).
Support below: 2006 (previous low point, strong support).
ETH Trading Strategy:
Buy on dips (short-term long). ETH currently offers better value than BTC.
Entry point: Current price around 2092, or pull back to the 2060-2070 range.
Stop loss: Exit decisively if it falls below the 2000 mark.
Target: First target around 2180; if broken, it could challenge 2290.
Summary and Comprehensive Judgment from Expert Perspective

Strength Comparison: ETH > BTC.
Currently, ETH's recovery willingness is stronger than BTC. BTC is stagnating at high levels, posing a risk of a corrective decline; while ETH has already fallen deeply and is trying to build a double bottom or head and shoulders bottom structure.
Correlated Risks:
Although ETH is strong in the short term, the overall trend in the cryptocurrency market still watches BTC's movements. If BTC suddenly experiences a large waterfall decline below 74200, ETH will also be dragged down; at that time, all technical support will fail.
Operating Suggestions:
Aggressive: Long ETH, short BTC (hedging strategy), capitalizing on the price difference between the two.
Conservative: Wait until BTC's direction is clear. If BTC chooses to go down, wait for ETH to pull back to around 2000 to enter long; if BTC chooses to break upward, it won’t be too late to chase the rise.
One-sentence summary: BTC is "building up" but may also "fall after prolonged consolidation," while ETH is in a "bottom rebound" but needs to be cautious of "broader market drag."

Scan the QR code to follow the public account and communicate with me for more real-time market analysis and strategies free of charge
免责声明:本文章仅代表作者个人观点,不代表本平台的立场和观点。本文章仅供信息分享,不构成对任何人的任何投资建议。用户与作者之间的任何争议,与本平台无关。如网页中刊载的文章或图片涉及侵权,请提供相关的权利证明和身份证明发送邮件到support@aicoin.com,本平台相关工作人员将会进行核查。