Waves in the Cryptocurrency Sea: 5.26 Bitcoin (BTC) Market Analysis Reference:
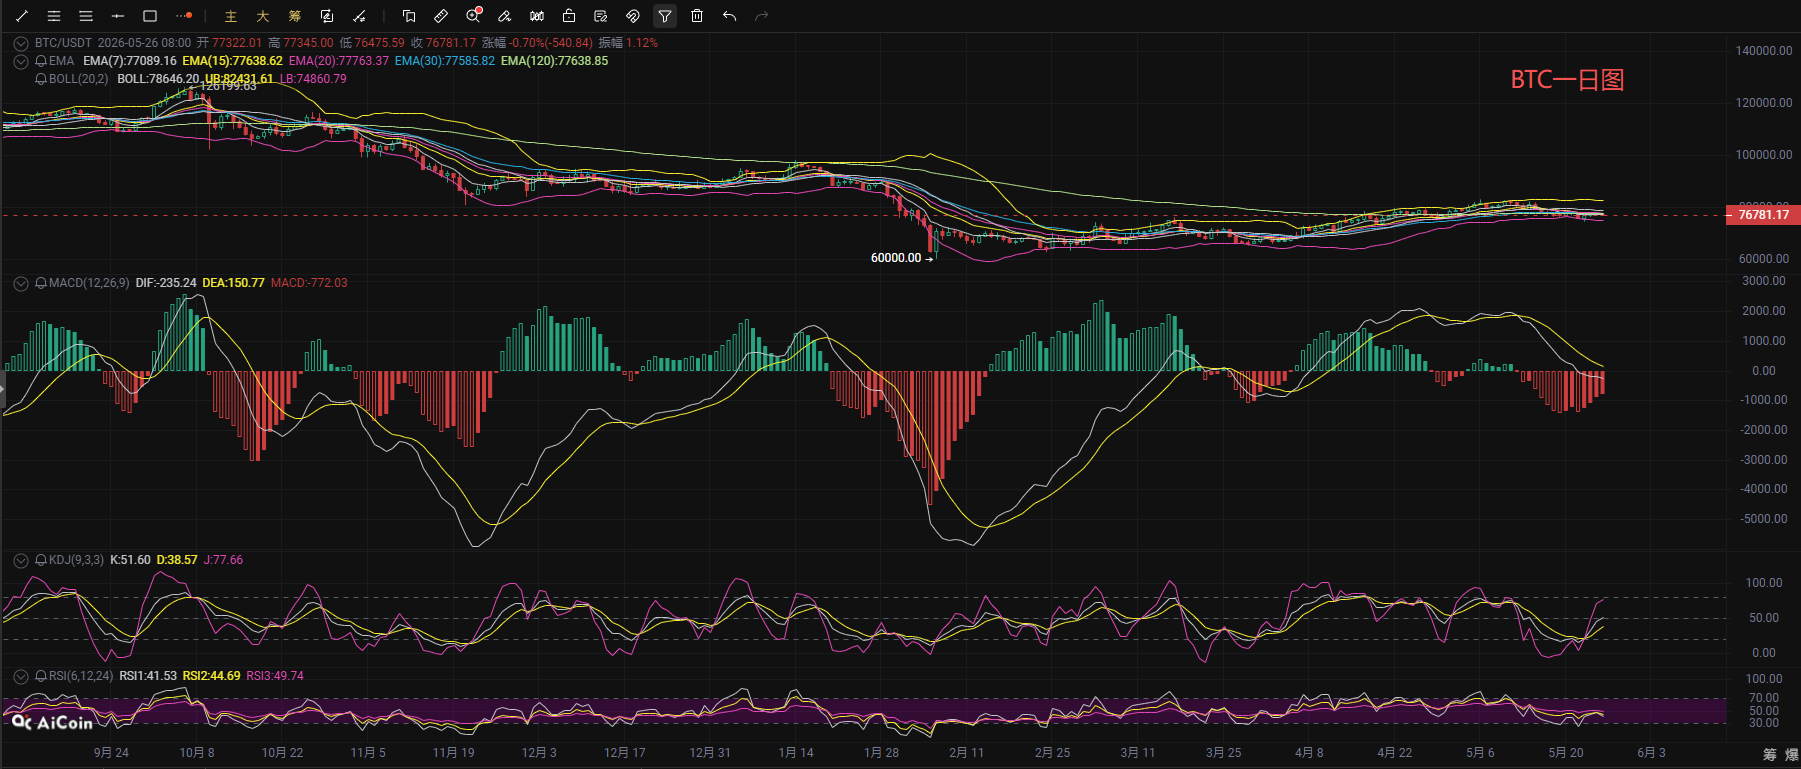
Bitcoin's current price is 76,800, and the daily market continues to show weak oscillation and consolidation. On the daily level, Bitcoin is currently in a clear retracement adjustment phase, running below the middle band of the Bollinger Bands, with the lower band serving as a key short-term support. The MACD indicator shows that the DIF line is still running below the DEA line, with the histogram continuously shortening but still in negative territory. Although bearish momentum has weakened, it has not completely reversed; the KDJ indicator's K line crosses above the D line, in the recovery phase after a golden cross, while the RSI indicator's three lines remain in the neutral zone but have not broken through the 50 strength line, showing an overall weak oscillation. At the same time, the price has fallen below the short-term EMA moving average group. If it cannot stand firm on the middle band of the Bollinger Bands, there is still a possibility of testing the lower band.
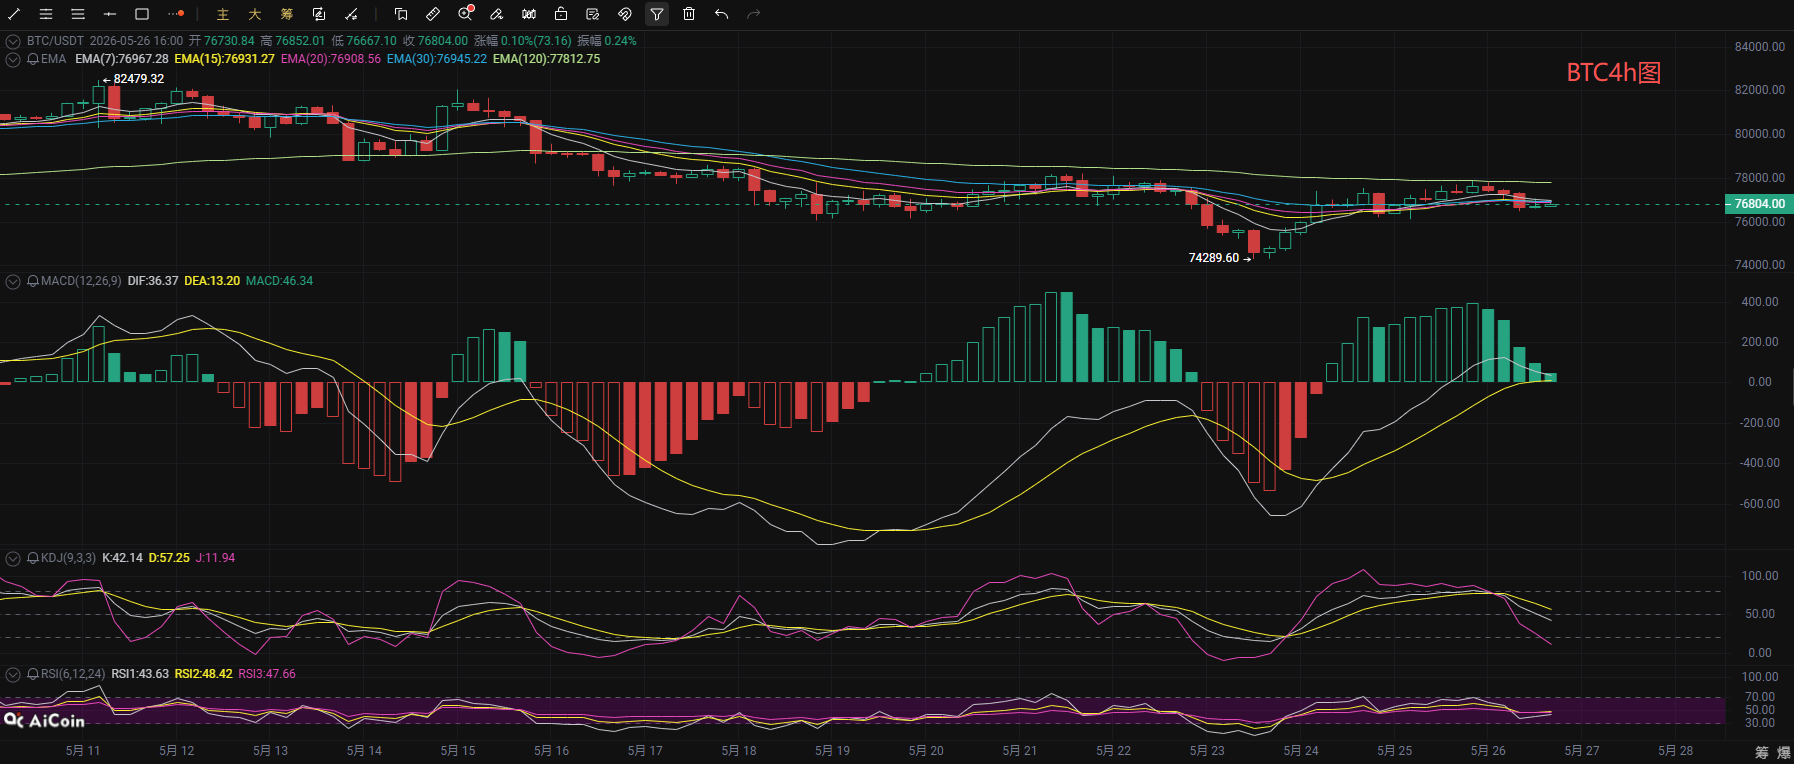
In the short-term 4-hour level, the price is in a narrow oscillating range after a low rebound, currently running near the middle band of the Bollinger Bands, with the bands’ opening narrowing, indicating a contraction of short-term fluctuations. The MACD indicator's DIF line is turning downward, with the histogram continuing to shorten, and bullish momentum has somewhat weakened; the KDJ indicator's three lines are turning downward from a high position, showing a short-term need for correction, with the lower Bollinger Band providing support. At the same time, the price is running near the short-term moving averages EMA7 and EMA15, with the long-term moving average EMA120 above forming pressure. The 4-hour level is in a consolidation phase after a rebound; if it cannot break through the upper band of the Bollinger Bands in the short term, it is highly likely to retest the middle band or even the lower band support. Only with a volume breakout above the upper band and stabilization can the rebound trend continue, launching an assault on the pressure level of the daily level. For operational advice, if there is resistance to the upside, short; if the support level stabilizes during the retreat, find an opportunity for a low buy.
Waves in the Cryptocurrency Sea: 5.26 Bitcoin Short-term Reference:
Long Position: Buy in the range of 75,400-76,200, stop loss at 74,000, target at 77,000-78,000.
Short Position: Sell in the range of 78,600-77,800, stop loss at 500 points, target at 77,500-76,500.
[The above analysis and strategies are for reference only, risks please bear yourself, the article's review and release may have delays, strategies do not possess timeliness, do not operate blindly]

The content of this article is shared exclusively by【Waves in the Cryptocurrency Sea】 and represents personal views only. There may be delays in sending the article, and it is for reference only, do not operate blindly! Want to get more real-time trades daily? Then follow my public account! Here, you can learn online technical analysis, and understand knowledge related to unlocking and exiting. I have years of research experience in the market, focusing on the major trends in the cryptocurrency sphere. I am mainly responsible for analyzing and guiding investment operations for BTC, ETH, SOL, BCH, and other cryptocurrencies. Welcome to research and learn together.
免责声明:本文章仅代表作者个人观点,不代表本平台的立场和观点。本文章仅供信息分享,不构成对任何人的任何投资建议。用户与作者之间的任何争议,与本平台无关。如网页中刊载的文章或图片涉及侵权,请提供相关的权利证明和身份证明发送邮件到support@aicoin.com,本平台相关工作人员将会进行核查。