Crypto Circle Academician: Be cautious of Ethereum's second bottom test on May 27! The daily trend's downward momentum has not dissipated; the key support level determines the subsequent major direction. Latest market analysis and operational advice.
Currently, Ethereum's price is 2070, the second largest crypto is fluctuating back and forth, sometimes I can't help but wonder if my rhythm is too slow? But looking back, I have survived in the market, although my gains are not significant, there are always opportunities available; what we need to do is to protect our principal and maintain our mindset. It's more important to avoid greed and to follow the trend than anything else. Let's take it slow and wait together for the next wave of movement.
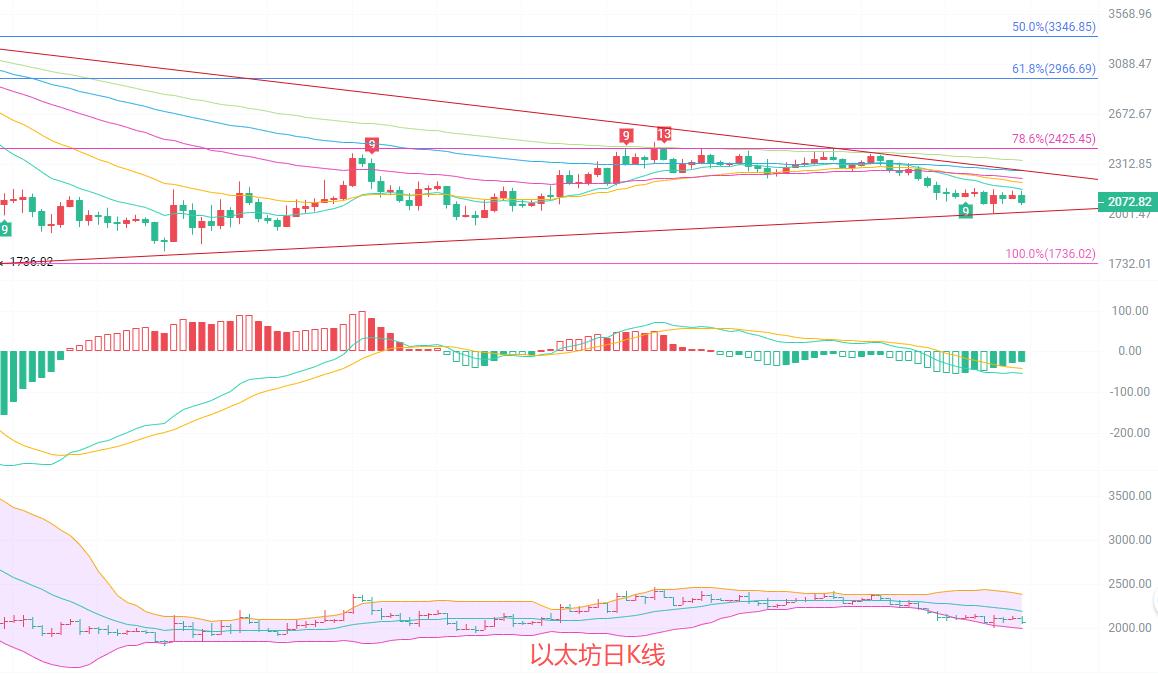
The daily K-line is in a weak consolidation state. The price is currently under pressure from the EMA15 and EMA30 moving averages, with short-term rebound strength lacking. The Bollinger Bands are continuously opening downwards, with the middle track around 2196 acting as strong resistance, and the lower track near 2003 as critical support. The MACD indicator DIF is operating below the zero axis, the green bars have reduced in volume but there has not been a clear reversal signal, and the downward trend remains dominant. No clear stabilization signal has appeared at the daily level, and it is highly likely that weak consolidation will continue going forward, so special attention should be paid to the effectiveness of the 2000 support level.
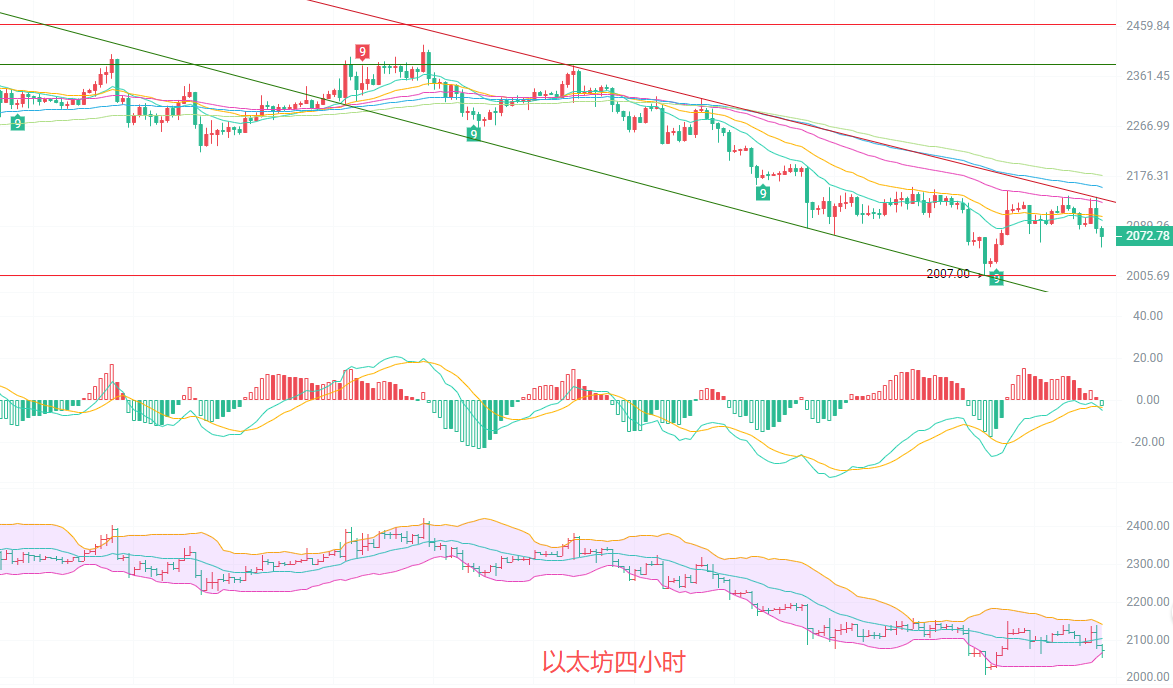
The four-hour K-line moving averages are aligned downward, and the price is squeezed by EMA15 and EMA30, limiting the rebound height. The Bollinger Bands are continuously narrowing, with the price operating below the middle track, and the upper track around 2140 poses strong pressure, with weak support at the lower track near 2064. The MACD indicator DIF and DEA are binding below the zero axis, and the red bars are continuously shortening, with upward momentum gradually diminishing; short-term rebounds are likely to be weak corrections, and the overall trend still leans downward. Short-term trading should be quick in and out to avoid being overly engaged.
Short-term Reference:
Move up from 2060 to 2010, stop loss at 1970, target at 2090 to 2130.
Move down from 2100 to 2130, stop loss at 2160, target at 2080 to 2040.
Breaking through the upper Bollinger Band pressure will invalidate the short positions. Current market conditions are weak; long positions are only for short-term bets, and short positions must wait for a rebound confirmation signal to enter the market, strictly maintaining stop losses, avoiding holding positions and heavy stakes.
Specific operations should be mainly based on real-time market data; for more detailed information, you can consult the author. There may be delays in article publication, and it is suggested for reference only; risk is borne by the reader.

Friendly reminder: The above content is solely created by the author on Weibo, and advertisements at the end of the article and in the comments section are unrelated to the author. Please discern carefully. Thank you for reading.
免责声明:本文章仅代表作者个人观点,不代表本平台的立场和观点。本文章仅供信息分享,不构成对任何人的任何投资建议。用户与作者之间的任何争议,与本平台无关。如网页中刊载的文章或图片涉及侵权,请提供相关的权利证明和身份证明发送邮件到support@aicoin.com,本平台相关工作人员将会进行核查。