Cryptocurrency Expert: On May 27, Bitcoin penetrates the surface to see the essence: The dual-cycle technical perspective sets the tone, and the mid to long-term rhythm is fully exposed! Latest market analysis and trading suggestions
Bitcoin's current price is 76,000. Now, the fluctuation and pullback of Bitcoin essentially means the market is digesting the previous upward momentum, with both bulls and bears re-engaging in a contest. Many cryptocurrency enthusiasts are anxious because they always want to predict the rise and fall of the next second, forgetting that trading itself is a game of probability. Therefore, there is no need to change all judgments because of one fluctuation; don’t let the market's noise cloud your judgment. Plan our trades before the market opens, execute our planned trades during the market, and leave the rest to time.
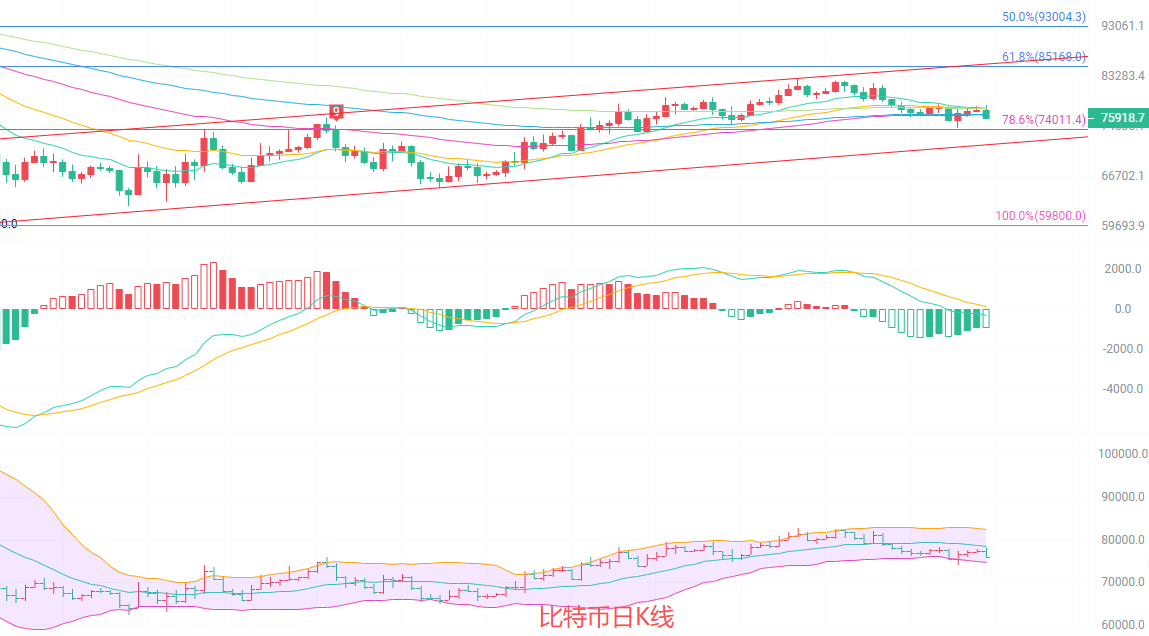
The daily K-line price has broken below the support of the EMA15 and EMA30 moving averages, indicating a weak short-term trend. In the EMA system, short-term moving averages are turning down while mid and long-term moving averages are gradually converging, with upward momentum significantly diminishing. The MACD indicator shows that the DIF continues to decline, with the histogram turning from red to green, indicating that downward strength is being released. The middle line of the Bollinger Bands at 78,564 creates strong resistance to the price, while the lower line at 74,675 constitutes support. The current price is below the middle line, generally presenting a weak oscillating pullback trend, and further downside risk should be guarded against.
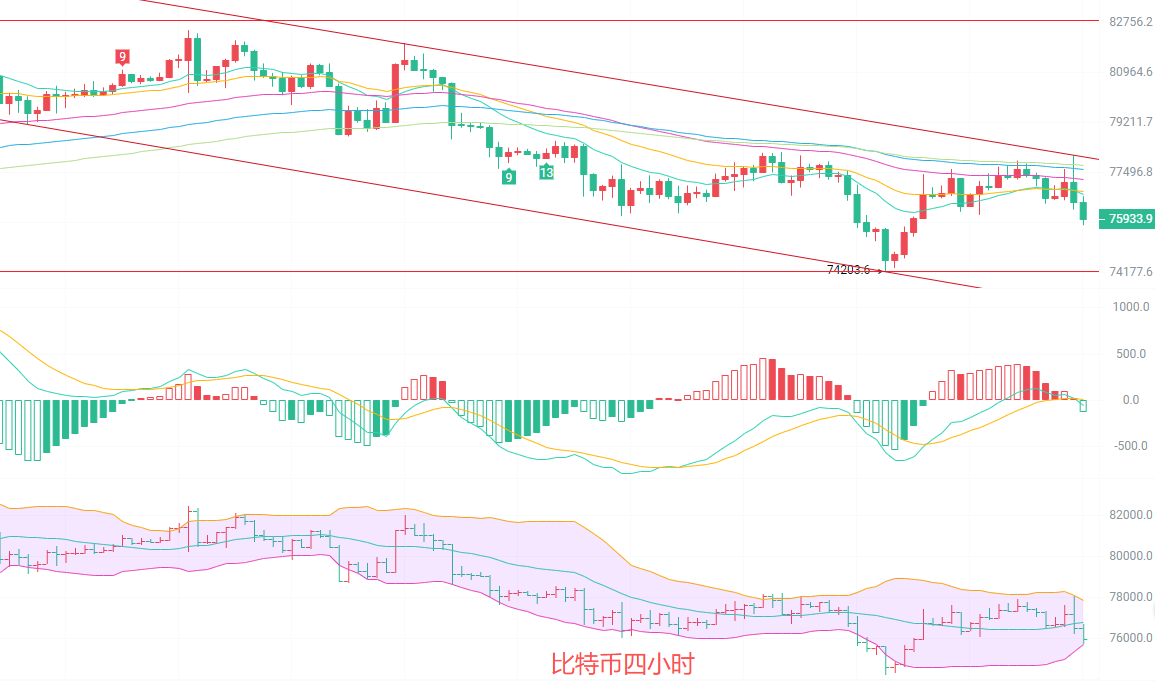
The four-hour K-line has rebounded near the EMA15, faced resistance, and pulled back. The current price has fallen below the EMA15 and EMA30 short-term moving averages, forming a short-term downward arrangement. The MACD indicator's DIF crosses below the DEA, and the histogram continues to turn green, with downward momentum still ongoing and the rebound strength weak. The Bollinger Bands' opening has narrowed slightly, with prices operating along the lower line of the Bollinger Bands, and the support level near 75,692 has been tested multiple times. If it cannot quickly reclaim the middle line of the Bollinger Bands at 76,788, the short-term will continue to maintain a oscillating downward pattern. The previous low near 74,200 is a key defensive area.
Short-term strategy reference: Follow the trend of the larger cycle, with small stop losses for quick entries and exits.
For positions above 76,600 to 77,000 going downward, stop loss at 77,400, target at 76,000 to 75,000.
For positions below 74,700 to 74,200 going upward, stop loss at 73,700, target at 76,000 to 77,000.
The current market is oscillating weakly; prioritize considering short positions on rebounds. Long positions should wait for clear stabilization signals to avoid blindly bottom-fishing.
Specific operations should be based on real-time market data. For more information, you can consult the author. The article may have a delay in publication; suggestions are for reference only, and risks are borne by the reader.

Warm Reminder: The above content is solely created by the author on Weibo. Advertisements at the end of the article and in the comments are unrelated to the author. Please be cautious in distinguishing, and thank you for reading.
免责声明:本文章仅代表作者个人观点,不代表本平台的立场和观点。本文章仅供信息分享,不构成对任何人的任何投资建议。用户与作者之间的任何争议,与本平台无关。如网页中刊载的文章或图片涉及侵权,请提供相关的权利证明和身份证明发送邮件到support@aicoin.com,本平台相关工作人员将会进行核查。