Good evening, everyone. I am Xin Ya.
Recently, the market sentiment is high, let me recite a poem.
New insights into market dynamics reveal hidden mysteries, Ya's keen observations distinguish the highs and lows. Explaining the true essence of the entangled threads, intertwining the network determines gains and losses.
Let’s briefly recap. Yesterday evening at ten o'clock, Bitcoin touched 78000 to deceive the line, faced resistance, and after more than an hour, the indicators produced a death cross, while the four-hour chart showed four consecutive bearish candles. When it dropped back to around 76000, there were no signs of market support. The price dropped to as low as 75300 before starting to rebound, and the intraday consolidation was running below 76000.
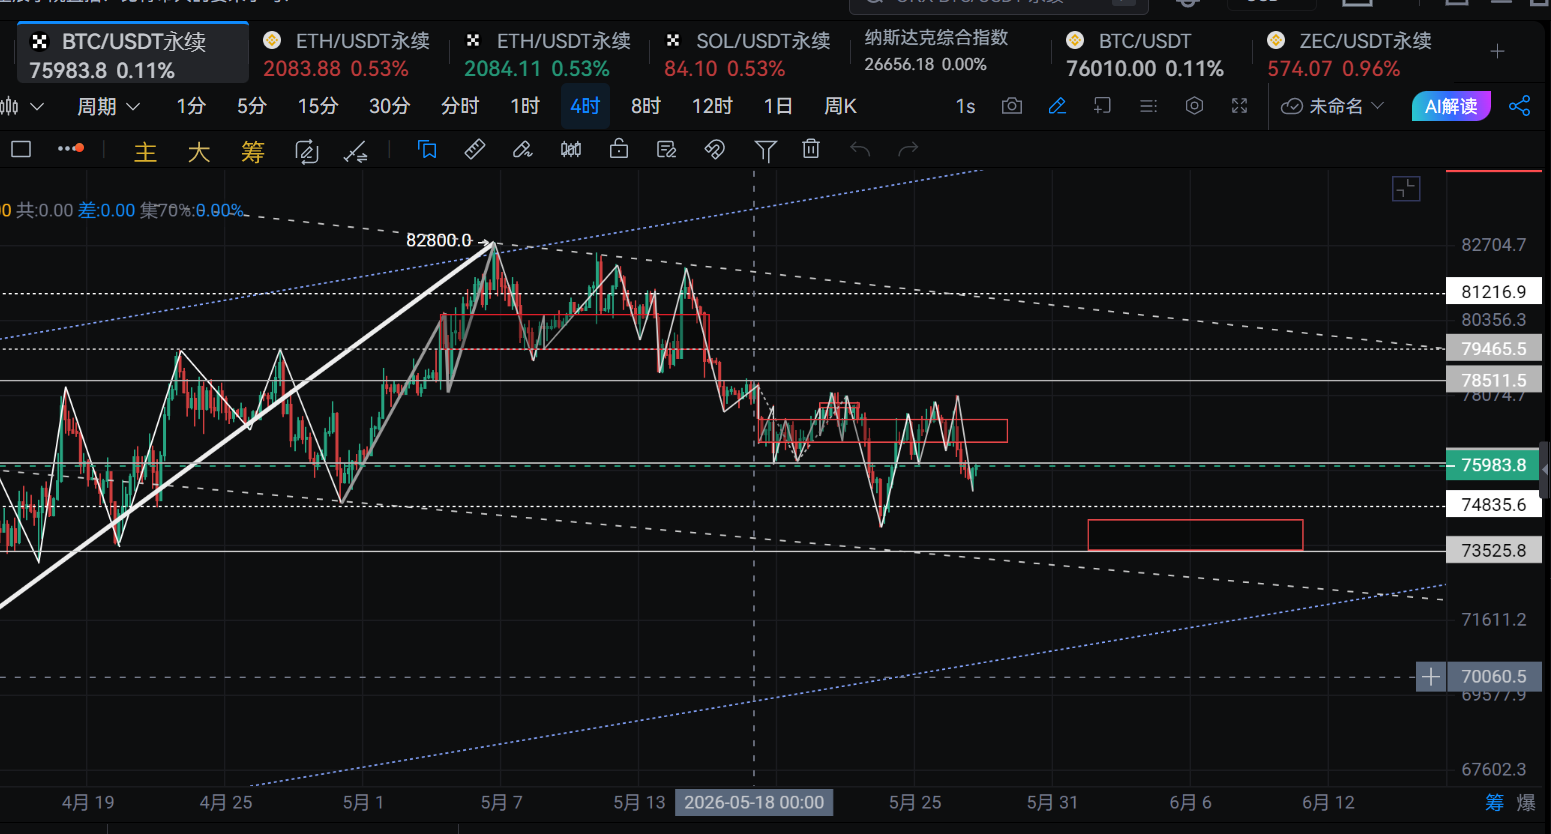
You can see that the indicators are warming up. At this position, the risks of bottom-hunting and short-selling are not small. We will continue with our previous thought process. Since the pressure came from around 78000 and tested 76000, there are two possible scenarios for the future market. The first scenario continues the previous rhythm. If it cannot break above the 76500 range, it will continue to test the 74800 level, which is the point of rise at the end of April. If it breaks below that, we will see 73500, which is an important tug-of-war point from the middle of April.
The second scenario is that it returns to the 76500 range, consolidates, and tests the four-hour EMA junction at the 77500-77800 range. After that, it will oscillate back and forth between 76500 and 77800.
It is important to note that the daily EMA 120 is also in this range.
And around 76500, it is the one-hour EMA 120 and 144, which is also below the one-hour center, having a certain suppression effect.
The current shape is still in the downward channel from mid-April and the upward channel that began in February, leaning towards the lower track. The lower support is at 74800 and 73500. The upper strong resistance is at 77800 and 78500.
So our approach is very simple: short at 76500, add at 77500, and look towards the 74800-75200 range. If it breaks, look towards the 73500 range. Conservative approach: short at 77500, add at 78200. This way, even if the market develops into the second scenario, it is easy to withdraw.
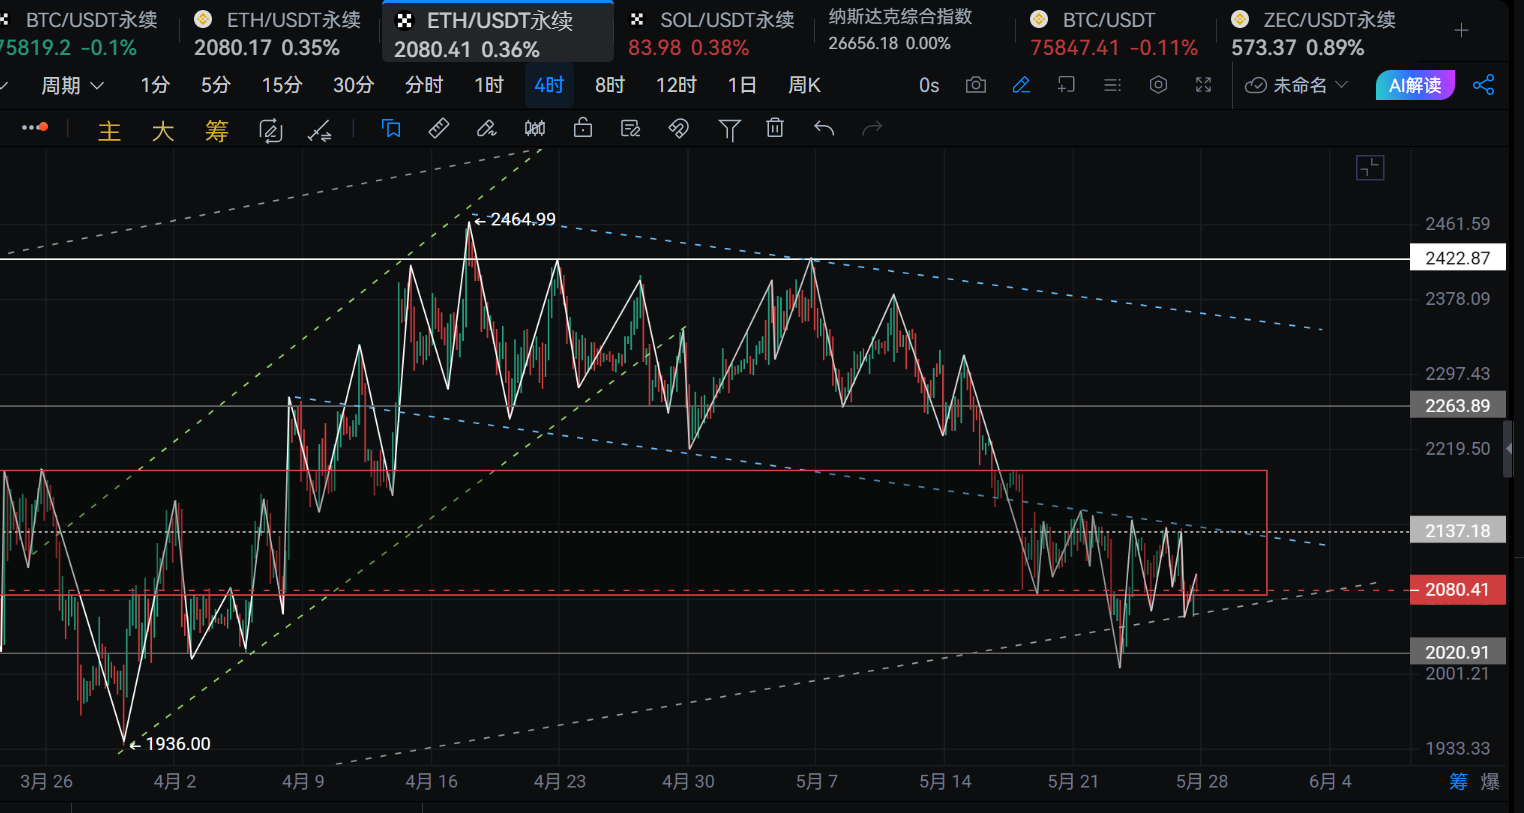
As for Ethereum, last night at six o'clock there was a deceptive line, the one-hour bullish candle surged from around 2080 to 2135. After running for three hours, while the MACD's bullish candle expanded, it began to face continuous selling pressure. Starting from nine o'clock, the one-hour chart showed five consecutive bearish candles, and both the KDJ and RSI produced death crosses within one hour. The lowest price dipped to 2054, close to the 2050 support. You can see this process where the selling pressure at the divergence point of 2080 amplified; we can mark this position as a very important divergence point. The market during today’s day session stepped briefly on the rising channel's lower track at 2056 since February, and then rebounded to 2093 before starting to fall back. Personally, I feel that there is a contest around the 2080 level.
Currently, the one-hour Bollinger Bands are narrowing, and the one-hour EMA 120 and 144 are both above 2100, while the four-hour EMA is far above at around 2180.
Over the past couple of days, we can observe the important divergence points; the upper one is at 2135, and the lower one at 2080. If there is strong willingness to counterattack from the bulls, it should rebound on the first time it tests 2080. Instead of continuing to test around 2050. This afternoon, they tested around 2050 for the second time without facing resistance when rebounding back to 2080. Thus, it can be seen that the market's continuity is very poor; the main force has not pursued victory but rather tends to oscillate.
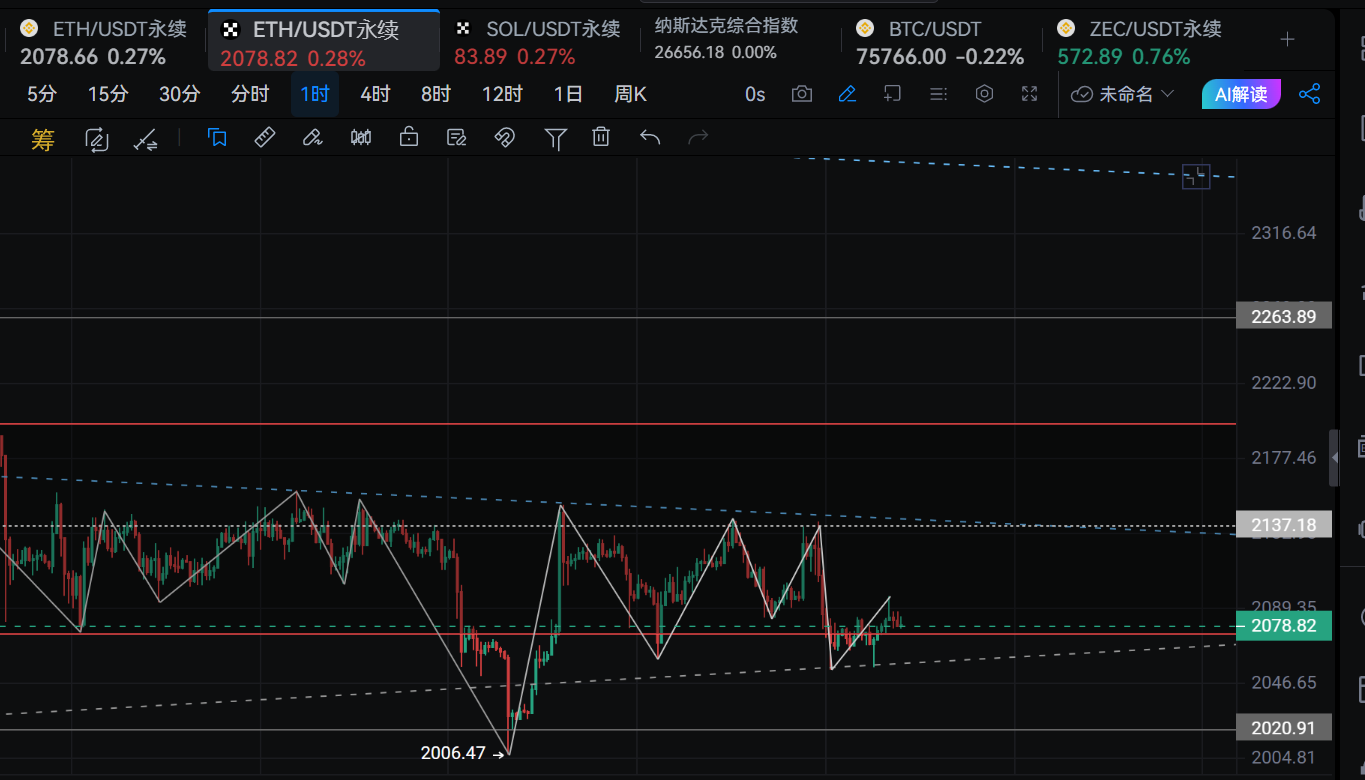
For the corresponding future market, there are two possibilities. The first is to continue testing 2050. If it breaks, it will test last week's lowest point around 2010. The second is to contest the 2080 range and then test upwards around 2115. The expected oscillation range is between 2050 and 2135. The reason why the current market is difficult to handle is due to the end-of-month option expiry and the main force engaging in a big direction confrontation. Therefore, at important positions, the disadvantaged side often has rescue operations.
Thus, what we need to do is enter the market at 2100-2115, and add at 2135. Even for the aggressive ones, plan the position leverage and enter in batches. Try to handle it with a one-way short approach. As mentioned yesterday, the risks of doing wave opportunities are increasing; for some volatility, you can only watch, not touch, otherwise, you will end up trapped or forced to sell.
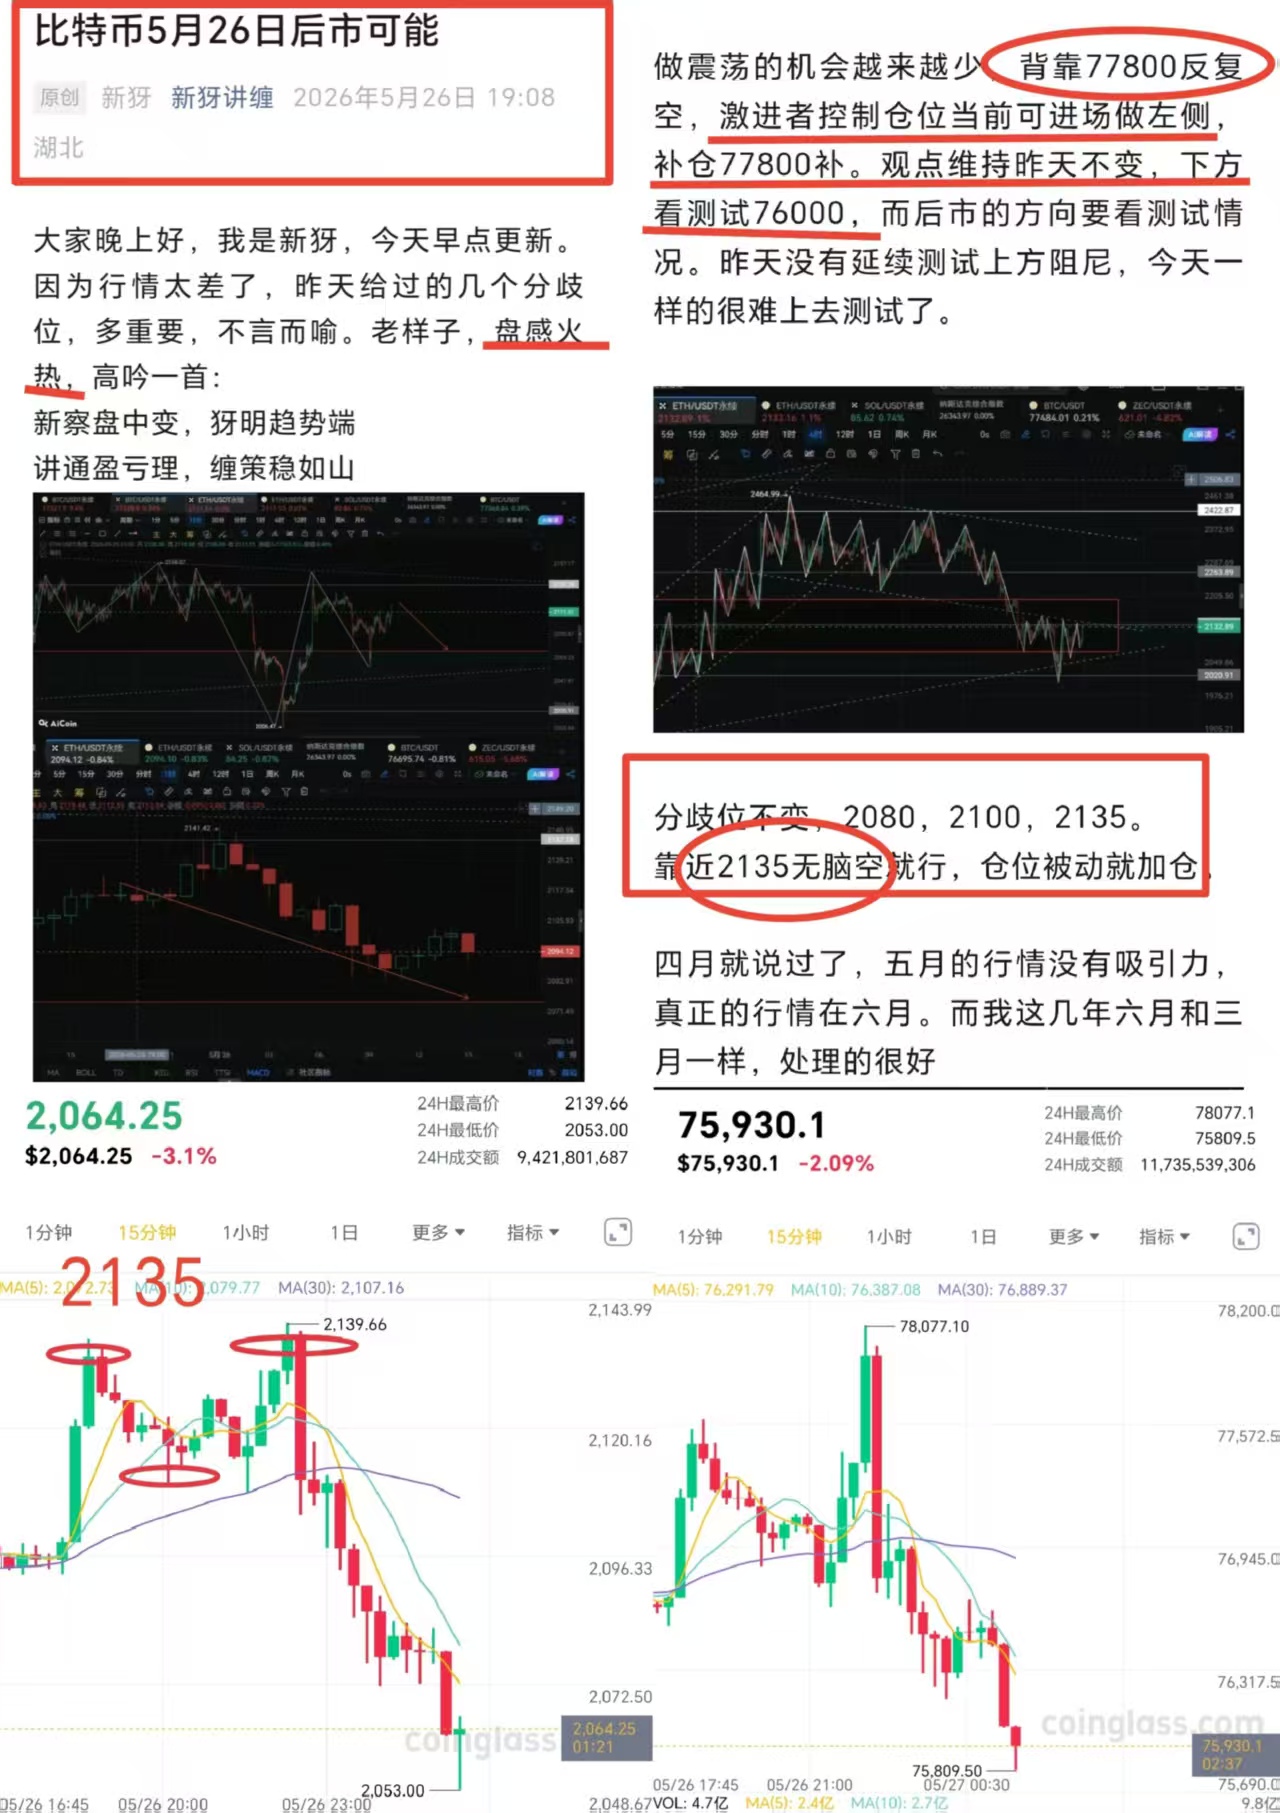
The thought process handled yesterday was excellent, providing double turning points at 77800 and 2135.
Follow my journey, WeChat public account: Xin Ya Talks about Chan.

免责声明:本文章仅代表作者个人观点,不代表本平台的立场和观点。本文章仅供信息分享,不构成对任何人的任何投资建议。用户与作者之间的任何争议,与本平台无关。如网页中刊载的文章或图片涉及侵权,请提供相关的权利证明和身份证明发送邮件到support@aicoin.com,本平台相关工作人员将会进行核查。